
8.1.4.1: Latimer Diagrams summarize elements' redox properties on a single line
- Page ID
- 199666
\( \newcommand{\vecs}[1]{\overset { \scriptstyle \rightharpoonup} {\mathbf{#1}} } \)
\( \newcommand{\vecd}[1]{\overset{-\!-\!\rightharpoonup}{\vphantom{a}\smash {#1}}} \)
\( \newcommand{\id}{\mathrm{id}}\) \( \newcommand{\Span}{\mathrm{span}}\)
( \newcommand{\kernel}{\mathrm{null}\,}\) \( \newcommand{\range}{\mathrm{range}\,}\)
\( \newcommand{\RealPart}{\mathrm{Re}}\) \( \newcommand{\ImaginaryPart}{\mathrm{Im}}\)
\( \newcommand{\Argument}{\mathrm{Arg}}\) \( \newcommand{\norm}[1]{\| #1 \|}\)
\( \newcommand{\inner}[2]{\langle #1, #2 \rangle}\)
\( \newcommand{\Span}{\mathrm{span}}\)
\( \newcommand{\id}{\mathrm{id}}\)
\( \newcommand{\Span}{\mathrm{span}}\)
\( \newcommand{\kernel}{\mathrm{null}\,}\)
\( \newcommand{\range}{\mathrm{range}\,}\)
\( \newcommand{\RealPart}{\mathrm{Re}}\)
\( \newcommand{\ImaginaryPart}{\mathrm{Im}}\)
\( \newcommand{\Argument}{\mathrm{Arg}}\)
\( \newcommand{\norm}[1]{\| #1 \|}\)
\( \newcommand{\inner}[2]{\langle #1, #2 \rangle}\)
\( \newcommand{\Span}{\mathrm{span}}\) \( \newcommand{\AA}{\unicode[.8,0]{x212B}}\)
\( \newcommand{\vectorA}[1]{\vec{#1}} % arrow\)
\( \newcommand{\vectorAt}[1]{\vec{\text{#1}}} % arrow\)
\( \newcommand{\vectorB}[1]{\overset { \scriptstyle \rightharpoonup} {\mathbf{#1}} } \)
\( \newcommand{\vectorC}[1]{\textbf{#1}} \)
\( \newcommand{\vectorD}[1]{\overrightarrow{#1}} \)
\( \newcommand{\vectorDt}[1]{\overrightarrow{\text{#1}}} \)
\( \newcommand{\vectE}[1]{\overset{-\!-\!\rightharpoonup}{\vphantom{a}\smash{\mathbf {#1}}}} \)
\( \newcommand{\vecs}[1]{\overset { \scriptstyle \rightharpoonup} {\mathbf{#1}} } \)
\( \newcommand{\vecd}[1]{\overset{-\!-\!\rightharpoonup}{\vphantom{a}\smash {#1}}} \)
\(\newcommand{\avec}{\mathbf a}\) \(\newcommand{\bvec}{\mathbf b}\) \(\newcommand{\cvec}{\mathbf c}\) \(\newcommand{\dvec}{\mathbf d}\) \(\newcommand{\dtil}{\widetilde{\mathbf d}}\) \(\newcommand{\evec}{\mathbf e}\) \(\newcommand{\fvec}{\mathbf f}\) \(\newcommand{\nvec}{\mathbf n}\) \(\newcommand{\pvec}{\mathbf p}\) \(\newcommand{\qvec}{\mathbf q}\) \(\newcommand{\svec}{\mathbf s}\) \(\newcommand{\tvec}{\mathbf t}\) \(\newcommand{\uvec}{\mathbf u}\) \(\newcommand{\vvec}{\mathbf v}\) \(\newcommand{\wvec}{\mathbf w}\) \(\newcommand{\xvec}{\mathbf x}\) \(\newcommand{\yvec}{\mathbf y}\) \(\newcommand{\zvec}{\mathbf z}\) \(\newcommand{\rvec}{\mathbf r}\) \(\newcommand{\mvec}{\mathbf m}\) \(\newcommand{\zerovec}{\mathbf 0}\) \(\newcommand{\onevec}{\mathbf 1}\) \(\newcommand{\real}{\mathbb R}\) \(\newcommand{\twovec}[2]{\left[\begin{array}{r}#1 \\ #2 \end{array}\right]}\) \(\newcommand{\ctwovec}[2]{\left[\begin{array}{c}#1 \\ #2 \end{array}\right]}\) \(\newcommand{\threevec}[3]{\left[\begin{array}{r}#1 \\ #2 \\ #3 \end{array}\right]}\) \(\newcommand{\cthreevec}[3]{\left[\begin{array}{c}#1 \\ #2 \\ #3 \end{array}\right]}\) \(\newcommand{\fourvec}[4]{\left[\begin{array}{r}#1 \\ #2 \\ #3 \\ #4 \end{array}\right]}\) \(\newcommand{\cfourvec}[4]{\left[\begin{array}{c}#1 \\ #2 \\ #3 \\ #4 \end{array}\right]}\) \(\newcommand{\fivevec}[5]{\left[\begin{array}{r}#1 \\ #2 \\ #3 \\ #4 \\ #5 \\ \end{array}\right]}\) \(\newcommand{\cfivevec}[5]{\left[\begin{array}{c}#1 \\ #2 \\ #3 \\ #4 \\ #5 \\ \end{array}\right]}\) \(\newcommand{\mattwo}[4]{\left[\begin{array}{rr}#1 \amp #2 \\ #3 \amp #4 \\ \end{array}\right]}\) \(\newcommand{\laspan}[1]{\text{Span}\{#1\}}\) \(\newcommand{\bcal}{\cal B}\) \(\newcommand{\ccal}{\cal C}\) \(\newcommand{\scal}{\cal S}\) \(\newcommand{\wcal}{\cal W}\) \(\newcommand{\ecal}{\cal E}\) \(\newcommand{\coords}[2]{\left\{#1\right\}_{#2}}\) \(\newcommand{\gray}[1]{\color{gray}{#1}}\) \(\newcommand{\lgray}[1]{\color{lightgray}{#1}}\) \(\newcommand{\rank}{\operatorname{rank}}\) \(\newcommand{\row}{\text{Row}}\) \(\newcommand{\col}{\text{Col}}\) \(\renewcommand{\row}{\text{Row}}\) \(\newcommand{\nul}{\text{Nul}}\) \(\newcommand{\var}{\text{Var}}\) \(\newcommand{\corr}{\text{corr}}\) \(\newcommand{\len}[1]{\left|#1\right|}\) \(\newcommand{\bbar}{\overline{\bvec}}\) \(\newcommand{\bhat}{\widehat{\bvec}}\) \(\newcommand{\bperp}{\bvec^\perp}\) \(\newcommand{\xhat}{\widehat{\xvec}}\) \(\newcommand{\vhat}{\widehat{\vvec}}\) \(\newcommand{\uhat}{\widehat{\uvec}}\) \(\newcommand{\what}{\widehat{\wvec}}\) \(\newcommand{\Sighat}{\widehat{\Sigma}}\) \(\newcommand{\lt}{<}\) \(\newcommand{\gt}{>}\) \(\newcommand{\amp}{&}\) \(\definecolor{fillinmathshade}{gray}{0.9}\)Latimer diagrams helpfully summarize elements' redox chemistry in a compact format
To see how Latimer diagrams work and why they are so useful, it is helpful to start with an example.
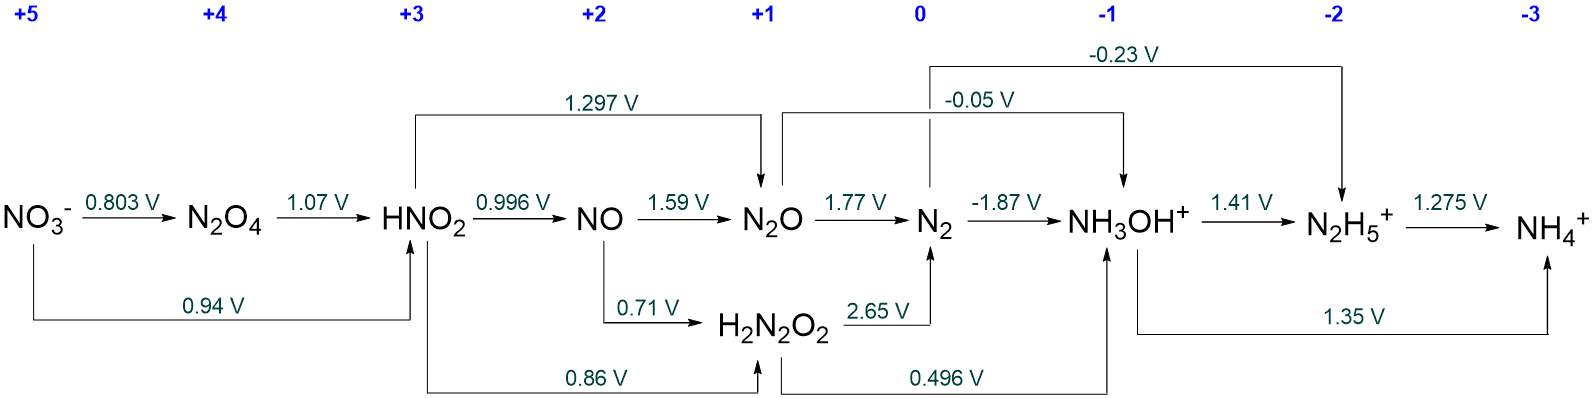
A selection of the redox reactions nitrogen is known to undergo in 1.0 M aqueous acid is given in Scheme \(\PageIndex{Ia}\).
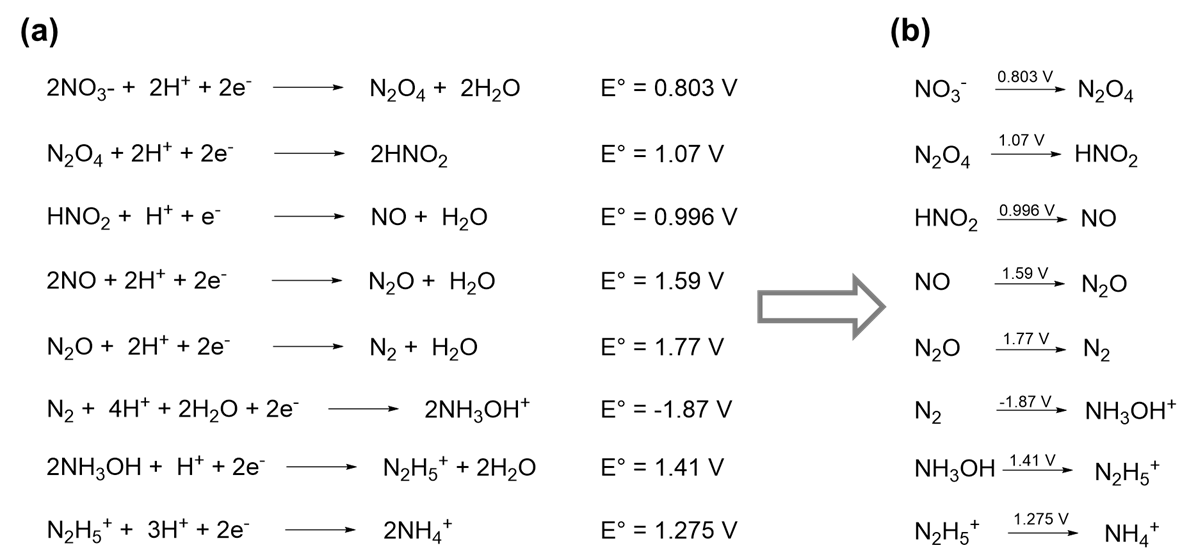
The most important information in Scheme \(\PageIndex{Ia}\) is the redox potentials and the identity of each nitrogen-containing species. In fact, if the latter are known, the number of electrons, water molecules, and any H+ (in acid) or OH- (in base) involved in the reduction may be deduced from the stoichiometry of the reaction. Consequently, the information in scheme \(\PageIndex{Ia}\) may be presented more compactly by only giving the nitrogen-containing species and by writing the associated redox potential for each reaction above its reaction arrow, as is shown in Scheme \(\PageIndex{Ib}\). Notice that in Scheme \(\PageIndex{Ib}\), the product of each half reaction is the reactant in the succeeding one. Because of this it is possible to represent the entire sequence of redox reactions even more compactly by writing out the reactions on a single line, as shown in Scheme II.

The type of diagram shown in Scheme \(\sf{\PageIndex{II}}\) is called a Latimer diagram. When interpreting Latimer diagrams, it can be helpful to look for two pieces of information.
- Whether the diagram corresponds to acidic (pH 0), basic (pH 14), or other solution conditions should be specified. In cases where it is not, it is customary to assume the diagram refers to behavior in pH 0 aqueous solution.
- The element's oxidation state, which makes it easier to keep track of the number of electrons involved in each reduction and to compare the redox behavior of related species. Oxidation states are commonly written above each chemical species, as is done in blue in Scheme \(\PageIndex{II}\).
When multiple pathways are available for interconverting two species in a Latimer diagram, these can be included by adding reaction arrows above and below the line. This is evident from the full pH 0 Latimer diagram for nitrogen given in Scheme \(\PageIndex{III}\).
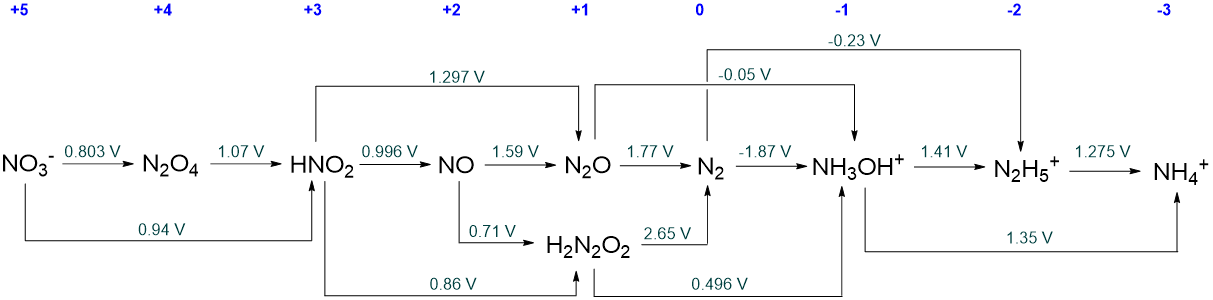
The diagram in Scheme \(\sf{\PageIndex{III}}\) presents a large number of possible interconversions. However, every possible interconversion is not represented. For example, the reduction potential for the reduction of N2O4 to NO is not presented. This type of selectivity is common in Latimer diagrams, but it does not necessarily mean that the missing conversions are not possible or that the potential has not been measured experimentally. Since \(\sf{\Delta G^{\circ} = -nFE^{\circ}}\), the potentials in Latimer diagrams are thermodynamic quantities and may always be calculated from solution thermodynamic parameters. In fact, some redox potentials reported in Latimer diagrams have been only determined that way. An example is the reduction potential of fluorine,
\[\sf{F_2(g)~~+~~2H^+~~2e^-~\rightarrow~~2HF~~~E^{\circ}~=~3.053~V~~in~~acid}\nonumber \]
This potential has not been experimentally measured since F2 is unstable in aqueous solution, reacting rapidly to give HF and O2.
\[\sf{2~F_2~~+~~2~H_2O~~\xrightarrow{fast}~~4~HF~+ O_2}\nonumber \]
When a potential is missing from a Latimer diagram, it may always be calculated by constructing a thermodynamic cycle involving the known and unknown potentials, as explained in Note \(\sf{\PageIndex{1}}\) at the bottom of this page.
Latimer diagrams are also useful for comparing elements' redox properties and determining whether a substance is stable to disproportionation.
Latimer diagrams not only provide a compact summary of an element's redox chemistry, but they also are useful for
1. Determining whether a species is thermodynamically unstable with respect to disproportionation.
Disproportionation occurs when a species reacts with itself to produce two or more stable products. For instance, in basic solution ReO3 can undergo disproportionation to ReO4- and ReO2·2H2O.
\[\sf{2Re^{VI}O_3 + 2H_2O \rightarrow Re^{VII}O_4^- + Re^VO_2\cdot2H_2O}\nonumber \]
As with all redox reactions, disproportionation reactions are thermodynamically favored when they possess a positive reaction potential. To see when this will be the case it is helpful to separate the disproportionation reaction into its half reactions:
\[\sf{Reduction: Re^{VI}O_3 + H_2O + 2H^+ + e^- \rightarrow Re^VO_2\cdot2H_2O~~~~~~~~~~~~~~~~~~~~~~~~~~~~~~~~~~~~~~~~~E^{\circ}=-0.446 V}\nonumber \]
\[\sf{Oxidation: Re^{VI}O_3 + H_2O \rightarrow Re^{VII}O_4^- + 2H^+ + e^-~~~~~~~~~~~~~~~~~~~~~~~~~~~~~~~~~~~~~~~~~~~~~~~~E^{\circ}=+0.889 V}\nonumber \]
\[\sf{Sum: 2Re^{VI}O_3 + 2H_2O \rightarrow Re^{VII}O_4^- + Re^VO_2\cdot2H_2O~~~~~~~~E^{\circ}=-0.446 V + 0.889 V = +0.443 V}\nonumber \]
Notice that the disproportionation of ReO3 in basic solution is favored because the favorable reaction potential for ReO3 oxidation is larger in magnitude than the negative oxidation potential for ReO3 reduction.
The ReO3 disproportionation reaction is a specific instance of a general case. Any species possessing a standard reduction potential that is more positive than the standard reduction potential leading to their formation is thermodynamically unstable with respect to disproportionation. This situation is easy to recognize using a Latimer diagram; species are unstable to disproportionation if the potential on their right is more positive than that on their left.
The Latimer diagram that has been reported for Cr in pH 14 aqueous solution is given below. Which, if any, species are unstable with respect to disproportionation?
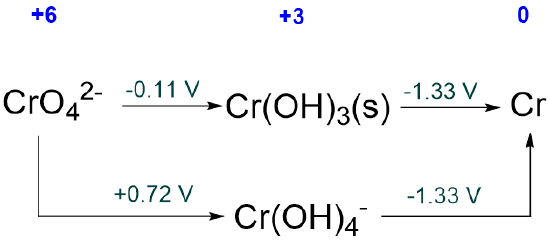
Solution
All of the species are stable with respect to disproportionation since all the potentials on the right of all the Cr3+ intermediates are less than those on their left.
The Latimer diagram for Cr in pH 0 aqueous solution is given below. Which, if any, species are unstable with respect to disproportionation?
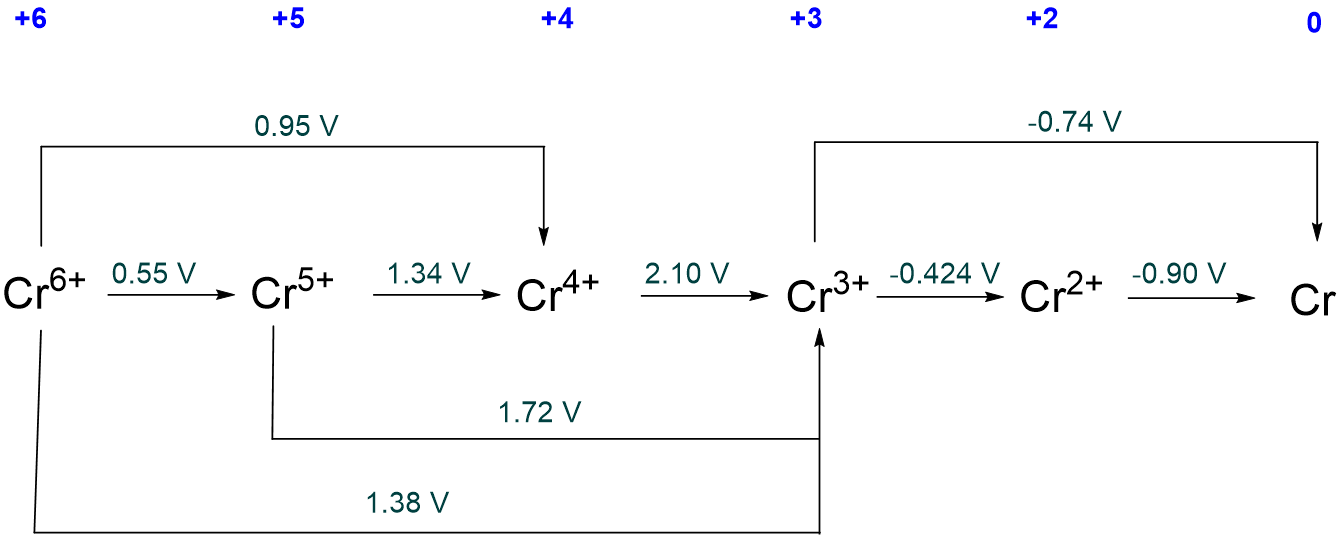
Solution
Both Cr5+ and Cr4+ are unstable towards disproportionation since the potentials on their right (for their reduction) are greater than the potentials on their left (for their formation by reduction).
Which manganese species are unstable with respect to disproportionation in aqueous solution under acidic and basic conditions? What will each of these metastable species give on disproportionation? The Latimer diagrams for manganese are given below.
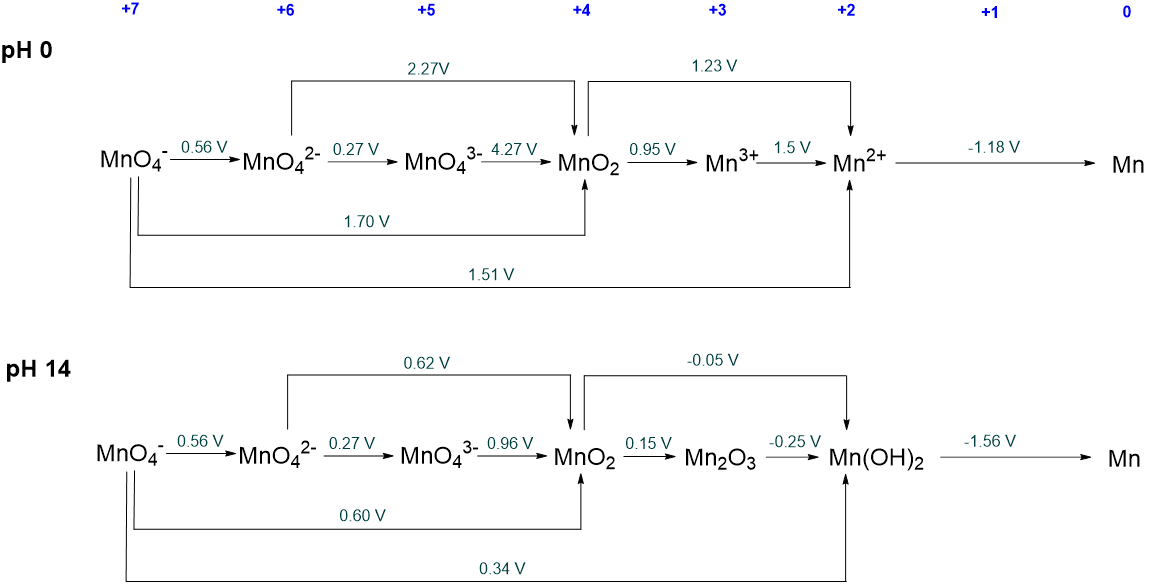
Solution
Under acidic conditions the following species are unstable with respect to disproportionation:
- MnO42- is unstable with respect to disproportionation to MnO4- and MnO2.
- MnO43- is unstable with respect to MnO42- and MnO2. However, since MnO42- is unstable with respect to disproportionation the ultimate products of the disproportionation will be MnO4- and MnO2.
- Mn3+ is unstable towards disproportionation to MnO2 and Mn2+.
Under basic conditions the following species are unstable with respect to disproprtionation:
- MnO42- is unstable with respect to disproportionation to MnO4- and MnO2.
- MnO43- is unstable with respect to MnO42- and MnO2. However, since MnO42- is unstable with respect to disproportionation, the ultimate products of the disproportionation will be MnO4- and MnO2.
Notice that the +3 oxidation state of Mn is stable under basic conditions but not acidic ones.
- Answer
-
They will be all the intermediate species for which the redox potential on their right is more positive than that on their left. These are N2O4, HNO2, NO, N2O, H2N2O2, and NH3OH+.
As far as you are able, determine what each metastable nitrogen species will disproportionate to at pH 0.
- Answer
-
Initially the metastable species will disproportionate to give their immediate neighbors in the Latimer diagram.
However, many of these neighbors are themselves metastable with respect to disproportionation, and so ultimately disproportionation will only stop when species that are stable towards disproportionation are reached.
In the case of N2O4, HNO2, NO, N2O, and H2N2O2, disproportionation will ultimately give NO3- and N2.
For NH3OH+, disproportionation will give N2 and N2H5.
2. Comparing the redox chemistry of an element under different conditions (typically pH 0 and pH 14). This is well-illustrated by the Latimer diagrams of chromium explored in Examples \(\PageIndex{1}\) and \(\PageIndex{2}\). A simple instance involves the acidic and basic Latimer diagrams of mercury shown in Scheme \(\PageIndex{IV}\).
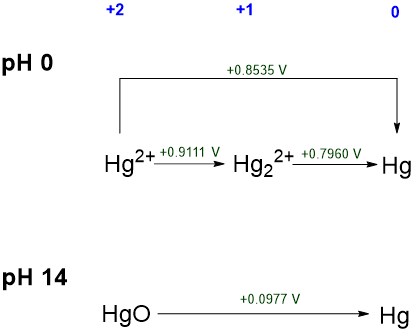
From Scheme \(\PageIndex{IV}\), several things are clear about mercury's redox chemistry under acidic and basic conditions:
- Mercury(I) ion, Hg22+, is thermodynamically stable under acidic conditions, but it is not likely stable under basic conditions. This may be inferred from its absence in the pH 14 diagram, which suggests that it is not readily formed under basic conditions.
- Elemental mercury is the thermodynamically most stable form of the element under both acidic and basic conditions. This may be inferred because the standard reduction potential for all mercury +2 and +1 species is positive.
- In both its +1 and +2 oxidation states (Hg2+ and Hg22+ ions), mercury is a fairly powerful oxidant under acidic conditions (with \(\sf{E^{\circ}}\) 0.796 - 0.9111 V). In contrast, under basic conditions the +2 form of mercury (HgO) is only a weak oxidant \(\sf{E^{\circ}}\) = 0.0977 V.
- All of the mercury species represented are thermodynamically stable towards disproportionation.
3. Comparing the redox chemistry of different elements under similar conditions. For instance, the redox behavior of mercury and its cogeners in acid solution may be easily compared using the Latimer diagrams (Scheme \(\PageIndex{V}\)).
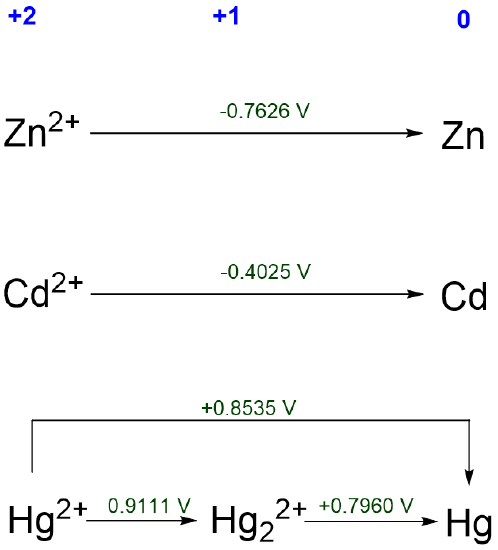
From Scheme \(\PageIndex{V}\), it is clear that Zn and Cd exhibit similar redox behavior. Both should dissolve at pH 0 to give dications. In contrast, elemental mercury should be stable towards acid. Mercury is also the only group 12 element for which the +1 oxidation state is stable.
As the examples above indicate, Latimer diagrams are helpful summaries of elements' redox chemistry, but it still requires a fair bit of careful reading to use them to make sense of trends in elements' redox chemistry or to trace out the disproportionation products of a given redox state. The published diagrams also tend to be limited to describing the redox chemistry of the elements under conditions of extreme pH. Fortunately, a variety of graphical representations of elements' redox chemistry have been developed that are particularly useful for estimating the dominant form of an element under a given set of conditions and for making sense of trends in elements' redox chemistry. These graphical methods will be described in the next two sections.
Potentials that are not shown in a Latimer diagram may always be calculated by constructing a thermodynamic cycle. Consider the interconversion of N2O4 to NO, \(\sf{E^{\circ}_{IV/II}}\), the value of which is not given in the standard nitrogen Latimer diagram presented in Scheme \(\PageIndex{sf{II}}\). Part of that diagram is reproduced as Scheme \(\PageIndex{\sf{VI}}\) below.
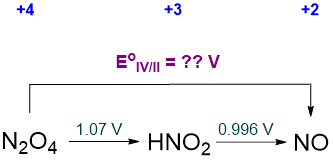
The relevant thermodynamic cycle that may be used to calculate the unknown potential involves the free energies and is depicted in Scheme \(\PageIndex{\sf{VII}}\).
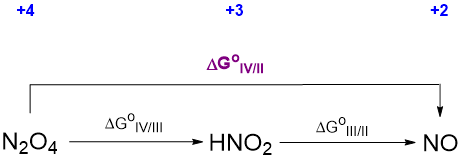
The free energy for each conversion step in the cycle is related to the corresponding potential by the relationship
\[\sf{\Delta G^{\circ} = nFE^{\circ}}\nonumber \]
where n is the number of electrons involved in each step. With this substitution, the thermodynamic cycle above may be converted to the one shown in Scheme \(\PageIndex{\sf{VIII}}\).
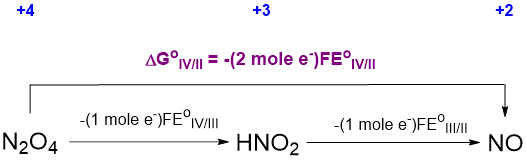
From Scheme \(\PageIndex{\sf{VIII}}\) it may be seen that
\[\sf{\Delta G^{\circ}_{IV/II}~~=~~-(2~mol~e^-)FE^{\circ}_{IV/II}~~=~~-(1~mol~e^-)FE^{\circ}_{IV/III} -(1~mol~e^-)FE^{\circ}_{III/II}}\nonumber \]
Cancelling the constant F and replacing the unknown potentials with the values in Scheme \(\PageIndex{\sf{VI}}\) gives
\[\sf{-(2~mol~e ^-)E^{\circ}_{IV/II}~~=~~-(1~mol~e^-)(1.07~V)~~-~~(1~mol~e^-)(0.996~V)}\nonumber \]
from which \(\sf{E^{\circ}_{IV/II}}\) may be calculated, giving \(\sf{E^{\circ}_{IV/II}}\) = +1.033 V.
References
1. All standard reduction potentials are taken from Bard, A. J.; Parsons, R.; Jordan, J. Standard potentials in aqueous solution. M. Dekker: New York, 1985.