17.3: Acid-Base Indicators
- Page ID
- 24301
\( \newcommand{\vecs}[1]{\overset { \scriptstyle \rightharpoonup} {\mathbf{#1}} } \)
\( \newcommand{\vecd}[1]{\overset{-\!-\!\rightharpoonup}{\vphantom{a}\smash {#1}}} \)
\( \newcommand{\id}{\mathrm{id}}\) \( \newcommand{\Span}{\mathrm{span}}\)
( \newcommand{\kernel}{\mathrm{null}\,}\) \( \newcommand{\range}{\mathrm{range}\,}\)
\( \newcommand{\RealPart}{\mathrm{Re}}\) \( \newcommand{\ImaginaryPart}{\mathrm{Im}}\)
\( \newcommand{\Argument}{\mathrm{Arg}}\) \( \newcommand{\norm}[1]{\| #1 \|}\)
\( \newcommand{\inner}[2]{\langle #1, #2 \rangle}\)
\( \newcommand{\Span}{\mathrm{span}}\)
\( \newcommand{\id}{\mathrm{id}}\)
\( \newcommand{\Span}{\mathrm{span}}\)
\( \newcommand{\kernel}{\mathrm{null}\,}\)
\( \newcommand{\range}{\mathrm{range}\,}\)
\( \newcommand{\RealPart}{\mathrm{Re}}\)
\( \newcommand{\ImaginaryPart}{\mathrm{Im}}\)
\( \newcommand{\Argument}{\mathrm{Arg}}\)
\( \newcommand{\norm}[1]{\| #1 \|}\)
\( \newcommand{\inner}[2]{\langle #1, #2 \rangle}\)
\( \newcommand{\Span}{\mathrm{span}}\) \( \newcommand{\AA}{\unicode[.8,0]{x212B}}\)
\( \newcommand{\vectorA}[1]{\vec{#1}} % arrow\)
\( \newcommand{\vectorAt}[1]{\vec{\text{#1}}} % arrow\)
\( \newcommand{\vectorB}[1]{\overset { \scriptstyle \rightharpoonup} {\mathbf{#1}} } \)
\( \newcommand{\vectorC}[1]{\textbf{#1}} \)
\( \newcommand{\vectorD}[1]{\overrightarrow{#1}} \)
\(\newcommand{\ket}[1]{\left| #1 \right>} \)
\( \newcommand{\bra}[1]{\left< #1 \right|} \)
\( \newcommand{\braket}[2]{\left< #1 \vphantom{#2} \right| \left. #2 \vphantom{#1} \right>} \)
\( \newcommand{\qmvec}[1]{\mathbf{\vec{#1}}} \)
\( \newcommand{\op}[1]{\hat{\mathbf{#1}}}\)
\( \newcommand{\expect}[1]{\langle #1 \rangle}\)
\( \newcommand{\vectorDt}[1]{\overrightarrow{\text{#1}}} \)
\( \newcommand{\vectE}[1]{\overset{-\!-\!\rightharpoonup}{\vphantom{a}\smash{\mathbf {#1}}}} \)
\( \newcommand{\vecs}[1]{\overset { \scriptstyle \rightharpoonup} {\mathbf{#1}} } \)
\( \newcommand{\vecd}[1]{\overset{-\!-\!\rightharpoonup}{\vphantom{a}\smash {#1}}} \)
\(\newcommand{\avec}{\mathbf a}\) \(\newcommand{\bvec}{\mathbf b}\) \(\newcommand{\cvec}{\mathbf c}\) \(\newcommand{\dvec}{\mathbf d}\) \(\newcommand{\dtil}{\widetilde{\mathbf d}}\) \(\newcommand{\evec}{\mathbf e}\) \(\newcommand{\fvec}{\mathbf f}\) \(\newcommand{\nvec}{\mathbf n}\) \(\newcommand{\pvec}{\mathbf p}\) \(\newcommand{\qvec}{\mathbf q}\) \(\newcommand{\svec}{\mathbf s}\) \(\newcommand{\tvec}{\mathbf t}\) \(\newcommand{\uvec}{\mathbf u}\) \(\newcommand{\vvec}{\mathbf v}\) \(\newcommand{\wvec}{\mathbf w}\) \(\newcommand{\xvec}{\mathbf x}\) \(\newcommand{\yvec}{\mathbf y}\) \(\newcommand{\zvec}{\mathbf z}\) \(\newcommand{\rvec}{\mathbf r}\) \(\newcommand{\mvec}{\mathbf m}\) \(\newcommand{\zerovec}{\mathbf 0}\) \(\newcommand{\onevec}{\mathbf 1}\) \(\newcommand{\real}{\mathbb R}\) \(\newcommand{\twovec}[2]{\left[\begin{array}{r}#1 \\ #2 \end{array}\right]}\) \(\newcommand{\ctwovec}[2]{\left[\begin{array}{c}#1 \\ #2 \end{array}\right]}\) \(\newcommand{\threevec}[3]{\left[\begin{array}{r}#1 \\ #2 \\ #3 \end{array}\right]}\) \(\newcommand{\cthreevec}[3]{\left[\begin{array}{c}#1 \\ #2 \\ #3 \end{array}\right]}\) \(\newcommand{\fourvec}[4]{\left[\begin{array}{r}#1 \\ #2 \\ #3 \\ #4 \end{array}\right]}\) \(\newcommand{\cfourvec}[4]{\left[\begin{array}{c}#1 \\ #2 \\ #3 \\ #4 \end{array}\right]}\) \(\newcommand{\fivevec}[5]{\left[\begin{array}{r}#1 \\ #2 \\ #3 \\ #4 \\ #5 \\ \end{array}\right]}\) \(\newcommand{\cfivevec}[5]{\left[\begin{array}{c}#1 \\ #2 \\ #3 \\ #4 \\ #5 \\ \end{array}\right]}\) \(\newcommand{\mattwo}[4]{\left[\begin{array}{rr}#1 \amp #2 \\ #3 \amp #4 \\ \end{array}\right]}\) \(\newcommand{\laspan}[1]{\text{Span}\{#1\}}\) \(\newcommand{\bcal}{\cal B}\) \(\newcommand{\ccal}{\cal C}\) \(\newcommand{\scal}{\cal S}\) \(\newcommand{\wcal}{\cal W}\) \(\newcommand{\ecal}{\cal E}\) \(\newcommand{\coords}[2]{\left\{#1\right\}_{#2}}\) \(\newcommand{\gray}[1]{\color{gray}{#1}}\) \(\newcommand{\lgray}[1]{\color{lightgray}{#1}}\) \(\newcommand{\rank}{\operatorname{rank}}\) \(\newcommand{\row}{\text{Row}}\) \(\newcommand{\col}{\text{Col}}\) \(\renewcommand{\row}{\text{Row}}\) \(\newcommand{\nul}{\text{Nul}}\) \(\newcommand{\var}{\text{Var}}\) \(\newcommand{\corr}{\text{corr}}\) \(\newcommand{\len}[1]{\left|#1\right|}\) \(\newcommand{\bbar}{\overline{\bvec}}\) \(\newcommand{\bhat}{\widehat{\bvec}}\) \(\newcommand{\bperp}{\bvec^\perp}\) \(\newcommand{\xhat}{\widehat{\xvec}}\) \(\newcommand{\vhat}{\widehat{\vvec}}\) \(\newcommand{\uhat}{\widehat{\uvec}}\) \(\newcommand{\what}{\widehat{\wvec}}\) \(\newcommand{\Sighat}{\widehat{\Sigma}}\) \(\newcommand{\lt}{<}\) \(\newcommand{\gt}{>}\) \(\newcommand{\amp}{&}\) \(\definecolor{fillinmathshade}{gray}{0.9}\)- Explain the function and color changes of acid-base indicators
- Demonstrate how to select the proper indicator for a titration experiment
- Determine the acidic dissociation constants Ka or Kai of indicators.
Certain organic substances change color in dilute solution when the hydronium ion concentration reaches a particular value. For example, phenolphthalein is a colorless substance in any aqueous solution with a hydronium ion concentration greater than 5.0 × 10⁻⁹ M (pH < 8.3). In more basic solutions where the hydronium ion concentration is less than 5.0 × 10⁻⁹ M (pH > 8.3), it is red or pink. Substances such as phenolphthalein, which can be used to determine the pH of a solution, are called acid-base indicators. Acid-base indicators are either weak organic acids or weak organic bases.
The equilibrium in a solution of the acid-base indicator methyl orange, a weak acid, can be represented by an equation in which we use HIn as a simple representation for the complex methyl orange molecule:
\[\underbrace{\ce{HIn}_{(aq)}}_{\ce{red}}+\ce{H2O}_{(l)}⇌\ce{H3O+}_{(aq)}+\underbrace{\ce{In-}_{(aq)}}_{\ce{yellow}}\]
\[K_\ce{a}=\ce{\dfrac{[H3O+][In- ]}{[HIn]}}=4.0×10^{−4}\]
The anion of methyl orange, In−, is yellow, and the nonionized form, HIn, is red. When we add acid to a solution of methyl orange, the increased hydronium ion concentration shifts the equilibrium toward the nonionized red form, in accordance with Le Chatelier’s principle. If we add base, we shift the equilibrium towards the yellow form. This behavior is completely analogous to the action of buffers.
An indicator’s color is the visible result of the ratio of the concentrations of the two species In− and HIn. If most of the indicator (typically about 60−90% or more) is present as In−, then we see the color of the In− ion, which would be yellow for methyl orange. If most is present as HIn, then we see the color of the HIn molecule: red for methyl orange. For methyl orange, we can rearrange the equation for Ka and write:
\[\mathrm{\dfrac{[In^-]}{[HIn]}=\dfrac{[substance\: with\: yellow\: color]}{[substance\: with\: red\: color]}=\dfrac{\mathit{K}_a}{[H_3O^+]}}\]
This shows us how the ratio of \(\ce{\dfrac{[In- ]}{[HIn]}}\) varies with the concentration of hydronium ion. The above expression describing the indicator equilibrium can be rearranged:
\[\mathrm{\dfrac{[H_3O^+]}{\mathit{K}_a}=\dfrac{[HIn]}{[In^- ]}}\]
\[\mathrm{log\left(\dfrac{[H_3O^+]}{\mathit{K}_a}\right)=log\left(\dfrac{[HIn]}{[In^- ]}\right)}\]
\[\mathrm{log([H_3O^+])-log(\mathit{K}_a)=-log\left(\dfrac{[In^-]}{[HIn]}\right)}\]
\[\mathrm{-pH+p\mathit{K}_a=-log\left(\dfrac{[In^-]}{[HIn]}\right)}\]
\[\mathrm{pH=p\mathit{K}_a+log\left(\dfrac{[In^-]}{[HIn]}\right)\:or\:pH=p\mathit{K}_a+log\left(\dfrac{[base]}{[acid]}\right)}\]
The last formula is the same as the Henderson-Hasselbalch equation, which can be used to describe the equilibrium of indicators.
When [H3O+] has the same numerical value as Ka, the ratio of [In−] to [HIn] is equal to 1, meaning that 50% of the indicator is present in the red form (HIn) and 50% is in the yellow ionic form (In−), and the solution appears orange in color. When the hydronium ion concentration increases to 8 × 10⁻⁴ M (a pH of 3.1), the solution turns red. No change in color is visible for any further increase in the hydronium ion concentration (decrease in pH). At a hydronium ion concentration of 4 × 10⁻⁵ M (a pH of 4.4), most of the indicator is in the yellow ionic form, and a further decrease in the hydronium ion concentration (increase in pH) does not produce a visible color change. The pH range between 3.1 (red) and 4.4 (yellow) is the color-change interval of methyl orange; the pronounced color change takes place between these pH values.
Many different substances can be used as indicators, depending on the particular reaction to be monitored. For example, red cabbage juice contains a mixture of colored substances that change from deep red at low pH to light blue at intermediate pH to yellow at high pH (Figure \(\PageIndex{1}\)). In all cases, though, a good indicator must have the following properties:
- The color change must be easily detected.
- The color change must be rapid.
- The indicator molecule must not react with the substance being titrated.
- To minimize errors, the indicator should have a pKin that is within one pH unit of the expected pH at the equivalence point of the titration.

Red cabbage juice contains a mixture of substances whose color depends on the pH. Each test tube contains a solution of red cabbage juice in water, but the pH of the solutions varies from pH = 2.0 (far left) to pH = 11.0 (far right). At pH = 7.0, the solution is blue.
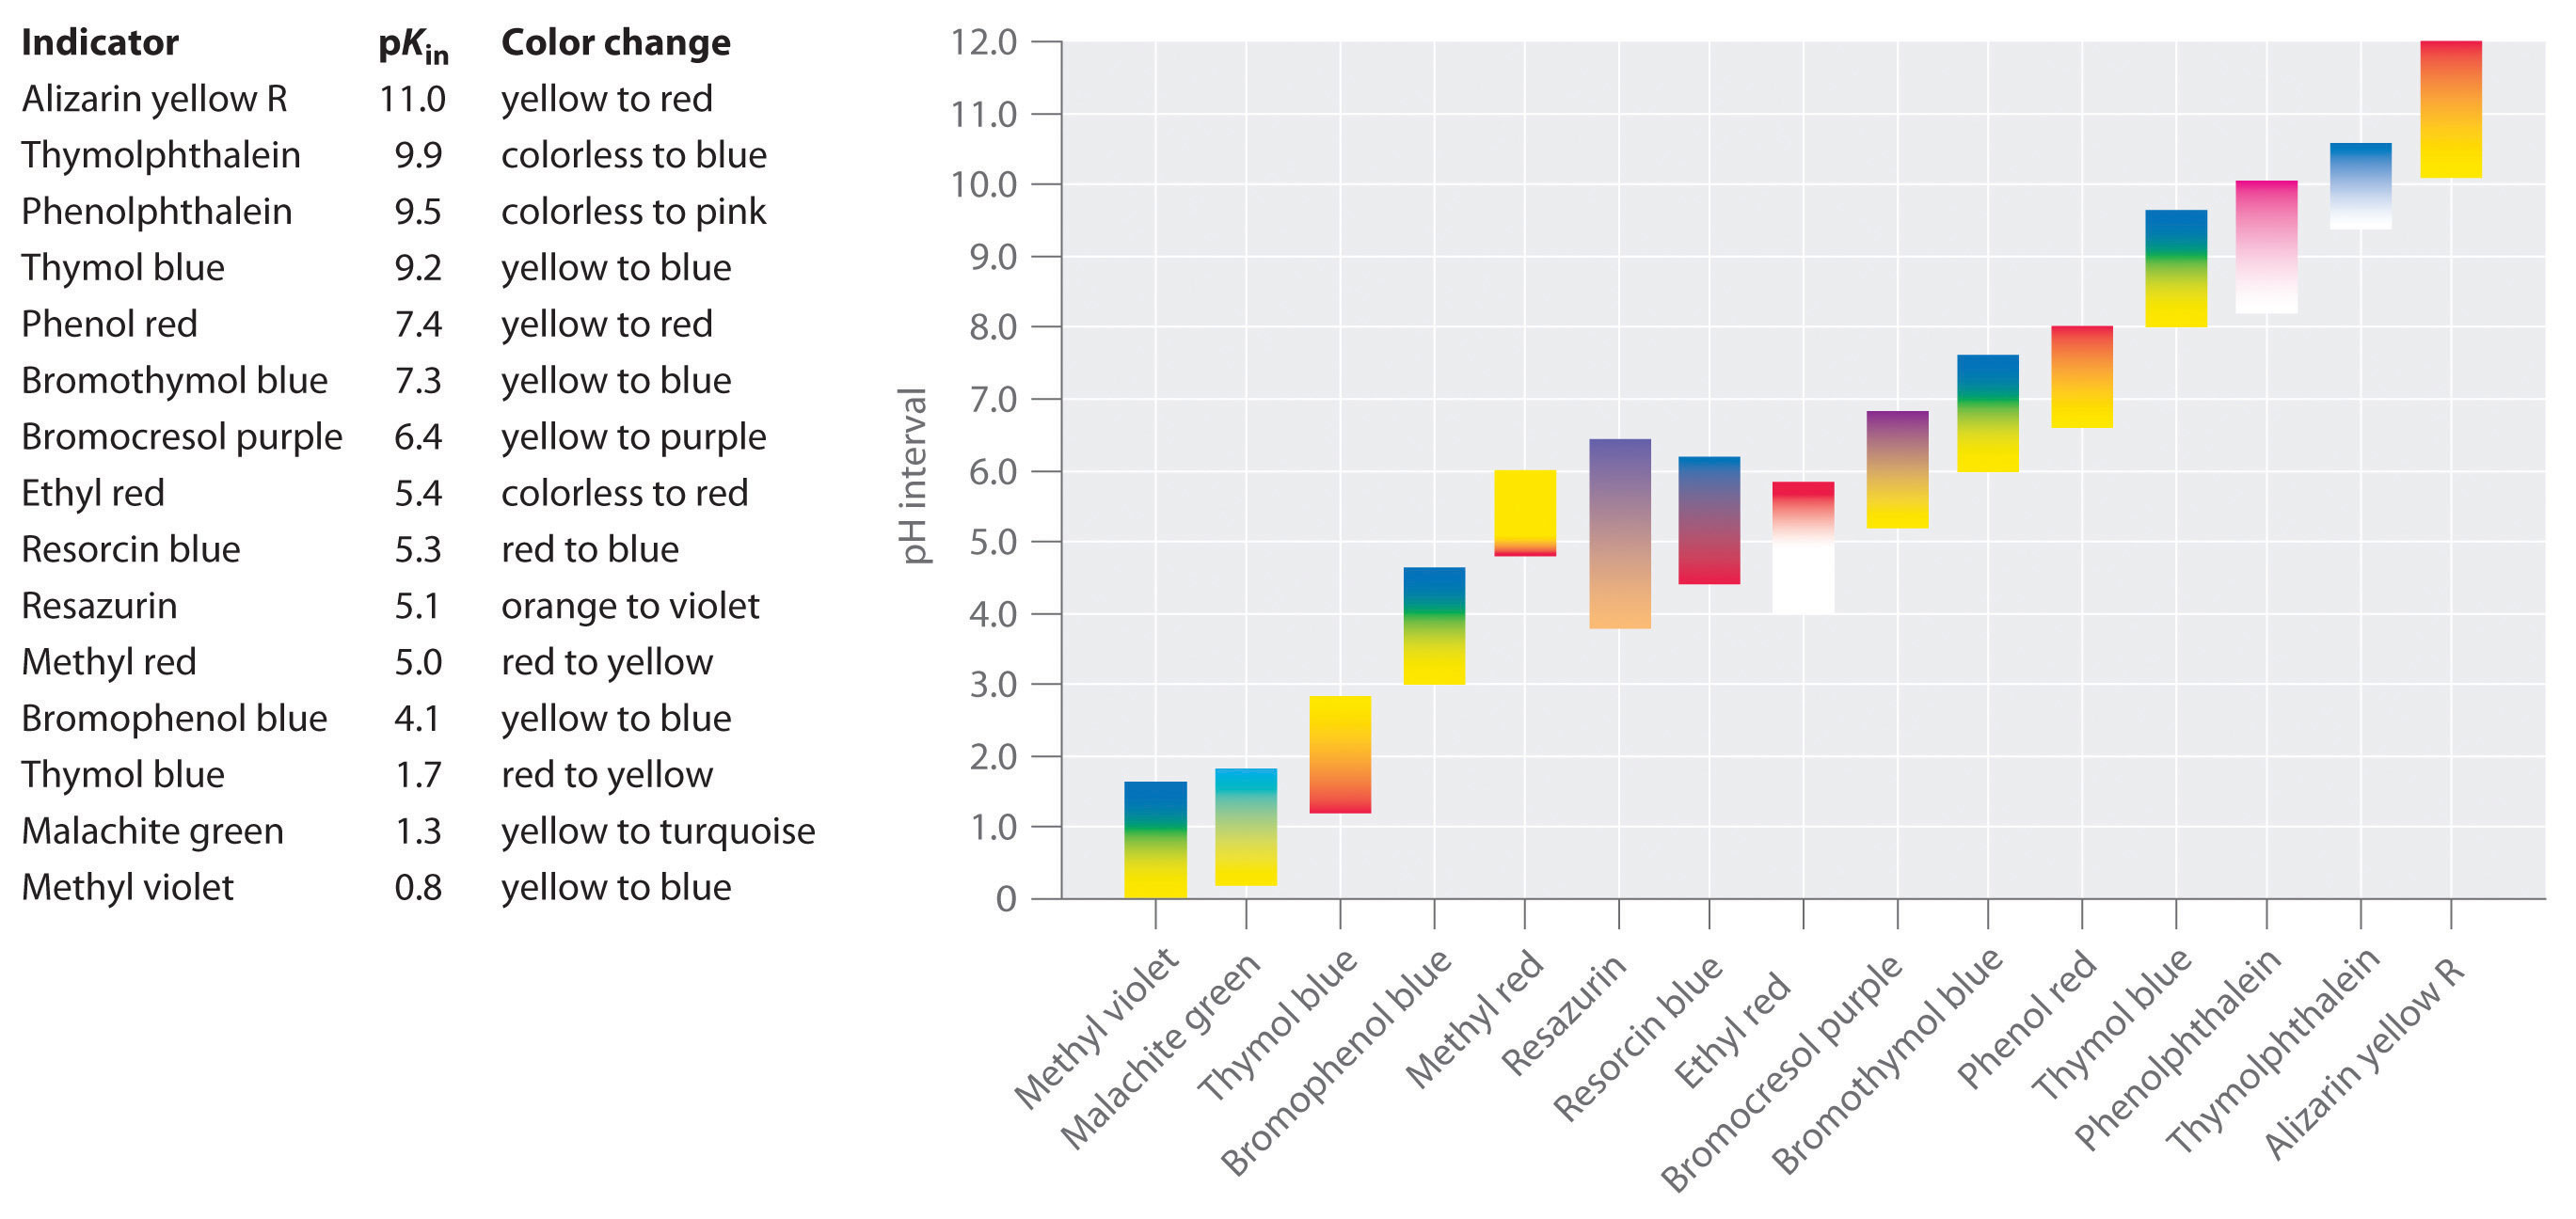
Synthetic indicators have been developed that meet these criteria and cover virtually the entire pH range. Figure \(\PageIndex{2}\) shows the approximate pH range over which some common indicators change color and their change in color. In addition, some indicators (such as thymol blue) are polyprotic acids or bases, which change color twice at widely separated pH values.

It is important to be aware that an indicator does not change color abruptly at a particular pH value; instead, it actually undergoes a pH titration just like any other acid or base. As the concentration of HIn decreases and the concentration of In− increases, the color of the solution slowly changes from the characteristic color of HIn to that of In−. As we will see in Section 16, the [In−]/[HIn] ratio changes from 0.1 at a pH one unit below pKin to 10 at a pH one unit above pKin. Thus most indicators change color over a pH range of about two pH units.
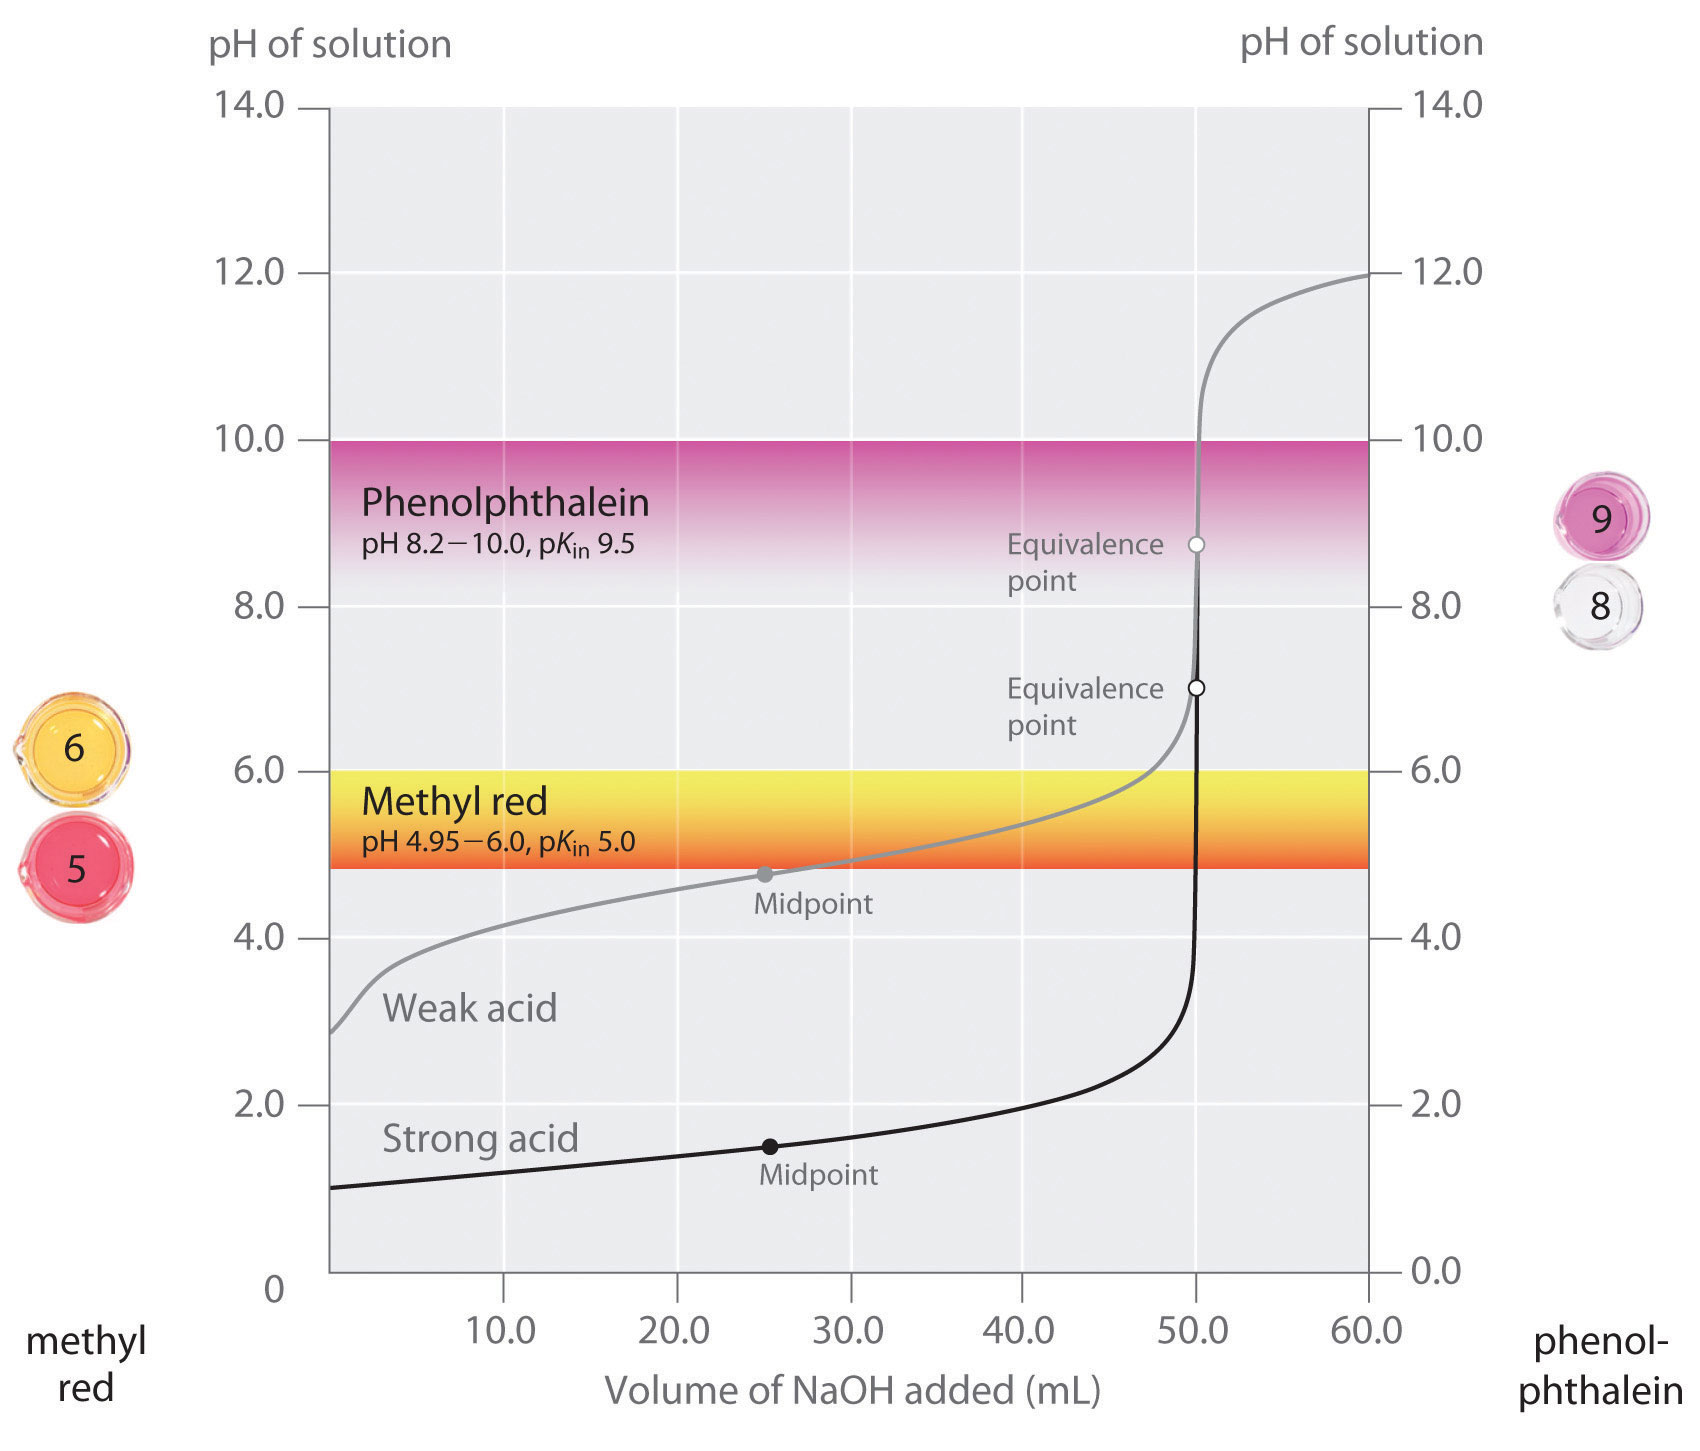
We have stated that a good indicator should have a pKin value that is close to the expected pH at the equivalence point. For a strong acid–strong base titration, the choice of the indicator is not especially critical due to the very large change in pH that occurs around the equivalence point. In contrast, using the wrong indicator for a titration of a weak acid or a weak base can result in relatively large errors, as illustrated in Figure \(\PageIndex{3}\). This figure shows plots of pH versus volume of base added for the titration of 50.0 mL of a 0.100 M solution of a strong acid (HCl) and a weak acid (acetic acid) with 0.100 M \(NaOH\). The pH ranges over which two common indicators (methyl red, \(pK_{in} = 5.0\), and phenolphthalein, \(pK_{in} = 9.5\)) change color are also shown. The horizontal bars indicate the pH ranges over which both indicators change color cross the HCl titration curve, where it is almost vertical. Hence both indicators change color when essentially the same volume of \(NaOH\) has been added (about 50 mL), which corresponds to the equivalence point. In contrast, the titration of acetic acid will give very different results depending on whether methyl red or phenolphthalein is used as the indicator. Although the pH range over which phenolphthalein changes color is slightly greater than the pH at the equivalence point of the strong acid titration, the error will be negligible due to the slope of this portion of the titration curve. Just as with the HCl titration, the phenolphthalein indicator will turn pink when about 50 mL of \(NaOH\) has been added to the acetic acid solution. In contrast, methyl red begins to change from red to yellow around pH 5, which is near the midpoint of the acetic acid titration, not the equivalence point. Adding only about 25–30 mL of \(NaOH\) will therefore cause the methyl red indicator to change color, resulting in a huge error.

The graph shows the results obtained using two indicators (methyl red and phenolphthalein) for the titration of 0.100 M solutions of a strong acid (HCl) and a weak acid (acetic acid) with 0.100 M \(NaOH\). Due to the steepness of the titration curve of a strong acid around the equivalence point, either indicator will rapidly change color at the equivalence point for the titration of the strong acid. In contrast, the pKin for methyl red (5.0) is very close to the pKa of acetic acid (4.76); the midpoint of the color change for methyl red occurs near the midpoint of the titration, rather than at the equivalence point.
In general, for titrations of strong acids with strong bases (and vice versa), any indicator with a pK in between about 4.0 and 10.0 will do. For the titration of a weak acid, however, the pH at the equivalence point is greater than 7.0, so an indicator such as phenolphthalein or thymol blue, with pKin > 7.0, should be used. Conversely, for the titration of a weak base, where the pH at the equivalence point is less than 7.0, an indicator such as methyl red or bromocresol blue, with pKin < 7.0, should be used.
In the titration of a weak acid with a strong base, which indicator would be the best choice?
- Methyl Orange
- Bromocresol Green
- Phenolphtalein
Solution
The correct answer is C. In the titration of a weak acid with a strong base, the conjugate base of the weak acid will make the pH at the equivalence point greater than 7. Therefore, you would want an indicator to change in that pH range. Both methyl orange and bromocresol green change color in an acidic pH range, while phenolphtalein changes in a basic pH.
The existence of many different indicators with different colors and pKin values also provides a convenient way to estimate the pH of a solution without using an expensive electronic pH meter and a fragile pH electrode. Paper or plastic strips impregnated with combinations of indicators are used as “pH paper,” which allows you to estimate the pH of a solution by simply dipping a piece of pH paper into it and comparing the resulting color with the standards printed on the container (Figure \(\PageIndex{4}\)).
pH Indicators: https://youtu.be/1IqzUa5lABs
Summary
Acid–base indicators are compounds that change color at a particular pH. They are typically weak acids or bases whose changes in color correspond to deprotonation or protonation of the indicator itself.
Contributors and Attributions
Paul Flowers (University of North Carolina - Pembroke), Klaus Theopold (University of Delaware) and Richard Langley (Stephen F. Austin State University) with contributing authors. Textbook content produced by OpenStax College is licensed under a Creative Commons Attribution License 4.0 license. Download for free at http://cnx.org/contents/85abf193-2bd...a7ac8df6@9.110).
- {template.ContribBoundless()}}

