14.2: Measuring Reaction Rates
- Page ID
- 24264
\( \newcommand{\vecs}[1]{\overset { \scriptstyle \rightharpoonup} {\mathbf{#1}} } \)
\( \newcommand{\vecd}[1]{\overset{-\!-\!\rightharpoonup}{\vphantom{a}\smash {#1}}} \)
\( \newcommand{\id}{\mathrm{id}}\) \( \newcommand{\Span}{\mathrm{span}}\)
( \newcommand{\kernel}{\mathrm{null}\,}\) \( \newcommand{\range}{\mathrm{range}\,}\)
\( \newcommand{\RealPart}{\mathrm{Re}}\) \( \newcommand{\ImaginaryPart}{\mathrm{Im}}\)
\( \newcommand{\Argument}{\mathrm{Arg}}\) \( \newcommand{\norm}[1]{\| #1 \|}\)
\( \newcommand{\inner}[2]{\langle #1, #2 \rangle}\)
\( \newcommand{\Span}{\mathrm{span}}\)
\( \newcommand{\id}{\mathrm{id}}\)
\( \newcommand{\Span}{\mathrm{span}}\)
\( \newcommand{\kernel}{\mathrm{null}\,}\)
\( \newcommand{\range}{\mathrm{range}\,}\)
\( \newcommand{\RealPart}{\mathrm{Re}}\)
\( \newcommand{\ImaginaryPart}{\mathrm{Im}}\)
\( \newcommand{\Argument}{\mathrm{Arg}}\)
\( \newcommand{\norm}[1]{\| #1 \|}\)
\( \newcommand{\inner}[2]{\langle #1, #2 \rangle}\)
\( \newcommand{\Span}{\mathrm{span}}\) \( \newcommand{\AA}{\unicode[.8,0]{x212B}}\)
\( \newcommand{\vectorA}[1]{\vec{#1}} % arrow\)
\( \newcommand{\vectorAt}[1]{\vec{\text{#1}}} % arrow\)
\( \newcommand{\vectorB}[1]{\overset { \scriptstyle \rightharpoonup} {\mathbf{#1}} } \)
\( \newcommand{\vectorC}[1]{\textbf{#1}} \)
\( \newcommand{\vectorD}[1]{\overrightarrow{#1}} \)
\( \newcommand{\vectorDt}[1]{\overrightarrow{\text{#1}}} \)
\( \newcommand{\vectE}[1]{\overset{-\!-\!\rightharpoonup}{\vphantom{a}\smash{\mathbf {#1}}}} \)
\( \newcommand{\vecs}[1]{\overset { \scriptstyle \rightharpoonup} {\mathbf{#1}} } \)
\( \newcommand{\vecd}[1]{\overset{-\!-\!\rightharpoonup}{\vphantom{a}\smash {#1}}} \)
\(\newcommand{\avec}{\mathbf a}\) \(\newcommand{\bvec}{\mathbf b}\) \(\newcommand{\cvec}{\mathbf c}\) \(\newcommand{\dvec}{\mathbf d}\) \(\newcommand{\dtil}{\widetilde{\mathbf d}}\) \(\newcommand{\evec}{\mathbf e}\) \(\newcommand{\fvec}{\mathbf f}\) \(\newcommand{\nvec}{\mathbf n}\) \(\newcommand{\pvec}{\mathbf p}\) \(\newcommand{\qvec}{\mathbf q}\) \(\newcommand{\svec}{\mathbf s}\) \(\newcommand{\tvec}{\mathbf t}\) \(\newcommand{\uvec}{\mathbf u}\) \(\newcommand{\vvec}{\mathbf v}\) \(\newcommand{\wvec}{\mathbf w}\) \(\newcommand{\xvec}{\mathbf x}\) \(\newcommand{\yvec}{\mathbf y}\) \(\newcommand{\zvec}{\mathbf z}\) \(\newcommand{\rvec}{\mathbf r}\) \(\newcommand{\mvec}{\mathbf m}\) \(\newcommand{\zerovec}{\mathbf 0}\) \(\newcommand{\onevec}{\mathbf 1}\) \(\newcommand{\real}{\mathbb R}\) \(\newcommand{\twovec}[2]{\left[\begin{array}{r}#1 \\ #2 \end{array}\right]}\) \(\newcommand{\ctwovec}[2]{\left[\begin{array}{c}#1 \\ #2 \end{array}\right]}\) \(\newcommand{\threevec}[3]{\left[\begin{array}{r}#1 \\ #2 \\ #3 \end{array}\right]}\) \(\newcommand{\cthreevec}[3]{\left[\begin{array}{c}#1 \\ #2 \\ #3 \end{array}\right]}\) \(\newcommand{\fourvec}[4]{\left[\begin{array}{r}#1 \\ #2 \\ #3 \\ #4 \end{array}\right]}\) \(\newcommand{\cfourvec}[4]{\left[\begin{array}{c}#1 \\ #2 \\ #3 \\ #4 \end{array}\right]}\) \(\newcommand{\fivevec}[5]{\left[\begin{array}{r}#1 \\ #2 \\ #3 \\ #4 \\ #5 \\ \end{array}\right]}\) \(\newcommand{\cfivevec}[5]{\left[\begin{array}{c}#1 \\ #2 \\ #3 \\ #4 \\ #5 \\ \end{array}\right]}\) \(\newcommand{\mattwo}[4]{\left[\begin{array}{rr}#1 \amp #2 \\ #3 \amp #4 \\ \end{array}\right]}\) \(\newcommand{\laspan}[1]{\text{Span}\{#1\}}\) \(\newcommand{\bcal}{\cal B}\) \(\newcommand{\ccal}{\cal C}\) \(\newcommand{\scal}{\cal S}\) \(\newcommand{\wcal}{\cal W}\) \(\newcommand{\ecal}{\cal E}\) \(\newcommand{\coords}[2]{\left\{#1\right\}_{#2}}\) \(\newcommand{\gray}[1]{\color{gray}{#1}}\) \(\newcommand{\lgray}[1]{\color{lightgray}{#1}}\) \(\newcommand{\rank}{\operatorname{rank}}\) \(\newcommand{\row}{\text{Row}}\) \(\newcommand{\col}{\text{Col}}\) \(\renewcommand{\row}{\text{Row}}\) \(\newcommand{\nul}{\text{Nul}}\) \(\newcommand{\var}{\text{Var}}\) \(\newcommand{\corr}{\text{corr}}\) \(\newcommand{\len}[1]{\left|#1\right|}\) \(\newcommand{\bbar}{\overline{\bvec}}\) \(\newcommand{\bhat}{\widehat{\bvec}}\) \(\newcommand{\bperp}{\bvec^\perp}\) \(\newcommand{\xhat}{\widehat{\xvec}}\) \(\newcommand{\vhat}{\widehat{\vvec}}\) \(\newcommand{\uhat}{\widehat{\uvec}}\) \(\newcommand{\what}{\widehat{\wvec}}\) \(\newcommand{\Sighat}{\widehat{\Sigma}}\) \(\newcommand{\lt}{<}\) \(\newcommand{\gt}{>}\) \(\newcommand{\amp}{&}\) \(\definecolor{fillinmathshade}{gray}{0.9}\)The method for determining a reaction rate is relatively straightforward. Since a reaction rate is based on change over time, it must be determined from tabulated values or found experimentally. With the obtained data, it is possible to calculate the reaction rate either algebraically or graphically. What follows is general guidance and examples of measuring the rates of a reaction. Measuring time change is easy; a stopwatch or any other time device is sufficient. However, determining the change in concentration of the reactants or products involves more complicated processes. The change of concentration in a system can generally be acquired in two ways:
- By monitoring the depletion of reactant over time, or
- By monitoring the formation of product over time
It does not matter whether an experimenter monitors the reagents or products because there is no effect on the overall reaction. However, since reagents decrease during reaction, and products increase, there is a sign difference between the two rates. Reagent concentration decreases as the reaction proceeds, giving a negative number for the change in concentration. The products, on the other hand, increase concentration with time, giving a positive number. Since the convention is to express the rate of reaction as a positive number, to solve a problem, set the overall rate of the reaction equal to the negative of a reagent's disappearing rate. The overall rate also depends on stoichiometric coefficients.
It is worth noting that the process of measuring the concentration can be greatly simplified by taking advantage of the different physical or chemical properties (ie: phase difference, reduction potential, etc.) of the reagents or products involved in the reaction by using the above methods. We have emphasized the importance of taking the sign of the reaction into account to get a positive reaction rate. Now, we will turn our attention to the importance of stoichiometric coefficients.
A reaction rate can be reported quite differently depending on which product or reagent selected to be monitored.
Given a reaction:
\[ aA+bB \rightarrow cC + dD \]
the general rate for this reaction is defined as
\[rate = - \dfrac{1}{a}\dfrac{ \Delta [A]}{ \Delta t} = - \dfrac{1}{b} \dfrac{\Delta [B]}{\Delta t} = \dfrac{1}{c}\dfrac{ \Delta [C]}{\Delta t} = \dfrac{1}{d}\dfrac{ \Delta [D]}{\Delta t} \label{rate1}\]
Equation \(\ref{rate1}\) can also be written as:
rate of reaction = \( - \dfrac{1}{a} \) (rate of disappearance of A)
= \( - \dfrac{1}{b} \) (rate of disappearance of B)
= \( \dfrac{1}{c} \) (rate of formation of C)
= \( \dfrac{1}{d} \) (rate of formation of D)
Even though the concentrations of A, B, C and D may all change at different rates, there is only one average rate of reaction. To get this unique rate, choose any one rate and divide it by the stoichiometric coefficient. When the reaction has the formula:
\[ C_{R1}R_1 + \dots + C_{Rn}R_n \rightarrow C_{P1}P_1 + \dots + C_{Pn}P_n \]
The general case of the unique average rate of reaction has the form:
rate of reaction = \( - \dfrac{1}{C_{R1}}\dfrac{\Delta [R_1]}{\Delta t} = \dots = - \dfrac{1}{C_{Rn}}\dfrac{\Delta [R_n]}{\Delta t} = \dfrac{1}{C_{P1}}\dfrac{\Delta [P_1]}{\Delta t} = \dots = \dfrac{1}{C_{Pn}}\dfrac{\Delta [P_n]}{\Delta t} \)
Average Reaction Rates: https://youtu.be/jc6jntB7GHk
Following the Course of a Reaction
Rather than performing a whole set of initial rate experiments, one can gather information about orders of reaction by following a particular reaction from start to finish. There are two different ways this can be accomplished.
- Samples of the mixture can be collected at intervals and titrated to determine how the concentration of one of the reagents is changing.
- A physical property of the reaction which changes as the reaction continues can be measured: for example, the volume of gas produced.
These approaches must be considered separately.
Consider that bromoethane reacts with sodium hydroxide solution as follows:
\[ CH_3CH_2Br + OH^- \rightarrow CH_3CH_2OH + Br^-\]
During the course of the reaction, both bromoethane and sodium hydroxide are consumed. However, it is relatively easy to measure the concentration of sodium hydroxide at any one time by performing a titration with a standard acid: for example, with hydrochloric acid of a known concentration.
The process starts with known concentrations of sodium hydroxide and bromoethane, and it is often convenient for them to be equal. Because the reaction is 1:1, if the concentrations are equal at the start, they remain equal throughout the reaction. Samples are taken with a pipette at regular intervals during the reaction, and titrated with standard hydrochloric acid in the presence of a suitable indicator. The problem with this approach is that the reaction is still proceeding in the time required for the titration. In addition, only one titration attempt is possible, because by the time another sample is taken, the concentrations have changed.
There are two ways around this problem:
- The reaction can be slowed by diluting it, adding the sample to a larger volume of cold water before the titration. Then the titration is performed as quickly as possible. This is most effective if the reaction is carried out above room temperature. Cooling it as well as diluting it slows it down even more.
- If possible (and it is possible in this case) it is better to stop the reaction completely before titrating. In this case, this can be accomplished by adding the sample to a known, excess volume of standard hydrochloric acid. This consumes all the sodium hydroxide in the mixture, stopping the reaction.
At this point the resulting solution is titrated with standard sodium hydroxide solution to determine how much hydrochloric acid is left over in the mixture. This allows one to calculate how much acid was used, and thus how much sodium hydroxide must have been present in the original reaction mixture. This technique is known as a back titration.
This process generates a set of values for concentration of (in this example) sodium hydroxide over time. The concentrations of bromoethane are, of course, the same as those obtained if the same concentrations of each reagent were used. These values are plotted to give a concentration-time graph, such as that below:
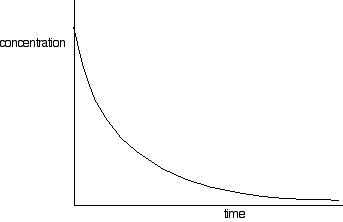
The rates of reaction at a number of points on the graph must be calculated; this is done by drawing tangents to the graph and measuring their slopes.
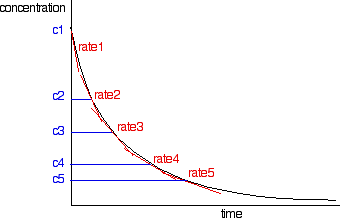
These values are then tabulated. The quickest way to proceed from here is to plot a log graph as described further up the page. All rates are converted to log(rate), and all the concentrations to log(concentration). Then, log(rate) is plotted against log(concentration). The slope of the graph is equal to the order of reaction.
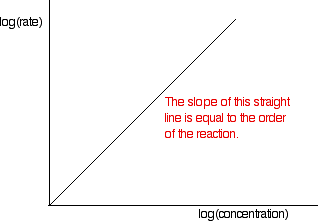
In the example of the reaction between bromoethane and sodium hydroxide solution, the order is calculated to be 2. Notice that this is the overall order of the reaction, not just the order with respect to the reagent whose concentration was measured. The rate of reaction decreases because the concentrations of both of the reactants decrease.
A familiar example is the catalytic decomposition of hydrogen peroxide (used above as an example of an initial rate experiment).
![]()
![]()
This time, measure the oxygen given off using a gas syringe, recording the volume of oxygen collected at regular intervals.
The practical side of this experiment is straightforward, but the calculation is not. The problem is that the volume of the product is measured, whereas the concentration of the reactants is used to find the reaction order. This means that the concentration of hydrogen peroxide remaining in the solution must be determined for each volume of oxygen recorded. This requires ideal gas law and stoichiometric calculations.
The table of concentrations and times is processed as described above.
This is an example of measuring the initial rate of a reaction producing a gas.
![]()

A simple set-up for this process is given below:
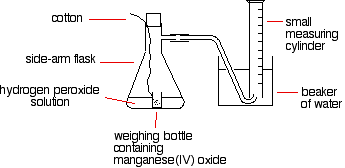
The reason for the weighing bottle containing the catalyst is to avoid introducing errors at the beginning of the experiment. The catalyst must be added to the hydrogen peroxide solution without changing the volume of gas collected. If it is added to the flask using a spatula before replacing the bung, some gas might leak out before the bung is replaced. Alternatively, air might be forced into the measuring cylinder. Either would render results meaningless.
To start the reaction, the flask is shaken until the weighing bottle falls over, and then shaken further to make sure the catalyst mixes evenly with the solution. Alternatively, a special flask with a divided bottom could be used, with the catalyst in one side and the hydrogen peroxide solution in the other. The two are easily mixed by tipping the flask. Using a 10 cm3 measuring cylinder, initially full of water, the time taken to collect a small fixed volume of gas can be accurately recorded. A small gas syringe could also be used.
To study the effect of the concentration of hydrogen peroxide on the rate, the concentration of hydrogen peroxide must be changed and everything else held constant—the temperature, the total volume of the solution, and the mass of manganese(IV) oxide. The manganese(IV) oxide must also always come from the same bottle so that its state of division is always the same.
The same apparatus can be used to determine the effects of varying the temperature, catalyst mass, or state of division due to the catalyst
Mixing dilute hydrochloric acid with sodium thiosulphate solution causes the slow formation of a pale yellow precipitate of sulfur.
\[ Na_2S_2O_{2(aq)} + 2HCl_{(aq)} \rightarrow 2NaCl_{(aq)} + H_2O_{(l)} + S_{(s)} + SO_{2(g)}\]
A very simple, but very effective, way of measuring the time taken for a small fixed amount of precipitate to form is to stand the flask on a piece of paper with a cross drawn on it, and then look down through the solution until the cross disappears.
A known volume of sodium thiosulphate solution is placed in a flask. Then a small known volume of dilute hydrochloric acid is added, a timer is started, the flask is swirled to mix the reagents, and the flask is placed on the paper with the cross. The timer is used to determine the time for the cross to disappear. The process is repeated using a smaller volume of sodium thiosulphate, but topped up to the same original volume with water. Everything else is exactly as before.
The actual concentration of the sodium thiosulphate does not need to be known. In each case the relative concentration could be recorded. The solution with 40 cm3 of sodium thiosulphate solution plus 10 cm3 of water has a concentration which is 80% of the original, for example. The one with 10 cm3 of sodium thiosulphate solution plus 40 cm3 of water has a concentration 20% of the original.
The quantity 1/t can again be plotted as a measure of the rate, and the volume of sodium thiosulphate solution as a measure of concentration. Alternatively, relative concentrations could be plotted. In either case, the shape of the graph is the same.
The effect of temperature on this reaction can be measured by warming the sodium thiosulphate solution before adding the acid. The temperature must be measured after adding the acid, because the cold acid cools the solution slightly.This time, the temperature is changed between experiments, keeping everything else constant. To get reasonable times, a diluted version of the sodium thiosulphate solution must be used. Using the full strength, hot solution produces enough precipitate to hide the cross almost instantly.
There are several reactions bearing the name "iodine clock." Each produces iodine as one of the products. This is the simplest of them, because it involves the most familiar reagents.
The reaction below is the oxidation of iodide ions by hydrogen peroxide under acidic conditions:
\[ H_2O_{2(aq)} + 2I_{(aq)}^- + 2H^+ \rightarrow I_{2(aq)} + 2H_2O_{(l)}\]
The iodine is formed first as a pale yellow solution, darkening to orange and then dark red before dark gray solid iodine is precipitated.
Iodine reacts with starch solution to give a deep blue solution. If starch solution is added to the reaction above, as soon as the first trace of iodine is formed, the solution turns blue. This gives no useful information. However, iodine also reacts with sodium thiosulphate solution:
\[ 2S_2O^{2-}_{3(aq)} + I_{2(aq)} \rightarrow S_2O_{6(aq)}^{2-} + 2I^-_{(aq)}\]
If a very small amount of sodium thiosulphate solution is added to the reaction mixture (including the starch solution), it reacts with the iodine that is initially produced, so the iodine does not affect the starch, and there is no blue color. However, when that small amount of sodium thiosulphate is consumed, nothing inhibits further iodine produced from reacting with the starch. The mixture turns blue.
Average vs. Instantaneous Reaction Rates
Reaction rates have the general form of (change of concentration / change of time). There are two types of reaction rates. One is called the average rate of reaction, often denoted by (Δ[conc.] / Δt), while the other is referred to as the instantaneous rate of reaction, denoted as either:
\[ \lim_{\Delta t \rightarrow 0} \dfrac{\Delta [concentration]}{\Delta t} \]
or
\[ \dfrac{d [concentration]}{dt} \]
The average rate of reaction, as the name suggests, is an average rate, obtained by taking the change in concentration over a time period, for example: -0.3 M / 15 minutes. This is an approximation of the reaction rate in the interval; it does not necessarily mean that the reaction has this specific rate throughout the time interval or even at any instant during that time. The instantaneous rate of reaction, on the other hand, depicts a more accurate value. The instantaneous rate of reaction is defined as the change in concentration of an infinitely small time interval, expressed as the limit or derivative expression above. Instantaneous rate can be obtained from the experimental data by first graphing the concentration of a system as function of time, and then finding the slope of the tangent line at a specific point which corresponds to a time of interest. Alternatively, experimenters can measure the change in concentration over a very small time period two or more times to get an average rate close to that of the instantaneous rate. The reaction rate for that time is determined from the slope of the tangent lines.
Initial Rate of Reaction
The initial rate of reaction is the rate at which the reagents are first brought together. Like the instantaneous rate mentioned above, the initial rate can be obtained either experimentally or graphically. To experimentally determine the initial rate, an experimenter must bring the reagents together and measure the reaction rate as quickly as possible. If this is not possible, the experimenter can find the initial rate graphically. To do this, he must simply find the slope of the line tangent to the reaction curve when t=0.
The simplest initial rate experiments involve measuring the time taken for some recognizable event to happen early in a reaction. This could be the time required for 5 cm3 of gas to be produced, for a small, measurable amount of precipitate to form, or for a dramatic color change to occur. Examples of these three indicators are discussed below.
The concentration of one of the components of the reaction could be changed, holding everything else constant: the concentrations of other reactants, the total volume of the solution and the temperature. The time required for the event to occur is then measured. This process is repeated for a range of concentrations of the substance of interest. A reasonably wide range of concentrations must be measured.This process could be repeated by altering a different property.
Consider a simple example of an initial rate experiment in which a gas is produced. This might be a reaction between a metal and an acid, for example, or the catalytic decomposition of hydrogen peroxide. If volume of gas evolved is plotted against time, the first graph below results.
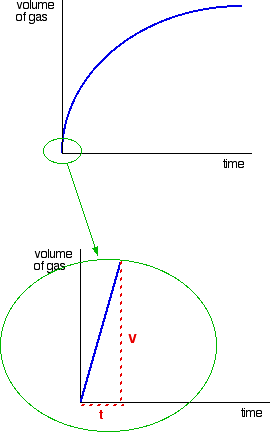
A measure of the rate of the reaction at any point is found by measuring the slope of the graph. The steeper the slope, the faster the rate. Because the initial rate is important, the slope at the beginning is used. In the second graph, an enlarged image of the very beginning of the first curve, the curve is approximately straight. This is only a reasonable approximation when considering an early stage in the reaction. As the reaction progresses, the curvature of the graph increases. Suppose the experiment is repeated with a different (lower) concentration of the reagent. Again, the time it takes for the same volume of gas to evolve is measured, and the initial stage of the reaction is studied.
Instantaneous Rates: https://youtu.be/GGOdoIzxvAo
Determine the initial rate of the reaction using the table below.
| Time | [A] |
|---|---|
| 100 | 1.55 |
| 200 | 0.99 |
| 300 | 0.67 |
| 400 | 0.45 |
| 500 | 0.34 |
| 600 | 0.24 |
Solution
initial rate of reaction = \( \dfrac{-(0-2.5) M}{(195-0) sec} \) = 0.0125 M per sec
Use the points [A]=2.43 M, t= 0 and [A]=1.55, t=100
initial rate of reaction = \( - \dfrac{\Delta [A]}{\Delta t} = \dfrac{-(1.55-2.43) M }{\ (100-0) sec} \) = 0.0088 M per sec
References
- Petrucci et al. General Chemistry: Principles & Modern Applications, 9th Edition. New Jersey: Prentice-Hall Inc., 2007.
- Atkins et al. Chemical Principles: the Quest for Insight, 3rd Edition. NewYork: W.H. Freeman and Company, 2005.
- Denisov et al. Chemical Kinetics: Fundamentals and New Developments. Amsterdam, The Netherlands: Elsevier science B.V., 2003
Contributors and Attributions
- Jessica Lin, Brenda Mai, Elizabeth Sproat, Nyssa Spector, Joslyn Wood
Jim Clark (Chemguide.co.uk)

