3.11.4: Foods- Low Glycemic Index Foods and Blood Glucose Concentration
- Page ID
- 50747
\( \newcommand{\vecs}[1]{\overset { \scriptstyle \rightharpoonup} {\mathbf{#1}} } \)
\( \newcommand{\vecd}[1]{\overset{-\!-\!\rightharpoonup}{\vphantom{a}\smash {#1}}} \)
\( \newcommand{\id}{\mathrm{id}}\) \( \newcommand{\Span}{\mathrm{span}}\)
( \newcommand{\kernel}{\mathrm{null}\,}\) \( \newcommand{\range}{\mathrm{range}\,}\)
\( \newcommand{\RealPart}{\mathrm{Re}}\) \( \newcommand{\ImaginaryPart}{\mathrm{Im}}\)
\( \newcommand{\Argument}{\mathrm{Arg}}\) \( \newcommand{\norm}[1]{\| #1 \|}\)
\( \newcommand{\inner}[2]{\langle #1, #2 \rangle}\)
\( \newcommand{\Span}{\mathrm{span}}\)
\( \newcommand{\id}{\mathrm{id}}\)
\( \newcommand{\Span}{\mathrm{span}}\)
\( \newcommand{\kernel}{\mathrm{null}\,}\)
\( \newcommand{\range}{\mathrm{range}\,}\)
\( \newcommand{\RealPart}{\mathrm{Re}}\)
\( \newcommand{\ImaginaryPart}{\mathrm{Im}}\)
\( \newcommand{\Argument}{\mathrm{Arg}}\)
\( \newcommand{\norm}[1]{\| #1 \|}\)
\( \newcommand{\inner}[2]{\langle #1, #2 \rangle}\)
\( \newcommand{\Span}{\mathrm{span}}\) \( \newcommand{\AA}{\unicode[.8,0]{x212B}}\)
\( \newcommand{\vectorA}[1]{\vec{#1}} % arrow\)
\( \newcommand{\vectorAt}[1]{\vec{\text{#1}}} % arrow\)
\( \newcommand{\vectorB}[1]{\overset { \scriptstyle \rightharpoonup} {\mathbf{#1}} } \)
\( \newcommand{\vectorC}[1]{\textbf{#1}} \)
\( \newcommand{\vectorD}[1]{\overrightarrow{#1}} \)
\( \newcommand{\vectorDt}[1]{\overrightarrow{\text{#1}}} \)
\( \newcommand{\vectE}[1]{\overset{-\!-\!\rightharpoonup}{\vphantom{a}\smash{\mathbf {#1}}}} \)
\( \newcommand{\vecs}[1]{\overset { \scriptstyle \rightharpoonup} {\mathbf{#1}} } \)
\( \newcommand{\vecd}[1]{\overset{-\!-\!\rightharpoonup}{\vphantom{a}\smash {#1}}} \)
\(\newcommand{\avec}{\mathbf a}\) \(\newcommand{\bvec}{\mathbf b}\) \(\newcommand{\cvec}{\mathbf c}\) \(\newcommand{\dvec}{\mathbf d}\) \(\newcommand{\dtil}{\widetilde{\mathbf d}}\) \(\newcommand{\evec}{\mathbf e}\) \(\newcommand{\fvec}{\mathbf f}\) \(\newcommand{\nvec}{\mathbf n}\) \(\newcommand{\pvec}{\mathbf p}\) \(\newcommand{\qvec}{\mathbf q}\) \(\newcommand{\svec}{\mathbf s}\) \(\newcommand{\tvec}{\mathbf t}\) \(\newcommand{\uvec}{\mathbf u}\) \(\newcommand{\vvec}{\mathbf v}\) \(\newcommand{\wvec}{\mathbf w}\) \(\newcommand{\xvec}{\mathbf x}\) \(\newcommand{\yvec}{\mathbf y}\) \(\newcommand{\zvec}{\mathbf z}\) \(\newcommand{\rvec}{\mathbf r}\) \(\newcommand{\mvec}{\mathbf m}\) \(\newcommand{\zerovec}{\mathbf 0}\) \(\newcommand{\onevec}{\mathbf 1}\) \(\newcommand{\real}{\mathbb R}\) \(\newcommand{\twovec}[2]{\left[\begin{array}{r}#1 \\ #2 \end{array}\right]}\) \(\newcommand{\ctwovec}[2]{\left[\begin{array}{c}#1 \\ #2 \end{array}\right]}\) \(\newcommand{\threevec}[3]{\left[\begin{array}{r}#1 \\ #2 \\ #3 \end{array}\right]}\) \(\newcommand{\cthreevec}[3]{\left[\begin{array}{c}#1 \\ #2 \\ #3 \end{array}\right]}\) \(\newcommand{\fourvec}[4]{\left[\begin{array}{r}#1 \\ #2 \\ #3 \\ #4 \end{array}\right]}\) \(\newcommand{\cfourvec}[4]{\left[\begin{array}{c}#1 \\ #2 \\ #3 \\ #4 \end{array}\right]}\) \(\newcommand{\fivevec}[5]{\left[\begin{array}{r}#1 \\ #2 \\ #3 \\ #4 \\ #5 \\ \end{array}\right]}\) \(\newcommand{\cfivevec}[5]{\left[\begin{array}{c}#1 \\ #2 \\ #3 \\ #4 \\ #5 \\ \end{array}\right]}\) \(\newcommand{\mattwo}[4]{\left[\begin{array}{rr}#1 \amp #2 \\ #3 \amp #4 \\ \end{array}\right]}\) \(\newcommand{\laspan}[1]{\text{Span}\{#1\}}\) \(\newcommand{\bcal}{\cal B}\) \(\newcommand{\ccal}{\cal C}\) \(\newcommand{\scal}{\cal S}\) \(\newcommand{\wcal}{\cal W}\) \(\newcommand{\ecal}{\cal E}\) \(\newcommand{\coords}[2]{\left\{#1\right\}_{#2}}\) \(\newcommand{\gray}[1]{\color{gray}{#1}}\) \(\newcommand{\lgray}[1]{\color{lightgray}{#1}}\) \(\newcommand{\rank}{\operatorname{rank}}\) \(\newcommand{\row}{\text{Row}}\) \(\newcommand{\col}{\text{Col}}\) \(\renewcommand{\row}{\text{Row}}\) \(\newcommand{\nul}{\text{Nul}}\) \(\newcommand{\var}{\text{Var}}\) \(\newcommand{\corr}{\text{corr}}\) \(\newcommand{\len}[1]{\left|#1\right|}\) \(\newcommand{\bbar}{\overline{\bvec}}\) \(\newcommand{\bhat}{\widehat{\bvec}}\) \(\newcommand{\bperp}{\bvec^\perp}\) \(\newcommand{\xhat}{\widehat{\xvec}}\) \(\newcommand{\vhat}{\widehat{\vvec}}\) \(\newcommand{\uhat}{\widehat{\uvec}}\) \(\newcommand{\what}{\widehat{\wvec}}\) \(\newcommand{\Sighat}{\widehat{\Sigma}}\) \(\newcommand{\lt}{<}\) \(\newcommand{\gt}{>}\) \(\newcommand{\amp}{&}\) \(\definecolor{fillinmathshade}{gray}{0.9}\)Recent reports about increased risk for diabetes resulting from diets high in sugars and carbohydrates have led to suggestions for healthier diets, including the low glycemic index diet. The glycemic index (GI) is a measure of the rate at which foods increase blood glucose concentrations.[1] Foods which increase the blood glucose concentration rapidly seem to increase the risk of diabetes more than other foods which may have high sugar, but lead to moderated increases in blood glucose concentration. The glycemic load (GL) is an estimate of the probable impact of standard servings of food in typical meals on glucose concentrations.
| Food | GI | Portion Size (g) |
GL | Food | GI | Portion Size (g) |
GL |
|---|---|---|---|---|---|---|---|
| Cornflakes | 81 | 30 | 21 | Honey | 55 | 25 | 10 |
| Potato, mashed | 77 | 150 | 15 | Potato chips | 54 | 50 | 11 |
| Wholemeal bread | 71 | 30 | 9 | Banana | 52 | 120 | 12 |
| White bread | 70 | 30 | 10 | Orange Juice | 50 | 250 | 13 |
| Sucrose | 68 | 10 | 7 | Green peas | 48 | 80 | 3 |
| Rice, white | 64 | 150 | 23 | Canned baked beans | 48 | 150 | 7 |
| Rye crispbread | 64 | 25 | 11 | Spaghetti | 44 | 180 | 21 |
| Ice Cream | 61 | 50 | 8 | Milk chocolate | 43 | 50 | 12 |
| Cola | 58 | 250 [2] | 15 | Apples, raw | 38 | 120 | 6 |
| Oatmeal Porridge | 58 | 250 | 13 | Chickpeas | 28 | 150 | 8 |
| Potatoes, boiled new | 57 | 150 | 12 | Lentils, red | 26 | 150 | 5 |
| Rice, brown | 55 | 150 | 18 | Peanuts, raw | 14 | 50 | 1 |
The surprises in this table may be honey, sucrose, chocolate, and ice cream. Fats (in honey and ice cream) may slow the uptake of sugar in the intestine, while fructose (in honey, hydrolyzed sucrose, and high fructose corn syrup) has a low impact on blood glucose. There are many sources of glycemic index values.
Measuring the Glycemic Index
The glycemic index is determined by plotting blood glucose concentrations vs. time for two hours after ingesting 50 g of glucose or another food, and comparing the graphs[3] which are typically like the one below:[4]
Glucose Concentration
Note that the blood glucose concentration rises much faster when glucose is ingested (with a GI = 100) than when white bread is ingested (GI = 70). The glucose concentration is measured in mM, the abbreviation for "milliMolar". The molar (M) concentration of a solution is a measure of how much solute (the component of a solution present in lesser amount, often a solid) there is in a given volume of solution.
\(\text{Concentration of solute in molar units}=\frac{\text{amount of solute, mol}}{\text{volume of solution, L}}\)
\(c_{\text{M}}~=~\frac{n_{\text{solute, mol}}}{V_{\text{solution,L}}}\text{ (1)}\) or equivalently, \(c_{\text{M}}~=~\frac{n_{\text{solute, mmol}}}{V_{\text{solution,mL}}}\)
So we can define mM as
\(c_{\text{mM}}~=~\frac{n_{\text{solute, mmol}}}{V_{\text{solution,L}}}\text{ (1)}\)
The units moles per liter (mol liter–1) or moles per cubic decimeter (mol dm–3) are used to express molar concentration. They are equivalent (since 1 dm–3 = 1 liter). It's important to note that we are referring to the volume of solution, not the volume of solvent. The solvent is the component of a solution present in the largest amount, and is often a liquid. The solution will generally have a different volume than the solvent from which it was made. Solutes and solvents may be solids, liquids or gases (air is a solution of mostly oxygen gas in the solvent nitrogen gas; brass is a solution of solid zinc in solid copper; and gin is a solution of liquid ethanol in liquid water; etc.)
There are many other concentration units. Glucose blood concentration is sometimes given in mg/dL3 (milligrams per cubic deciliter), alcoholic beverages in percent by volume (C%V = V(solute)/V(solvent) x 100%), and physical chemists sometimes use "molal" units (where Cm = n(solute, mol)/m(solvent, kg)).
Macroscopically a solution is defined as a homogeneous mixture of two or more substances, that is, a mixture which appears to be uniform throughout. On the microscopic scale a solution involves the random arrangement of one kind of atom or molecule with respect to another. Blood is heterogeneous, because it contains red blood cells which can be separated by centrifugation, leaving the plasma, so blood is not a solution. The plasma, however, is a solution which contains the solute glucose among many other substances. We often use "plasma glucose concentration" and "blood glucose concentration" interchangeably, although the latter is not precisely correct. Solutions are common in the body, because atoms or molecules of solids dissolved in a liquid are close together but still able to move past one another. They contact each other more frequently than if two solids were placed next to each other. This “intimacy” in liquid solutions often facilitates chemical reactions.
Preparing Solutions
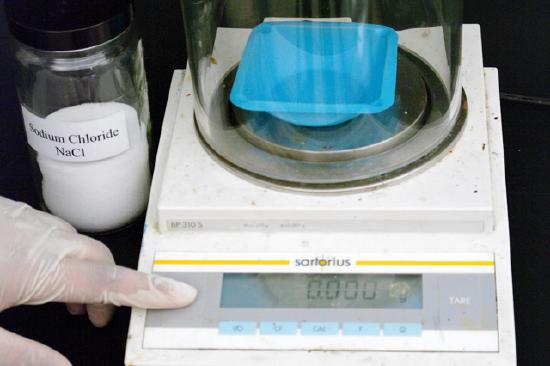
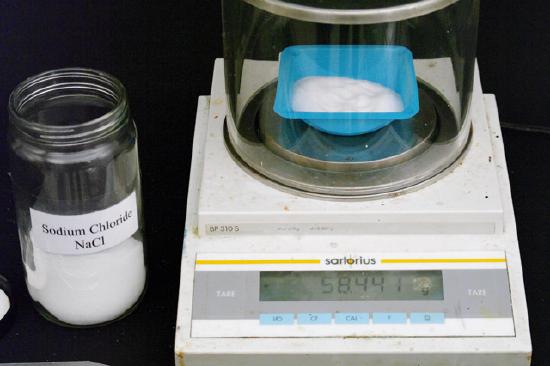
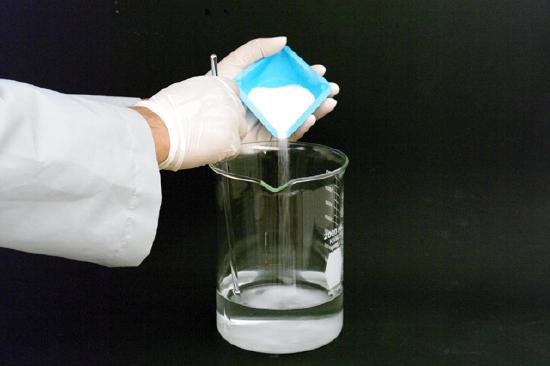
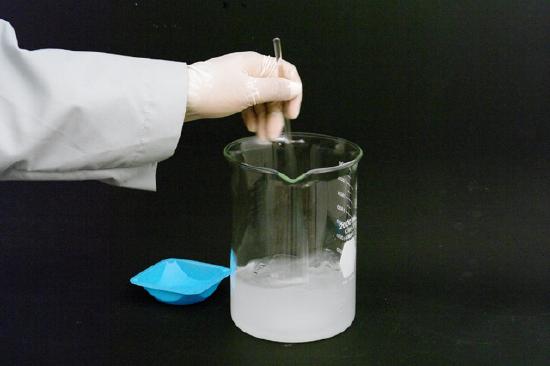
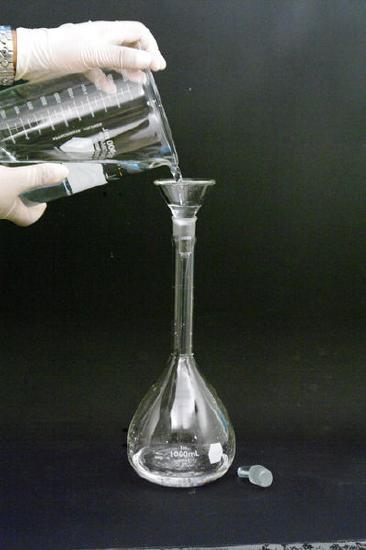
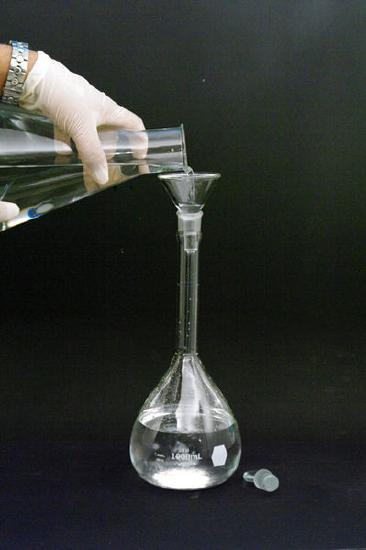
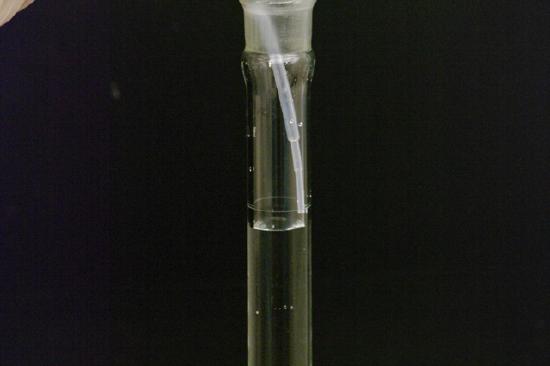
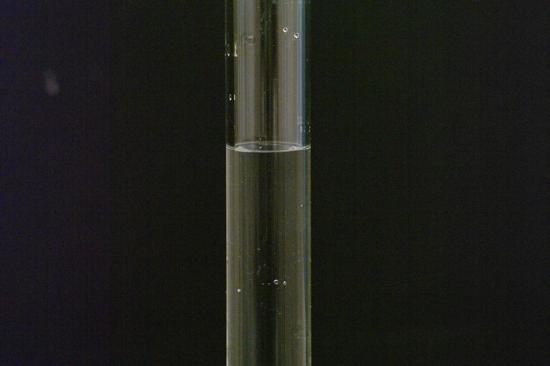
Blood glucose concentration measurements are usually made with an instrument ("glucometer") that needs to be calibrated by measuring solutions of known concentrations. If a pure substance like glucose is soluble in water, it is easy to prepare a solution of known concentration. A container with a sample of the substance is weighed accurately, and an appropriate mass of sample is poured through a funnel into a volumetric flask, as shown in the figure. The container is then reweighed. Any solid adhering to the funnel is rinsed into the flask, and water is added until the flask is about three-quarters full. After swirling the flask to dissolve the solid, water is added carefully until the bottom of the meniscus coincides with the calibration mark on the neck of the flash. This process is shown in detail in Figure 1:
|
The following movie shows a difficult step in this process: adding water to dilute the solution to the proper concentration. In this movie, water is added to the volumetric flask until it is 2cm from the mark. A wash bottle is then used to bring the solution level to within a few millimeters of the mark. Finally, a dropper is used to fill to the mark and ensure the calibration mark is not overshot.
EXAMPLE 1 A standard solution of glucose was prepared as described above. The initial mass of the container plus glucose was 43.2874 g, and the final mass after pouring was 42.9724 g. The volume of the flask was 250.00 ml. What is the concentration of the solution?
Solution
The concentration can be calculated by dividing the amount of solute by the volume of solution [Eq. (1)]:
-
- \(c_{\text{glucose}}=\frac{n_{\text{glucose, mol}}}{V_{\text{solution, L}}}\)
We obtain nglucose from the mass of glucose added to the flask: mKI = 43.2874 - 42.9724 g = 0.3150 g nKI = 0.3150 g × \(\frac{\text{1 mol}}{\text{180}\text{.157 g}}\) = 1.748 × 10⁻³ mol The volume of solution is 250.00 ml, or Vsolution = 250.00 cm3 × \(\frac{\text{1 dm}^{\text{3}}}{\text{10}^{\text{3}}\text{ cm}^{\text{3}}}\) = 2.5000 × 10⁻¹ dm3 Thus
\(c_{\text{glucose}}=\frac{n_{\text{glucose}}}{V_{\text{solution}}}=\frac{\text{1}\text{.748}\times \text{10}^{\text{-3}}\text{ mol }}{\text{2}\text{.500 }\times \text{10}^{\text{-1}}\text{ dm}^{\text{3}}}=\text{6}\text{.994 }\times 10^{^{\text{-3}}}\text{mol dm}^{\text{-3}}\)
This could be expressed in millimolar:
\(\text{6}\text{.994 }\times 10^{^{\text{-3}}}\text{mol dm}^{\text{-3}}~\times~\frac{\text{1 mM}}{10^{-3}\text{M}}~=~\text{6.99 mM}\)
Note that the definition of concentration is entirely analogous to the definitions of density, molar mass, and stoichiometric ratio that we have previously encountered. Concentration will serve as a conversion factor relating the volume of solution to the amount of dissolved solute.
\(\text{Volume of solution}~~\overset{concentration}{\longleftrightarrow}\text{amount of solute}\)
\(V~~\overset{c}{\longleftrightarrow}~~n\)
Since solutions offer a convenient medium for carrying out chemical reactions, it is often necessary to know how much of one solution will react with a given quantity of another. Examples in other sections have shown that the amount of substance is the quantity which determines how much of one material will react with another. The ease with which solution volumes may be measured suggests that it would be very convenient to know the amount of substance dissolved per unit volume of solution. Then by measuring a certain volume of solution, we would also be measuring a certain amount of substance. Because the volume of a liquid can be measured quickly and easily, concentration is a much- used quantity. The next two examples show how this conversion factor may be applied to commonly encountered solutions in which water is the solvent (aqueous solutions).
Glucose in Corn Syrup
Karo® Lite corn syrup is an aqueous (water) solution of nearly 100% glucose [represented or written glucose(aq)] whose concentration we'll explore below. It is made by hydrolyzing cornstarch, but it contains no "high fructose corn syrup", which is corn syrup that has been enzymatically converted from 100% glucose to about 55% fructose and 45% glucose to increase its sweetness.
EXAMPLE 2
A sample of Karo syrup has a glucose(aq)] concentration of 1.30 mol dm–3.
a. If 24.71 cm3 (24.71 ml) of this solution is delivered from a buret to prepare a sample for a GI test, what amount of glucose has been delivered?
b. What is the mass of glucose in the sample, and the glucose concentration of Karo syrup in g/mL?
Solution
a. Using concentration as a conversion factor, we have
-
- \(V\text{ }\xrightarrow{c}\text{ }n\)
\(n_{\text{glucose}}=\text{24}\text{.71 cm}^{\text{3}}\times \frac{\text{1}\text{.30 mol}}{\text{1 dm}^{\text{3}}}\) The volume units will cancel if we supply a unity factor to convert cubic centimeters to cubic decimeters: \(n_{\text{glucose}}=\text{24}\text{.71 cm}^{\text{3}}\times \frac{\text{1}\text{.30 mol}}{\text{1 dm}^{\text{3}}}\times \left( \frac{\text{1 dm}}{\text{10 cm}} \right)^{\text{3}}\)
\(=\text{24}\text{.71 cm}^{\text{3}}\times \frac{\text{1}\text{.30 mol}}{\text{1 dm}^{\text{3}}}\times \frac{\text{1 dm}^{\text{3}}}{\text{10}^{\text{3}}\text{ cm}^{\text{3}}}\)
= 0.0321 mol
b. mglucose, g = nglucose, mol x Mglucose, g/mol = 0.0321 mol x 180.157 g/mol = 5.78 g
Thus Karo syrup has a concentration of 5.78 g / 24.74 mL or 0.234 g/mL, consistent with the nutritional label which states that a 2 Tbsp (30 mL) serving provides 30 ml x 0.234 g/ml = 7 g of glucose.[1]
The concentration units of moles per cubic decimeter are often abbreviated M, pronounced molar. That is, a 0.1-M (one-tenth molar) solution contains 0.1 mol solute per cubic decimeter of solution. This abbreviation is very convenient for labeling laboratory bottles and for writing textbook problems; however, when doing calculations, it is difficult to see that 1 dm3 × 1 M = 1 mol Therefore we recommend that you always write the units in full when doing any calculations involving solution concentrations. It is sometimes easier to use the unit liter, which is equivalent to cubic deciliters: \(\text{1 dm}^{\text{3}}\times \text{1 }\frac{\text{mol}}{\text{dm}^{\text{3}}}=\text{1mol}\)
\(\text{1 L}\times \text{1 }\frac{\text{mol}}{\text{L}}=\text{1mol}\) Problems such as Example 2 are easier for some persons to solve if the solution concentration is expressed in millimoles per cubic centimeter (mmol cm–3) or millimoles per ml (1 ml = 1 cm–3) instead of moles per cubic decimeter. Since the SI prefix m means 10–3, 1 mmol = 10–3 mol, and \(\text{1 M}~=~\frac{\text{1 mol}}{\text{1 dm}^{\text{3}}} ~\times~ \frac{\text{1 dm}^{\text{3}}}{\text{1 L}} ~=~\frac{\text{1 mol}}{\text{L}}\)
\(\text{1 M} ~=~\frac{\text{1 mol}}{\text{L}} ~\times~\frac{\text{10}^{\text{-3}}\text{ L}}{\text{1 ml}} ~\times~\frac{\text{1 mmol}}{\text{10}^{\text{-3}}\text{ mol}} ~=~\frac{\text{1 mmol}}{\text{1 ml}}\)
\(\text{1 M} ~=~\frac{\text{1 mol}}{\text{1 dm}^{\text{3}}} \times \frac{\text{1 dm}^{\text{3}}}{\text{10}^{\text{3}}\text{ cm}^{\text{3}}} \times \frac{\text{1 mmol}}{\text{10}^{\text{-3}}\text{ mol}} ~=~ \frac{\text{1 mmol}}{\text{1 cm}^{\text{3}}} \)
Thus a concentration of 1.30 mol dm–3 (1.30 M) can also be expressed as 1.30 mmol cm–3, 1.30 mol/L or 1.30 mmol/mL. Expressing the concentration this way is very convenient when dealing with laboratory glassware calibrated in milliliters or cubic centimeters.
Blood Concentration and Diabetes
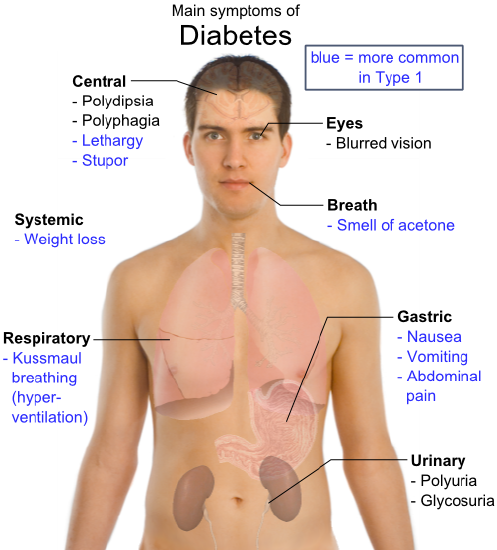
Diabetes is diagnosed when the fasting blood plasma glucose level is ≥ 7.0 mmol/L (126 mg/dL) (greater or equal to 7.0 mmol/L), or when plasma glucose ≥ 11.1 mmol/L (200 mg/dL) two hours after a 75 g oral glucose load as in a glucose tolerance test.[2]
EXAMPLE 3 Suppose the 24.71 cm3 (24.71 ml) sample of Karo syrup with a glucose(aq) concentration of 1.30 mol dm–3 in Example 2 were ingested. In Example 2 we found that it contains 0.0321 mol of glucose. What blood concentration would result in a person with the typical blood volume of 4.7L, assuming that all the glucose showed up in the blood at the time of the test, half an hour later? Is this a reasonable assumption, comparing it to the graph above where 50 g of glucose was ingested?
Solution
-
- \(c_{\text{glucose}}=\frac{n_{\text{glucose, mol}}}{V_{\text{solution, L}}}\)
\(c_{\text{glucose}}=\frac{n_{\text{glucose}}}{V_{\text{solution}}}=\frac{\text{0}\text{.0321 mol}}{\text{4}\text{.7 dm}^{\text{3}}}=\text{6}\text{.84 }\times 10^{\text{-3}}\text{mol dm}^{\text{-3}}\)
This could be expressed in millimolar:
\(\text{6}\text{.84 }\times 10^{^{\text{-3}}}\text{mol dm}^{\text{-3}}~\times~\frac{\text{1 mM}}{10^{-3}\text{M}}~=~\text{6.84 mM}\)
Here only 5.78 g sample (see Example 2) led to a calculated plasma glucose level of 6.84 mM. In the glycemic index test, a 50 g dose (nearly 10x as much) leads to a concentration of only 9 mM in a normal person, so a lot of glucose regulation is done by the body in a short time.
Note: The symbols nglucose and mglucose refer to the amount and mass of the solute glucose, respectively. They do not refer to the solution. If we wanted to specify the mass of aqueous glucose solution, the symbol mglucose(aq) could be used.
References
- ↑ http://www.karosyrup.com/products.html
- en.Wikipedia.org/wiki/Diabetes_mellitus
- en.Wikipedia.org/wiki/Diabetes_mellitus


