
pH and Food Color
- Page ID
- 50889

\( \newcommand{\vecs}[1]{\overset { \scriptstyle \rightharpoonup} {\mathbf{#1}} } \)
\( \newcommand{\vecd}[1]{\overset{-\!-\!\rightharpoonup}{\vphantom{a}\smash {#1}}} \)
\( \newcommand{\id}{\mathrm{id}}\) \( \newcommand{\Span}{\mathrm{span}}\)
( \newcommand{\kernel}{\mathrm{null}\,}\) \( \newcommand{\range}{\mathrm{range}\,}\)
\( \newcommand{\RealPart}{\mathrm{Re}}\) \( \newcommand{\ImaginaryPart}{\mathrm{Im}}\)
\( \newcommand{\Argument}{\mathrm{Arg}}\) \( \newcommand{\norm}[1]{\| #1 \|}\)
\( \newcommand{\inner}[2]{\langle #1, #2 \rangle}\)
\( \newcommand{\Span}{\mathrm{span}}\)
\( \newcommand{\id}{\mathrm{id}}\)
\( \newcommand{\Span}{\mathrm{span}}\)
\( \newcommand{\kernel}{\mathrm{null}\,}\)
\( \newcommand{\range}{\mathrm{range}\,}\)
\( \newcommand{\RealPart}{\mathrm{Re}}\)
\( \newcommand{\ImaginaryPart}{\mathrm{Im}}\)
\( \newcommand{\Argument}{\mathrm{Arg}}\)
\( \newcommand{\norm}[1]{\| #1 \|}\)
\( \newcommand{\inner}[2]{\langle #1, #2 \rangle}\)
\( \newcommand{\Span}{\mathrm{span}}\) \( \newcommand{\AA}{\unicode[.8,0]{x212B}}\)
\( \newcommand{\vectorA}[1]{\vec{#1}} % arrow\)
\( \newcommand{\vectorAt}[1]{\vec{\text{#1}}} % arrow\)
\( \newcommand{\vectorB}[1]{\overset { \scriptstyle \rightharpoonup} {\mathbf{#1}} } \)
\( \newcommand{\vectorC}[1]{\textbf{#1}} \)
\( \newcommand{\vectorD}[1]{\overrightarrow{#1}} \)
\( \newcommand{\vectorDt}[1]{\overrightarrow{\text{#1}}} \)
\( \newcommand{\vectE}[1]{\overset{-\!-\!\rightharpoonup}{\vphantom{a}\smash{\mathbf {#1}}}} \)
\( \newcommand{\vecs}[1]{\overset { \scriptstyle \rightharpoonup} {\mathbf{#1}} } \)
\( \newcommand{\vecd}[1]{\overset{-\!-\!\rightharpoonup}{\vphantom{a}\smash {#1}}} \)
\(\newcommand{\avec}{\mathbf a}\) \(\newcommand{\bvec}{\mathbf b}\) \(\newcommand{\cvec}{\mathbf c}\) \(\newcommand{\dvec}{\mathbf d}\) \(\newcommand{\dtil}{\widetilde{\mathbf d}}\) \(\newcommand{\evec}{\mathbf e}\) \(\newcommand{\fvec}{\mathbf f}\) \(\newcommand{\nvec}{\mathbf n}\) \(\newcommand{\pvec}{\mathbf p}\) \(\newcommand{\qvec}{\mathbf q}\) \(\newcommand{\svec}{\mathbf s}\) \(\newcommand{\tvec}{\mathbf t}\) \(\newcommand{\uvec}{\mathbf u}\) \(\newcommand{\vvec}{\mathbf v}\) \(\newcommand{\wvec}{\mathbf w}\) \(\newcommand{\xvec}{\mathbf x}\) \(\newcommand{\yvec}{\mathbf y}\) \(\newcommand{\zvec}{\mathbf z}\) \(\newcommand{\rvec}{\mathbf r}\) \(\newcommand{\mvec}{\mathbf m}\) \(\newcommand{\zerovec}{\mathbf 0}\) \(\newcommand{\onevec}{\mathbf 1}\) \(\newcommand{\real}{\mathbb R}\) \(\newcommand{\twovec}[2]{\left[\begin{array}{r}#1 \\ #2 \end{array}\right]}\) \(\newcommand{\ctwovec}[2]{\left[\begin{array}{c}#1 \\ #2 \end{array}\right]}\) \(\newcommand{\threevec}[3]{\left[\begin{array}{r}#1 \\ #2 \\ #3 \end{array}\right]}\) \(\newcommand{\cthreevec}[3]{\left[\begin{array}{c}#1 \\ #2 \\ #3 \end{array}\right]}\) \(\newcommand{\fourvec}[4]{\left[\begin{array}{r}#1 \\ #2 \\ #3 \\ #4 \end{array}\right]}\) \(\newcommand{\cfourvec}[4]{\left[\begin{array}{c}#1 \\ #2 \\ #3 \\ #4 \end{array}\right]}\) \(\newcommand{\fivevec}[5]{\left[\begin{array}{r}#1 \\ #2 \\ #3 \\ #4 \\ #5 \\ \end{array}\right]}\) \(\newcommand{\cfivevec}[5]{\left[\begin{array}{c}#1 \\ #2 \\ #3 \\ #4 \\ #5 \\ \end{array}\right]}\) \(\newcommand{\mattwo}[4]{\left[\begin{array}{rr}#1 \amp #2 \\ #3 \amp #4 \\ \end{array}\right]}\) \(\newcommand{\laspan}[1]{\text{Span}\{#1\}}\) \(\newcommand{\bcal}{\cal B}\) \(\newcommand{\ccal}{\cal C}\) \(\newcommand{\scal}{\cal S}\) \(\newcommand{\wcal}{\cal W}\) \(\newcommand{\ecal}{\cal E}\) \(\newcommand{\coords}[2]{\left\{#1\right\}_{#2}}\) \(\newcommand{\gray}[1]{\color{gray}{#1}}\) \(\newcommand{\lgray}[1]{\color{lightgray}{#1}}\) \(\newcommand{\rank}{\operatorname{rank}}\) \(\newcommand{\row}{\text{Row}}\) \(\newcommand{\col}{\text{Col}}\) \(\renewcommand{\row}{\text{Row}}\) \(\newcommand{\nul}{\text{Nul}}\) \(\newcommand{\var}{\text{Var}}\) \(\newcommand{\corr}{\text{corr}}\) \(\newcommand{\len}[1]{\left|#1\right|}\) \(\newcommand{\bbar}{\overline{\bvec}}\) \(\newcommand{\bhat}{\widehat{\bvec}}\) \(\newcommand{\bperp}{\bvec^\perp}\) \(\newcommand{\xhat}{\widehat{\xvec}}\) \(\newcommand{\vhat}{\widehat{\vvec}}\) \(\newcommand{\uhat}{\widehat{\uvec}}\) \(\newcommand{\what}{\widehat{\wvec}}\) \(\newcommand{\Sighat}{\widehat{\Sigma}}\) \(\newcommand{\lt}{<}\) \(\newcommand{\gt}{>}\) \(\newcommand{\amp}{&}\) \(\definecolor{fillinmathshade}{gray}{0.9}\).jpg?revision=1&size=bestfit&width=296&height=240)
Figure \(\PageIndex{1}\) Raspberries (Rubus idaeus)
Do you remember the last time you ate raspberries? Did you observe any juice left on the plate? What color was it? What happened to it when you used soap to wash it?
The pH of foods is a major factor affecting their appearance, texture, flavor, nutritional value, and safety. The pH values in food range from 2 to 7 and alkaline foods are rare. The reason for such values of pH is that the acids and bases naturally present in food tend to be weak. The following table displays the pH of some foods [1].
Table \(\PageIndex{1}\) The pH of some foods
| Food | pH | Classification |
| Canned cranberry juice | 2.30 - 2.52 | High acid foods |
| Vinegar | 2.40 - 3.40 | |
| Ketchup | 3.89 - 3.92 | Acid foods |
| Honey | 3.70 - 4.20 | |
| Bananas | 4.50 - 5.20 | Medium acid foods |
| Cottage Cheese | 4.75 - 5.02 | |
| Corn Flakes | 4.90 - 5.38 | Low acid foods |
| Cucumbers | 5.12 - 5.78 | |
| Oysters | 5.68 - 6.17 | |
| Cow's milk | 6.40 - 6.80 | |
| Tofu | 7.0 | |
| Camembert cheese | 7.44 | Alkaline foods |
| Cooked lobster | 7.10 - 7.43 | |
| Graham crackers | 7.10 - 7.92 | |
| Eggs white | 7.96 | |
| Conch | 7.52 - 8.40 |
Example \(\PageIndex{1}\) Hydronium-Ion Concentration
The table above shows the pH of some foods. Find the hydronium-ion concentration in (a) canned cranberry juice and (b) milk.
Solution
a) If you have a calculator which has an antilog or 10x button, the problem is very simple. You enter – 2.30 (for cranberry juice) and hit the button. The number thus obtained, 5.0118 x 10– 3 is the number of moles of hydronium ion per cubic decimeter. This follows from Eq. (1a):
\(\left[\text{H}_{3}\text{O}^{+}\right]=\text{10}^{-\text{pH}}\text{ mol}\text{ dm}^{-3}=\text{10}^{-2.3}\text{ mol}\text{ dm}^{-3}=\text{5.01}\times\text{10}^{-3}\text{ mol}\text{ dm}^{-3}\)
The same result is almost as easy to find using Eq. (1b).
\(\text{10}^{-\text{pH}}=\text{antilog}\left(\text{pH}\right)=\text{antilog 2.30}=\text{antilog 2}\times \text{antilog 0.30}=\text{10}^{2}\times \text{1.99}\)
Thus
\(\text{10}^{-pH}=\dfrac{1}{10^{pH}}=\dfrac{\text{1}}{1.99 * 10^{2}}=\text{5.01}* \text{ 10}^{-3}\)
in other words,
\(\left[\text{H}_{3}\text{O}^{+}\right]=\text{5.01 x 10}^{-3}\text{ mol}\text{ dm}^{3}\)
b) Following the same procedure, the concentration of hydronium-ions in milk with a pH of 6.4 is
\([\text{H}_{3}\text{O}^{+}] = \text{10}^{-pH} \text{mol * dm}^{-3} = \text{10}^{-6.4} \text{mol * dm}^{-3} = \text{3.98 x 10}^{-7} \text{mol * dm}^{-3}\)
While the ability to calculate the pH of a solution from the hydronium-ion concentration and vice versa is useful, it is not the only thing we need to understand about pH. If someone gives you a solution whose pH is 14.74, it is true that the hydronium-ion concentration must be 1.82 × 10⁻¹⁵ mol dm–3 but it is perhaps more important to know that the solution is corrosively basic and should be handled with respect. In general, then, we need not only to be able to calculate a pH but also to have some realization of what kind of solutions have what kind of pH. The following table is designed to meet this need. It is also part of our collection of acid-base resources.
Table \(\PageIndex{2}\) The pH Scale
| Substance | pH | [H3O+] | [OH-] | pOH | Strength | ||
| Battery acid | 0 | 1 | 10-14 | 14 | Strongly acidic | ||
|
|||||||
| 1 | 10-1 | 10-13 | 13 | ||||
| 2 | 10-2 | 10-12 | 12 | ||||
| 3 | 10-3 | 10-11 | 11 | Weakly acidic | |||
| Soda water | 4 | 10-4 | 10-10 | 10 | |||
| Black coffee | 5 | 10-5 | 10-9 | 9 | Barely acidic | ||
| 6 | 10-6 | 10-8 | 8 | ||||
| Pure water | 7 | 10-7 | 10-7 | 7 | Neutral | ||
| Seawater | 8 | 10-8 | 10-6 | 6 | Barely basic | ||
| Baking soda | 9 | 10-9 | 10-5 | 5 | |||
| Toilette soap | 10 | 10-10 | 10-4 | 4 | Mildly basic | ||
| Laundry water | 11 | 10-11 | 10-3 | 3 | |||
| Household ammonia | 12 | 10-12 | 10-2 | 2 | Very basic | ||
| 13 | 10-13 | 10-1 | 1 | ||||
| Drain cleaner | 14 | 10-14 | 1 | 0 |
In pure water at 25°C the hydronium-ion concentration is close to 1.00 × 10⁻⁷ mol dm–3, so that the pH is 7. In consequence any solution, not only pure water, which has a pH of 7 is described as being neutral. An acidic solution, as we know, is one in which the hydronium-ion concentration is greater than that of pure water, i.e., greater than 10–7 mol dm–3. In pH terms this translates into a pH which is less than 7 (because the pH is a negative logarithm). Small pH values are thus characteristic of acidic solutions; the smaller the pH, the more acidic the solution.
By contrast, a basic solution is one in which the hydroxide-ion concentration is greater than 10–7 mol dm–3. In such a solution the hydronium-ion concentration is less than 10–7 mol dm–3, so that the pH of a basic solution is greater than 7. Large pH values are thus characteristic of basic solutions. The larger the pH, the more basic the solution.
Example \(\PageIndex{2}\): pH and pOH
Calculate the pH and the pOH of each of the following aqueous solutions: (a) 1.00 M HClO4 and (b) 0.053 M Sr(OH)2 .
Solution
a) Perchloric acid (HClO4) is a strong acid. For this solution, [H3O+] = 1.00 mol dm–3 and [OH–] = 1.00 x 10⁻¹⁴ mol dm–3. Applying the definitions of pH and pOH, we have
\(\begin{align}\text{pH}=-\text{log}\dfrac{\text{1}\text{.00 mol dm}^{-\text{3}}}{\text{1 mol dm}^{-\text{3}}}=-\text{log(10 }^{\text{0}}\text{)}\\\text{ }=-\text{(0)}=\text{0}\text{.00}\\\text{ }\\\text{pOH}=-\text{log}\dfrac{\text{1}\text{.00 }\times \text{ 10}^{-\text{14}}\text{ mol dm}^{-\text{3}}}{\text{1 mol dm}^{-\text{3}}}=-\text{log(10}^{-\text{14}}\text{)}\\\text{ }=-\text{(}-\text{14)}=14.\text{00}\end{align}\)
b) Since 1 mol of Sr(OH)2 produces 2 mol OH– in solution, we have [OH–] = 2 × 0.053 mol dm–3 = 0.106 mol dm–3 and the concentration of hydronium ions is then,
\[[\text{H}_3 \text{O}^{+}] = \dfrac{K_w}{[OH^{-}]}\]
\[= \dfrac{1.00 * 10^{-14} \text{mol}^{2} \text{dm}^{-6}} {.106 \text{mol} * \text{dm}^{-3}}\]
\[= \text{9.43 x 10}^{-14} \text{mol}*\text{dm}^{-3}\]
Thus,
\(\begin{align}\text{pH} = -\text{log}{9.43}\times{10^{-14}}=-({-13.025})=13.025\\\text{ }\\\text{pOH} = -\text{log}{ 1.06}\times{10^{-1}}=-({-0.975})=0.975\end{align}\)
Colorants
Natural and synthetic colorants are used in food, medicines, clothes, furniture, cosmetics, and other products. Colorants are chemical compounds that absorb light in the wavelength range of the visible region. The color we observe is due to a specific structure in the molecule called chromophore. This structure is able to absorb energy, when this occurs; an electron from an external orbital is excited and ascends to an orbital of higher energy. The non-absorbed energy is then reflected and/or refracted and is captured by the eye, generating neural impulses which are transmitted to the brain, where they are perceived as colors[2]. In most of the literature, colors are described by the wavelength (λ) of the maximum absorption (Amax) in the visible part of the electromagnetic spectrum, expressed in nanometers (nm).
There are natural and synthetic colorants. Natural colorants are also called pigments and comprise the color compounds formed in living or dead cells of plants, animals, fungi, or microorganisms, including organic compounds isolated from cells and structurally modified to alter stability, solubility or color intensity. Besides contributing to the appearance of the organisms and products where they are found, natural pigments have important functions. For example, chlorophyll is essential in the process of photosynthesis and oxygen transportation would not be possible without hemoglobin. Melanins act as protective screen in humans and other vertebrates, while other pigments have pharmacological activity against cancer and cardiovascular disease.
Natural food colors and pH
Anthocyanins are water-soluble natural colorants found in fruits (grapes, raspberries), vegetables (cabbage), cereals (red and blue corn), and flowers (roses, tulips). At the cellular level, anthocyanins are found in vacuoles. Anthocyanins are glycosides of eighteen different anthocyanidins whose structure is shown here.

Figure \(\PageIndex{2}\) Anthocyanidin strucutre[3]. Rx could be H, OH, or OCH3 depending on the pigment.
They exhibit a flavan like structure and are classified as flavonoids. Anthocyanins have shown antioxidant activity and other diverse functions in biological systems including photoprotection, defense mechanisms, reproduction of plants, and ecological control [4]. You have probably heard about the antioxidant activity of berries, grapes, their juices, and of course, wine. The consumption of wine flavonoids has been correlated to the low incidence of coronary hearth disease. Anthocyanins possess bactericidal, antiviral,and funsgistatic activities. They exhibit a strong antioxidant activity that prevents the oxidation of ascorbic acid, peroxidation of lipids, and provides protection against free radicals free radicals . Anthocaynins show inhibitory activity against oxidative enzymes, and have been considered important agents in reducing the risk of cancer and heart disease [5].
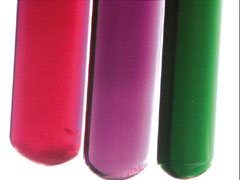 Figure \(\PageIndex{3}\) Anthocyanins from petunias[6].
The color of anthocyanins is highly dependent on pH. Their color gradually changes from red through yellow as the pH changes from 1 to 13 (see table below). The intensity of the color is also affected by pH showing the highest intensity at pH 1 and decreasing as the pH increases. The figure on the left shows the color of anthocyanins from petunias in the presence of vinegar (red, acid pH) and ammonia (green, basic pH). The color change of these colorants is due to several acid-base equilibria. Keep in mind that the overall color we observe is not the result of a single compound, but a mix of them. For example, strawberries contain two types of antohocyanins, while concord grapes contain up to 15 types of these compounds[7]. The color of anthocyanins is also affected by the substitution of hydroxyl and methoxyl groups, an increment in the number of hydroxyl groups deepens the color to a bluish shade, while the increment in the number of methoxyl groups groups increases redness [8]. Anthocyanins can also form complexes with divalent metal ions (Mg2+) producing purple shades.
Note
Note: The hydroxyl groups in anthocyanins (-OH), attached to the molecule by covalent bonds, are different from the hydroxide ion (OH- derived from the dissociation of water
Table \(\PageIndex{3}\) Color and pH of Anthocyanins
| pH |
Color of anthocyanins |
| 1 | red |
| 4 | blue-red |
| 6 | purple |
| 8 | blue |
| 12 | green |
| 13 | yellow |
Example \(\PageIndex{3}\): Color of Foods
Strong acids and bases are not found in food. However, they are often used in food processing and the preparation of food samples for diverse composition analysis. What color would you expect to observe when mixing a sample of raspberries in each of the solutions presented in Example 2?
Solution
a) The pH of the 1.00 M HClO4 solution is extremely low. So, the resulting mix would show a bright red color.
b) On the other hand, 0.053 M Sr(OH)2 produced a basic solution with a pH of 13.025. Mixed in this solution, the anthocyanins in raspberries would produce a yellow coloration.
Regarding the question posed in the beginning of the page, when the residual juice of raspberries is mixed with dish soap, its color will turn blue since it has a basic pH.
There is a very simple relationship between the pH and the pOH of an aqueous solution at 25°C. We know that at this temperature
\[{K}_{w}={K}_{c}\left(\text{55.5 mol}\text{ dm}^{-3}\right)^{2}\left[\text{H}_{3}\text{O}^{+}\right] \left[\text{OH}^{-}\right]={K}_{w}=\text{ 10}^{-14} \text{mol}^{2}\text{dm}^{-6}\]
Dividing both sides by mol2 dm–6, we obtain
\[\dfrac{\text{ }[\text{ H}_{\text{3}}\text{O}^{\text{+}}\text{ }]\text{ }}{\text{mol dm}^{-\text{3}}}\text{ }\times \text{ }\dfrac{[\text{OH}^{-}]}{\text{mol dm}^{-\text{3}}}=\text{10}^{-\text{14}}\]
Taking logs and multiplying both by – 1, we then have
\[\text{log}\dfrac{\text{ }[\text{ H}_{\text{3}}\text{O}^{\text{+}}\text{ }]\text{ }}{\text{mol dm}^{-\text{3}}}\text{ }-\text{ }\log \text{ }\dfrac{[\text{OH}^{-}]}{\text{mol dm}^{-\text{3}}}=-\text{log}(\text{10}^{-\text{14}}\text{)}\]
or
\[\text{pH} + \text{pOH}= \text{14.00}\]
This simple relationship is often useful in finding the pH of solutions containing bases.

Figure \(\PageIndex{4}\) Quercitin: A major dietary flavonol abundantly found in plants.[10]
Anthoxanthins are another group of flavonoids closely related to anthocyanins. These water-soluble compounds are responsible for the white color of cabbage, cauliflower, potatoes, and bananas. In acid solutions, anthoxanthins are white or colorless and in the presence of bases, they turn yellow. In many vegetables, their color is masked by the presence of other pigments such as chlorophylls and anthocyanins. Anthoxanthins include several groups of phenolic compounds: flavonols, flavones, flavanols, flavanones, isoflavones, and their glycosides [11]. Quercitin (figure on the right) is a flavonol of great significance due to the fact that it is abundantly found in plants and consumed in the diet. Anthoxanthins and other polyphenol compounds have antioxidant properties and are attributed with numerous bioactive effects such as hormone modulation, anti-inflamation, and protection of the nervous and cardiovascular systems, among others.

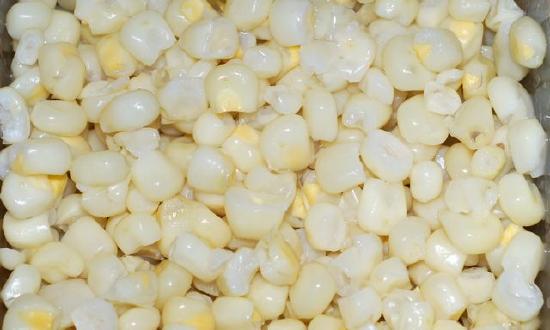
Nixtamalization of corn is an ancient process devised by Mesoamerican cultures long before the arrival of the Spaniards to the American continent. The process involves soaking and heating corn kenerls in aqueous calcium hydroxide. The process has several effects in the physicohemical and nutritional properties of corn, particularly on the proteins and starch. The process aids in the removal of the grain outer layer and softens the endosperm due to partial gelatinization of the starch and protein denaturation. From the nutritional standpoint, nixtamalization increases the bioavailability of niacin and the calcium content of the grain.
Example \(\PageIndex{4}\): pH of a Solution
Calculate the pH of a solution made by dissolving 3.33 g of calcium hydroxide (Ca(OH)2) in water in a 1 L volumetric flask.
Solution If the molar mass of Ca(OH)2 is 74.093 g/mol, the number of moles of this compound is
\(\text{n}_{Ca(OH)_2} = \dfrac{0.33 g \text{Ca(OH)_2}} {74.93 g*mol^{-1}}\)
Since 1 mol of Ca(OH)2 produces 2 mol OH– in 1 L of solution, we have [OH–] = 2 × 0.0449 mol dm–3 = 0.0899 mol dm–3 and the pOH of the solution is then,
\(\text{pOH} = \text{-log} \text{(8.99 x 10}^{-2}) = -(\text{-1.05}) = \text{1.05}\)
given that
\[\text{pH} + \text{pOH}= \text{14.00}\]
This is a solution commonly used in the nixtamalization of corn. During the process, the pericarp layer of corn turns yellow. Upon extensive washing, the outer layer is removed producing a white soft grain. The yellow color observed is produced by the anthoxanthins present in the corn under basic conditions, pH ~ 12.95. If the corn also contains anthocyanins (i.e. blue corn) the color observed will probably be green, a combination of blue (anthocyanins) and yellow (anthoxanthins).
Note
Note: As illustrated in the picture above, corn, displays a variety of colors. In addition to anthoxanthins, corn also contains anthocyanins, xanthophylls, and carotenoids in different proportions depending on the cultivar. From all of these, however, only the color of flavonoid compounds (anthoxanthins and anthocyanins) is strongly affected by pH at room temperature. Can you think a reason, why? Hint: Solubility and chemical reactions.
Other processes where strong bases are used in food are the manufacture of lutefisk, gelatin, pretzels, and annatto extracts. In the processing of olives, NaOH is used to hydrolyze oleuropein, the compound responsible for their bitter taste. Soaking in NaOH also favors the development of black color[14].
From ChemPRIME: 14.2: pH and pOH
References
- ↑ vm.cfsan.fda.gov/~comm/lacf-phs.html
- ↑ Hari, R.K., Patel, T.R., and Martin, A.M. 1994. An overview of pigment production in biological systems: functions, biosynthesis, and applications in food industry. Food Rev. Int.. 10:1:49-70
- ↑ http://en.Wikipedia.org/wiki/File:Anthocyanidine.svg
- ↑ Delgado-Vargas, F., Jimenez, A.R., and Paredes-Lopez, O. 2000. Crit. Rev. Food Sci. Tech. 40:3:173-289
- ↑ Bridle, P. and Timberlake, C.F. 1997. Anthocyanins as natural food colour-selected aspects, Food Chem., 58:1-2:103-109
- ↑ Anthocyanins: A colorful class of compounds. 1997. JCE. 74:10:
- ↑ Natural Food Colorants 2nd Ed. 1996 Hendry & Houghton
- ↑ Delgado-Vargas, F., Jimenez, A.R., and Paredes-Lopez, O. 2000. Crit. Rev. Food Sci. Tech. 40:3:173-289
- ↑ commons.wikimedia.org/wiki/File:Raspberries_(Rubus_Idaeus).jpg
- ↑ upload.wikimedia.org/Wikipedia/commons/9/90/Quercetin.png
- ↑ Han, X., Shen, T., and Lou, H. 2007. Dietary Polyphenols and Their Biological Significance. Int. J. Mol. Sci. 8:950-988
- ↑ commons.wikimedia.org/wiki/File:Corncobs_edit1.jpg
- ↑ commons.wikimedia.org/wiki/File:Sweet_White_Corn.jpg
- ↑ Sanchez-Gomez, A.H., Garcia-Garcia, P. Rejano-Navarro, L. 2006. Elaboration of table olives. Grasas y Aceites 57:1:86-94
Contributors and Attributions
Ed Vitz (Kutztown University), John W. Moore (UW-Madison), Justin Shorb (Hope College), Xavier Prat-Resina (University of Minnesota Rochester), Tim Wendorff, and Adam Hahn.