
In-class Problem Set #1
- Page ID
- 72946

\( \newcommand{\vecs}[1]{\overset { \scriptstyle \rightharpoonup} {\mathbf{#1}} } \)
\( \newcommand{\vecd}[1]{\overset{-\!-\!\rightharpoonup}{\vphantom{a}\smash {#1}}} \)
\( \newcommand{\id}{\mathrm{id}}\) \( \newcommand{\Span}{\mathrm{span}}\)
( \newcommand{\kernel}{\mathrm{null}\,}\) \( \newcommand{\range}{\mathrm{range}\,}\)
\( \newcommand{\RealPart}{\mathrm{Re}}\) \( \newcommand{\ImaginaryPart}{\mathrm{Im}}\)
\( \newcommand{\Argument}{\mathrm{Arg}}\) \( \newcommand{\norm}[1]{\| #1 \|}\)
\( \newcommand{\inner}[2]{\langle #1, #2 \rangle}\)
\( \newcommand{\Span}{\mathrm{span}}\)
\( \newcommand{\id}{\mathrm{id}}\)
\( \newcommand{\Span}{\mathrm{span}}\)
\( \newcommand{\kernel}{\mathrm{null}\,}\)
\( \newcommand{\range}{\mathrm{range}\,}\)
\( \newcommand{\RealPart}{\mathrm{Re}}\)
\( \newcommand{\ImaginaryPart}{\mathrm{Im}}\)
\( \newcommand{\Argument}{\mathrm{Arg}}\)
\( \newcommand{\norm}[1]{\| #1 \|}\)
\( \newcommand{\inner}[2]{\langle #1, #2 \rangle}\)
\( \newcommand{\Span}{\mathrm{span}}\) \( \newcommand{\AA}{\unicode[.8,0]{x212B}}\)
\( \newcommand{\vectorA}[1]{\vec{#1}} % arrow\)
\( \newcommand{\vectorAt}[1]{\vec{\text{#1}}} % arrow\)
\( \newcommand{\vectorB}[1]{\overset { \scriptstyle \rightharpoonup} {\mathbf{#1}} } \)
\( \newcommand{\vectorC}[1]{\textbf{#1}} \)
\( \newcommand{\vectorD}[1]{\overrightarrow{#1}} \)
\( \newcommand{\vectorDt}[1]{\overrightarrow{\text{#1}}} \)
\( \newcommand{\vectE}[1]{\overset{-\!-\!\rightharpoonup}{\vphantom{a}\smash{\mathbf {#1}}}} \)
\( \newcommand{\vecs}[1]{\overset { \scriptstyle \rightharpoonup} {\mathbf{#1}} } \)
\( \newcommand{\vecd}[1]{\overset{-\!-\!\rightharpoonup}{\vphantom{a}\smash {#1}}} \)
\(\newcommand{\avec}{\mathbf a}\) \(\newcommand{\bvec}{\mathbf b}\) \(\newcommand{\cvec}{\mathbf c}\) \(\newcommand{\dvec}{\mathbf d}\) \(\newcommand{\dtil}{\widetilde{\mathbf d}}\) \(\newcommand{\evec}{\mathbf e}\) \(\newcommand{\fvec}{\mathbf f}\) \(\newcommand{\nvec}{\mathbf n}\) \(\newcommand{\pvec}{\mathbf p}\) \(\newcommand{\qvec}{\mathbf q}\) \(\newcommand{\svec}{\mathbf s}\) \(\newcommand{\tvec}{\mathbf t}\) \(\newcommand{\uvec}{\mathbf u}\) \(\newcommand{\vvec}{\mathbf v}\) \(\newcommand{\wvec}{\mathbf w}\) \(\newcommand{\xvec}{\mathbf x}\) \(\newcommand{\yvec}{\mathbf y}\) \(\newcommand{\zvec}{\mathbf z}\) \(\newcommand{\rvec}{\mathbf r}\) \(\newcommand{\mvec}{\mathbf m}\) \(\newcommand{\zerovec}{\mathbf 0}\) \(\newcommand{\onevec}{\mathbf 1}\) \(\newcommand{\real}{\mathbb R}\) \(\newcommand{\twovec}[2]{\left[\begin{array}{r}#1 \\ #2 \end{array}\right]}\) \(\newcommand{\ctwovec}[2]{\left[\begin{array}{c}#1 \\ #2 \end{array}\right]}\) \(\newcommand{\threevec}[3]{\left[\begin{array}{r}#1 \\ #2 \\ #3 \end{array}\right]}\) \(\newcommand{\cthreevec}[3]{\left[\begin{array}{c}#1 \\ #2 \\ #3 \end{array}\right]}\) \(\newcommand{\fourvec}[4]{\left[\begin{array}{r}#1 \\ #2 \\ #3 \\ #4 \end{array}\right]}\) \(\newcommand{\cfourvec}[4]{\left[\begin{array}{c}#1 \\ #2 \\ #3 \\ #4 \end{array}\right]}\) \(\newcommand{\fivevec}[5]{\left[\begin{array}{r}#1 \\ #2 \\ #3 \\ #4 \\ #5 \\ \end{array}\right]}\) \(\newcommand{\cfivevec}[5]{\left[\begin{array}{c}#1 \\ #2 \\ #3 \\ #4 \\ #5 \\ \end{array}\right]}\) \(\newcommand{\mattwo}[4]{\left[\begin{array}{rr}#1 \amp #2 \\ #3 \amp #4 \\ \end{array}\right]}\) \(\newcommand{\laspan}[1]{\text{Span}\{#1\}}\) \(\newcommand{\bcal}{\cal B}\) \(\newcommand{\ccal}{\cal C}\) \(\newcommand{\scal}{\cal S}\) \(\newcommand{\wcal}{\cal W}\) \(\newcommand{\ecal}{\cal E}\) \(\newcommand{\coords}[2]{\left\{#1\right\}_{#2}}\) \(\newcommand{\gray}[1]{\color{gray}{#1}}\) \(\newcommand{\lgray}[1]{\color{lightgray}{#1}}\) \(\newcommand{\rank}{\operatorname{rank}}\) \(\newcommand{\row}{\text{Row}}\) \(\newcommand{\col}{\text{Col}}\) \(\renewcommand{\row}{\text{Row}}\) \(\newcommand{\nul}{\text{Nul}}\) \(\newcommand{\var}{\text{Var}}\) \(\newcommand{\corr}{\text{corr}}\) \(\newcommand{\len}[1]{\left|#1\right|}\) \(\newcommand{\bbar}{\overline{\bvec}}\) \(\newcommand{\bhat}{\widehat{\bvec}}\) \(\newcommand{\bperp}{\bvec^\perp}\) \(\newcommand{\xhat}{\widehat{\xvec}}\) \(\newcommand{\vhat}{\widehat{\vvec}}\) \(\newcommand{\uhat}{\widehat{\uvec}}\) \(\newcommand{\what}{\widehat{\wvec}}\) \(\newcommand{\Sighat}{\widehat{\Sigma}}\) \(\newcommand{\lt}{<}\) \(\newcommand{\gt}{>}\) \(\newcommand{\amp}{&}\) \(\definecolor{fillinmathshade}{gray}{0.9}\)1. Consider a plot that has the concentration of analyte in the stationary phase on the y-axis and the concentration of analyte in the mobile phase on the x-axis.
a) Draw an idealized plot as greater concentrations of analyte are injected into the chromatographic column.
If this is all students are presented with, most are confused as to what is being asked. I spend a few minutes thoroughly describing the experiment that will be performed (a series of consecutive injections in which the total amount of analyte is increased for each subsequent injection). I then give the groups about five minutes to consider this problem, but most students will have no idea how to proceed. Some students may draw shapes resembling parabolas; others may draw lines with negative slope. Some may realize that the concentration in the stationary phase divided by the concentration in the mobile phase must be a constant (the distribution coefficient), but not know how to represent this on the graph. After they have had some time to think it through, I then draw the idealized plot on the board and allow them some time to consider it.
b) Draw what you suspect would really happen.
Again, many students probably will not know how to approach this problem, although some usually realize that at some high enough concentration of analyte the stationary phase will become saturated and are able to draw a correct plot. I make sure to point out correct plots to other members of the groups and other groups, hearing that someone has the correct answer, usually try to listen in to see if they can figure out what would occur. We then spend a few minutes talking about what happens when you exceed the capacity of the stationary phase. Introduce the Langmuir isotherm and anti-Langmuir and talk about why they might occur in both liquid chromatography and gas chromatography.
c) What might the peaks look like in the real versus ideal situations?
I have usually mentioned previously mentioned that an ideal chromatographic peak is Gaussian in shape, but if it has not been mentioned, it may be worth asking the students what they think an ideal peak would look like. They usually respond quickly with a Gaussian and then realize that these non-deal behaviors likely introduce some asymmetry in the peak. We then have a discussion of fronting and tailing and which would be observed for the two different types of non-ideal behavior.
2. What term would we use to describe the movement of a molecule in a liquid stationary phase?
Students will probably arrive at the word “diffusion” very quickly, but some students may be under the impression that diffusion must occur across something such as a membrane. I also ask the students what we commonly say about diffusion as it relates to concentration and they readily offer that compounds diffuse from regions of high concentrations to regions of low concentrations. When probed, it is clear that the students have a misconception about this process, believing that the diffusion is almost purposeful (go from high to low) rather than the result of purely random motion and a statistical consideration and comparison of how many molecules are moving from high-to-low (more) versus low-to-high (fewer). Diagramming this on the board with a system restricted to movement in only two directions usually gets the point across, although it make take a few minutes for every student to be comfortable with this concept.
3. What processes would account for the movement of a molecule through a region of interstitial volume in a mobile phase?
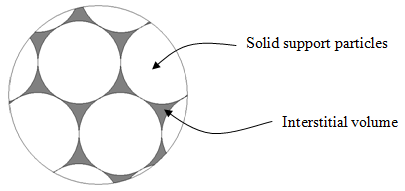
Students should all agree on diffusion and flow as the processes that would account for the movement of a molecule through the interstitial regions.
4. Tswett used starch as his stationary phase.
a) What is the dominant surface functionality of starch?
Allow students a few minutes for this question. Some students may know immediately, but many have probably never considered the chemical composition of starch. Spend a few minutes talking about glucose and hydroxyl groups. Discuss the intermolecular forces relevant to this type of molecule.
b) The two other common solid stationary phases are silica gel (SiO2) and alumina (Al2O3). What do you think are the surface functionalities of these materials?
Draw the structure of a few units of silica gel to give the students an idea of where to start. Some students may think that silica gel is made into a sphere in order to avoid having surface functionality. Some may suggest capping off molecule by protonating the oxygen groups.
I spend a few minutes talking about the siloxane and silanol groups found within silica gel. I discuss the polarity of the solid support and why an organic liquid would make a good mobile phase. I also ask them
What are some problems with using a non-polar organic mobile phase?
Most groups realize that many molecules we are interested in from environmental and biological samples are water-soluble and not organic-soluble.
c) Draw a plot of the distribution of enthalpies of adsorption for a molecule on the surface of starch, silica, or alumina.
Students are completely confused by this question. I begin this problem by talking about what enthalpy of adsorption is. I also indicate that what we are going to consider is the enthalpy of adsorption of a single molecule attaching to a single silanol group (we may not be able to measure this, but we can pretend we can to see what happens). And then that we are going to measure this value over and over again many times and prepare a histogram with the number of measurements at a particular value (y-axis) versus the measured enthalpy of adsorption (x-axis). Even though students may now understand what is being asked, they rarely draw the plots correctly. Many draw exponential decays either going from high to low or low to high. Some draw linear curves with either negative or positive slopes. At this point I encourage them to think about what would happen at the two extremes. Would there be an infinite number of molecules with low energy? Would there be an infinite number of molecules with high energy? Usually by this point at least one member of each group realizes that a Gaussian distribution might be a likely observation (in reality, the distribution is unlikely to be a true Gaussian but at this point, if they can come up with a Gaussian that is good enough). I then point out that the surface of silica gel would also have some disilanol and trisilanol groups, with the expectation that silanol > disilanol > trisilanol, and I then ask them:
On the same plot, draw in two additional distributions of the enthalpy of adsorption for a molecule associating at the disilanol and trisilanol groups.
It is worth reminding them that since there are fewer of these groups than silanols, the two distributions should be smaller. Most groups have some disagreement about whether the two new distributions will occur at a higher or lower average energy. It is worth discussing at the board how a disilanol group can form two simultaneous interactions with an adsorbing molecule that is likely to make the value higher on average. Then point out how the overall enthalpy of adsorption would be the sum of the three different distributions, which is not an asymmetric distribution.
d) What would a chromatographic peak look like on such a phase with such a plot of adsorption enthalpies?
Seeing the overall distribution, most of the groups readily appreciate that the peak should show tailing.
e) What is the problem with this peak?
Concluding this problem set, I discuss some examples of adsorption that occur in the natural world. I especially talk about why oil spills in soil are so hard to clean up since active sites in the soil do not readily release the oil molecules. Also, I point out how most solid surfaces seem to have a small concentration of some especially active sites, such that the distribution of the enthalpy of adsorption is rarely symmetrical and often skewed toward the high energy side of the distribution.
I then ask them to consider a similar plot where the stationary phase is now a coated liquid (partition mechanism) rather than a solid surface (adsorption).
I indicate that we are now considering the enthalpy of solvation. While students are not necessarily sure what to think about this, when prompted they cannot think of any reason why this would be something other than a Gaussian. I then summarize why chromatographic methods based on partitioning are going to be more efficient than those based on adsorption (especially if it involves a polar surface), and remind them why the first work of Martin and Synge on the use of partitioning in chromatography was significant enough to merit a Nobel Prize.