Gas Chromatography of Organochlorine Compounds
- Page ID
- 154230

\( \newcommand{\vecs}[1]{\overset { \scriptstyle \rightharpoonup} {\mathbf{#1}} } \)
\( \newcommand{\vecd}[1]{\overset{-\!-\!\rightharpoonup}{\vphantom{a}\smash {#1}}} \)
\( \newcommand{\dsum}{\displaystyle\sum\limits} \)
\( \newcommand{\dint}{\displaystyle\int\limits} \)
\( \newcommand{\dlim}{\displaystyle\lim\limits} \)
\( \newcommand{\id}{\mathrm{id}}\) \( \newcommand{\Span}{\mathrm{span}}\)
( \newcommand{\kernel}{\mathrm{null}\,}\) \( \newcommand{\range}{\mathrm{range}\,}\)
\( \newcommand{\RealPart}{\mathrm{Re}}\) \( \newcommand{\ImaginaryPart}{\mathrm{Im}}\)
\( \newcommand{\Argument}{\mathrm{Arg}}\) \( \newcommand{\norm}[1]{\| #1 \|}\)
\( \newcommand{\inner}[2]{\langle #1, #2 \rangle}\)
\( \newcommand{\Span}{\mathrm{span}}\)
\( \newcommand{\id}{\mathrm{id}}\)
\( \newcommand{\Span}{\mathrm{span}}\)
\( \newcommand{\kernel}{\mathrm{null}\,}\)
\( \newcommand{\range}{\mathrm{range}\,}\)
\( \newcommand{\RealPart}{\mathrm{Re}}\)
\( \newcommand{\ImaginaryPart}{\mathrm{Im}}\)
\( \newcommand{\Argument}{\mathrm{Arg}}\)
\( \newcommand{\norm}[1]{\| #1 \|}\)
\( \newcommand{\inner}[2]{\langle #1, #2 \rangle}\)
\( \newcommand{\Span}{\mathrm{span}}\) \( \newcommand{\AA}{\unicode[.8,0]{x212B}}\)
\( \newcommand{\vectorA}[1]{\vec{#1}} % arrow\)
\( \newcommand{\vectorAt}[1]{\vec{\text{#1}}} % arrow\)
\( \newcommand{\vectorB}[1]{\overset { \scriptstyle \rightharpoonup} {\mathbf{#1}} } \)
\( \newcommand{\vectorC}[1]{\textbf{#1}} \)
\( \newcommand{\vectorD}[1]{\overrightarrow{#1}} \)
\( \newcommand{\vectorDt}[1]{\overrightarrow{\text{#1}}} \)
\( \newcommand{\vectE}[1]{\overset{-\!-\!\rightharpoonup}{\vphantom{a}\smash{\mathbf {#1}}}} \)
\( \newcommand{\vecs}[1]{\overset { \scriptstyle \rightharpoonup} {\mathbf{#1}} } \)
\(\newcommand{\longvect}{\overrightarrow}\)
\( \newcommand{\vecd}[1]{\overset{-\!-\!\rightharpoonup}{\vphantom{a}\smash {#1}}} \)
\(\newcommand{\avec}{\mathbf a}\) \(\newcommand{\bvec}{\mathbf b}\) \(\newcommand{\cvec}{\mathbf c}\) \(\newcommand{\dvec}{\mathbf d}\) \(\newcommand{\dtil}{\widetilde{\mathbf d}}\) \(\newcommand{\evec}{\mathbf e}\) \(\newcommand{\fvec}{\mathbf f}\) \(\newcommand{\nvec}{\mathbf n}\) \(\newcommand{\pvec}{\mathbf p}\) \(\newcommand{\qvec}{\mathbf q}\) \(\newcommand{\svec}{\mathbf s}\) \(\newcommand{\tvec}{\mathbf t}\) \(\newcommand{\uvec}{\mathbf u}\) \(\newcommand{\vvec}{\mathbf v}\) \(\newcommand{\wvec}{\mathbf w}\) \(\newcommand{\xvec}{\mathbf x}\) \(\newcommand{\yvec}{\mathbf y}\) \(\newcommand{\zvec}{\mathbf z}\) \(\newcommand{\rvec}{\mathbf r}\) \(\newcommand{\mvec}{\mathbf m}\) \(\newcommand{\zerovec}{\mathbf 0}\) \(\newcommand{\onevec}{\mathbf 1}\) \(\newcommand{\real}{\mathbb R}\) \(\newcommand{\twovec}[2]{\left[\begin{array}{r}#1 \\ #2 \end{array}\right]}\) \(\newcommand{\ctwovec}[2]{\left[\begin{array}{c}#1 \\ #2 \end{array}\right]}\) \(\newcommand{\threevec}[3]{\left[\begin{array}{r}#1 \\ #2 \\ #3 \end{array}\right]}\) \(\newcommand{\cthreevec}[3]{\left[\begin{array}{c}#1 \\ #2 \\ #3 \end{array}\right]}\) \(\newcommand{\fourvec}[4]{\left[\begin{array}{r}#1 \\ #2 \\ #3 \\ #4 \end{array}\right]}\) \(\newcommand{\cfourvec}[4]{\left[\begin{array}{c}#1 \\ #2 \\ #3 \\ #4 \end{array}\right]}\) \(\newcommand{\fivevec}[5]{\left[\begin{array}{r}#1 \\ #2 \\ #3 \\ #4 \\ #5 \\ \end{array}\right]}\) \(\newcommand{\cfivevec}[5]{\left[\begin{array}{c}#1 \\ #2 \\ #3 \\ #4 \\ #5 \\ \end{array}\right]}\) \(\newcommand{\mattwo}[4]{\left[\begin{array}{rr}#1 \amp #2 \\ #3 \amp #4 \\ \end{array}\right]}\) \(\newcommand{\laspan}[1]{\text{Span}\{#1\}}\) \(\newcommand{\bcal}{\cal B}\) \(\newcommand{\ccal}{\cal C}\) \(\newcommand{\scal}{\cal S}\) \(\newcommand{\wcal}{\cal W}\) \(\newcommand{\ecal}{\cal E}\) \(\newcommand{\coords}[2]{\left\{#1\right\}_{#2}}\) \(\newcommand{\gray}[1]{\color{gray}{#1}}\) \(\newcommand{\lgray}[1]{\color{lightgray}{#1}}\) \(\newcommand{\rank}{\operatorname{rank}}\) \(\newcommand{\row}{\text{Row}}\) \(\newcommand{\col}{\text{Col}}\) \(\renewcommand{\row}{\text{Row}}\) \(\newcommand{\nul}{\text{Nul}}\) \(\newcommand{\var}{\text{Var}}\) \(\newcommand{\corr}{\text{corr}}\) \(\newcommand{\len}[1]{\left|#1\right|}\) \(\newcommand{\bbar}{\overline{\bvec}}\) \(\newcommand{\bhat}{\widehat{\bvec}}\) \(\newcommand{\bperp}{\bvec^\perp}\) \(\newcommand{\xhat}{\widehat{\xvec}}\) \(\newcommand{\vhat}{\widehat{\vvec}}\) \(\newcommand{\uhat}{\widehat{\uvec}}\) \(\newcommand{\what}{\widehat{\wvec}}\) \(\newcommand{\Sighat}{\widehat{\Sigma}}\) \(\newcommand{\lt}{<}\) \(\newcommand{\gt}{>}\) \(\newcommand{\amp}{&}\) \(\definecolor{fillinmathshade}{gray}{0.9}\)At the end of this assignment, students will be able to:
- Identify what characteristics of a gas chromatographic stationary phase determine the retention times for and extent of separation between injected compounds.
- Discuss the parameters used to evaluate the quality of a separation in GC.
- Understand why temperature programming is used in GC and what determines the maximum operating temperature of a column.
- Explain the figures of merit important in evaluating the performance of a gas chromatographic column.
Purpose
The purpose of this assignment is to introduce concepts of gas chromatography (GC) as they pertain to the separation and identification of organochlorine pesticides found in water samples.
Organochlorine compounds can be quantitatively determined by gas chromatography (GC) at very low levels. The chromatographic column is chosen to separate a large number of the organochlorine species through differential retention by the stationary phase. Separation can be enhanced by temperature programming of the column during separation. Although this project focuses on GC-MS, detection for gas chromatography of organochlorines is also commonly accomplished by electron capture detection (ECD).
Sources of information about compounds and the physicochemical properties affecting their separation can be found at:
NIST Webbook: http://webbook.nist.gov/chemistry/
NIH Chem IDPlus chem.sis.nlm.nih.gov/chemidplus
Compound Separation in Gas Chromatography
The most common columns used today are long (e.g., 30 or 60 m) fused silica capillary tubes. The stationary phase typically consists of a polymeric liquid that is first coated onto and then chemically bonded to the underlying glass surface of the capillary tube. The stationary phase is chosen for its interaction with the compounds to be separated and for its stability to heat. As a compound in the gas phase moves through the column encountering the bonded phase, it will spend some amount of time partitioned into the bonded phase due to an interaction with that material. The magnitude of a compound’s interaction with the stationary phase is expressed as a partition coefficient. Compounds must have different partition coefficients to be separated by a chromatographic column. The smaller the partition coefficient, the less time the compound spends within the stationary phase and the faster it elutes from the column.
Once a stationary phase has been selected, it is important to be able to predict the elution order (the order in which compounds will emerge from the column) of the chemical compounds we wish to separate. In gas chromatography, one possibility is to consider the differences in the boiling points of compounds. The boiling point of a pure compound is dependent on the intermolecular interactions between the molecules. The stronger these interactions, the higher the boiling point. Boiling points of linear alkanes are primarily controlled by dispersion forces. The more atoms in the alkane, the greater the number of polarizable electrons, the greater the energy of interaction, and, consequently, the higher will be the boiling point of the alkane. Table 1 gives the boiling points of a series of linear alkanes
|
Table 1. Linear Alkane Data (http://webbook.nist.gov/chemistry/) |
||||
|
Compounds |
# C atoms |
Mass |
Boiling Point oC |
Boiling Point K |
|---|---|---|---|---|
|
Propane |
3 |
44.0956 |
-42.0oC |
231.1 |
|
Butane |
4 |
58.122 |
-0.5 |
272.5 |
|
Pentane |
5 |
72.148 |
36.0 |
309.2 |
|
Hexane |
6 |
86.17 |
68.8 |
341.9 |
|
Heptane |
7 |
100.2 |
98.4 |
371.5 |
|
Octane |
8 |
114.22 |
125.6 |
398.7 |
|
Nonane |
9 |
128.255 |
150.6 |
423.8 |
|
Decane |
10 |
142.28 |
174.0 |
447.2 |
|
Undecane |
11 |
156.3083 |
195 |
468 |
|
n-dodecane |
12 |
170.3348 |
216 |
489 |
|
Tridecane |
13 |
184.3614 |
234 |
507 |
|
Tetradecane |
14 |
198.3880 |
250 |
523 |
|
Pentadecane |
15 |
212.4146 |
267 |
540 |
Q1. Using the data in Table 1, create a graph of the boiling points of this series of linear alkanes as a function of mass. Describe the trend you observe in the graph.
Q2. Figure 1 contains a portion of chromatogram showing the elution of a sample of n-alkanes from a column held at a constant temperature of 87oC. Estimate the approximate time at which C16 will appear?
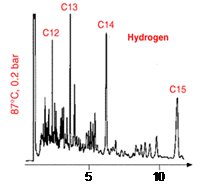
Figure 1. Separation of n-alkanes using hydrogen as the carrier gas. http://www.restek.com/
|
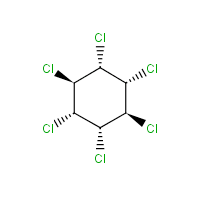
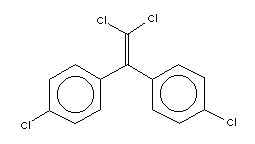
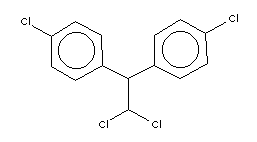
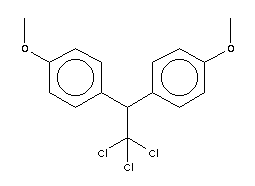
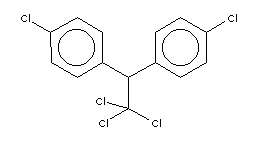
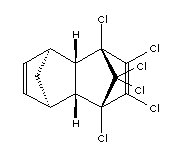
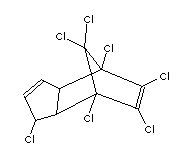
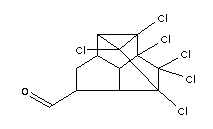
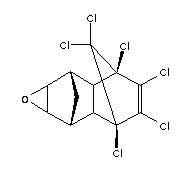
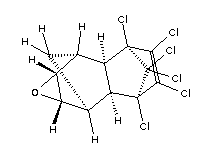
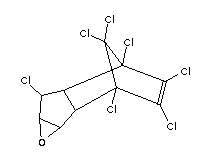
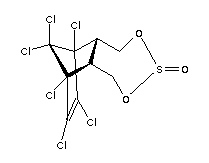
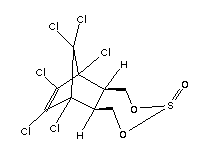
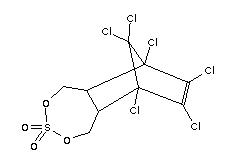
Table 2. Structures, molecular weights, boiling points and retention times of selected organochlorine pesticides (NIST, CHEM IDplus). |
|||||
|
Compound |
Formula CAS registry |
Structure |
M.W. g/mol |
B.P. oC |
Retention time (min) tablulated using 8081B column DB-608 |
|---|---|---|---|---|---|
|
1) Alpha-Lindane (HCH) |
C6H6Cl6 319-84-6 |
|
290.8280 |
288 |
8.14 |
|
2) Del-lindane (HCH) |
C6H6Cl6 319-86-8 |
|
290.8280 |
11.20 |
|
|
3) Gamma lindane (HCH) |
C6H6Cl6 55963-79-6 |
|
290.8280 |
323.4 |
9.52 |
|
4) Lindane |
C6H6Cl6 58-89-9 |
|
290.8280 |
323.4 |
|
|
5) 4-4' DDE |
C14H8Cl4 72-55-9 |
|
318.0241 |
336 |
16.34 |
|
6) 4-4'-DDD |
C14H10Cl4 72-54-8 |
|
320.0400 |
350 |
18.43 |
|
7) Methoxychlor |
C16H15Cl3O2 72-43-5 |
|
345.6472 |
346 |
22.80 |
|
8) 4-4'-DDT |
C14H9Cl5 50-29-3 |
|
354.4848 |
260 * |
19.48 |
|
9) Aldrin |
C12H8Cl6 34487-55-3 |
|
364.913 |
145 |
11.84 |
|
10) Heptachlor |
C10H5Cl7 76-44-8 |
|
373.3156 |
135-145 * |
10.66 |
|
11) Endrin Aldehyde |
C12H8Cl6O 7421-93-4 |
|
380.9075 |
19.72 |
|
|
12) Dieldrin |
C12H8Cl6O 60-57-1 |
|
380.9075 |
330 |
16.41 |
|
13) Endrin |
C12H8Cl6O 72-20-8 |
|
380.9075 |
** |
17.80 |
|
14) Heptachlor epoxide |
C10H5Cl7O 1024-57-3 |
|
389.319 |
135-145 |
13.97 |
|
15) Endosulfan I |
C9H6Cl6O3S 19595-59-6 |
|
406.924 |
15.25 |
|
|
16) Endosulfan II |
C9H6Cl6O3S 33213-65-9 |
|
406.924 |
450 |
18.45 |
|
17) Endosulfan sulfate |
C9H6Cl6O4S 1031-07-8 |
|
422.924 |
481 |
20.21 |
Q3. Using the data in Table 2, create a graph of the boiling points as a function of molecular weight. Is the trend in this graph the same as you observed for the series of n-alkanes? If not, what do you think makes it different?
Q4. Examine the molecular structures of the compounds in Table 2. These compounds can be divided into three general types. Which ones would you group together into the three different types? Within a compound group, is there a relationship between structure, molecular weight and boiling point? Do you think that the compounds in Table 2 can be separated based on their boiling points alone?
Role of the Stationary Phase
|
Table 3. Common Polysiloxane Stationary Phases for GC Separations. http://delloyd.50megs.com/moreinfo/gcphases.html |
|||
|
BONDED PHASE |
TEMP °C |
GENERAL USE OF PHASE |
EQUIVALENTS |
|---|---|---|---|
|
Methyl polysiloxane |
50-325 |
Most frequently used phase in GC. Low selectivity, separates compounds according to boiling points. Excellent thermal stability |
SE-30, OV-1, OV-101, DB-1, SPB-1, BP-1, HP-1, ULTRA-1, RTx-1, AT-1, CPSil-5 |
|
Methyl 5% Phenyl Polysiloxane |
50-325 |
Similar to methyl polysiloxane but slightly more selective due to phenyl content. Excellent thermal stability. |
SE-54, OV-23, DB-5, SPB-5, BP-5, HP-5, ULTRA 2, RTx-5, CPSil-8 |
|
Methyl 50% Phenyl Polysiloxane |
40-325 |
Added selectivity due to higher phenyl content. Usually retains similar compounds longer than methyl silicone. Provides efficient separations of PAHS and biomedical samples such as drugs, sugars and steroids. Good thermal stability. |
OV-17, DB-17, SPB-7, BP-10, HP-17, RTx-17, AT-50, |
|
50% Trifluoropropyl 50% Methyl polysiloxane |
40-300 |
Selectivity for compounds with lone pair electrons or carbonyl groups. Retains oxygenated compounds in the order ether, hydroxy, ester and keto Widely used as a confirmatory phase for chlorinated pesticides. Also suitable for PCB’s, phenols and nitroaromatics. Good thermal stability. |
DB-210, RTx-200, HP-210 |
|
6% Cyanopropylphenyl 94% Methylpolysiloxane |
30-320 |
An additional choice for a general purpose phase with nominal selectivity for polarizable and polar compounds. More of a boiling point phase than 007-1701; and exhibits less retention of polyaromatic compounds than 007-17. Good thermal stability. |
DB-1301, RTx-1301, HP-1301 |
|
Methyl 7% Cyanopropyl 7% Phenyl Polysiloxane |
280 |
Unique selectivity of cyanopropyl and phenyl groups provide efficient separations of derivitized sugars and many environmental samples. Not truly a polar phase. Good thermal stability |
DB-1701, CPSil-19, RTx-1701, AT-1701 |
|
Methyl 25% Cyanopropyl 25% Phenyl Polysiloxane |
40-240 |
Polar phase which provides efficient separations of polar molecules such as fatty acids and alditol acetate derivatives of sugars. Fair thermal stability |
DB-255, HP-255, CPSil-43, RTx-225, AT-255 |
As you may have guessed from the exercises above, it is difficult to design a separation of organochlorine pesticides that depends on physical properties of the compounds alone. To alter the mobilities of the compounds to achieve an adequate separation we need to also consider their interactions with the stationary phase.
Q5. Use the information in Table 3 above to find the column recommended for a boiling point-based separation of linear alkanes. What is the chemical composition of the columns suggested for the separation of alkanes?
In Section 6.9 of EPA method 525.2 a bonded stationary phase is suggested.
“6.9 Fused Silica Capillary Gas Chromatography Column -- Any capillary column that provides adequate resolution, capacity, accuracy, and precision (Section 10.0) can be used. Medium polar, low bleed columns are recommended for use with this method to provide adequate chromatography and minimize column bleed. A 30 m X 0.25 mm id fused silica capillary column coated with a 0.25 µm bonded film of polyphenylmethylsilicone (J&W DB-5.MS) was used to develop this method. Any column which provides analyte separations equivalent to or better than this column may be used.”
Q6. From Table 3 and Figure 2 what are the compositions of the DB-5 and DB-1 stationary phases? Why is the DB-5 phase a better choice for separation of the organochlorine compounds listed in Table 2?
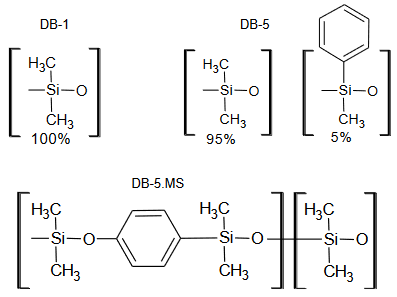
Figure 2. Chemical structures of common GC stationary phases.
The EPA method 525.2 states that any column that provides analytical separations equivalent or better than this one may be used.
Q7. Of the column types listed in Table 3 what might you suggest as alternatives? What figures of merit would you use to determine whether a column provides a “better” separation?
The actual column recommended by the EPA is not DB-5 but DB-5.MS. The MS column designation refers to a bonded siloxane phase with a slightly different chemical composition as shown in Figure 2, which improves the stability and can allow for higher maximum operating temperatures. This reduces column bleed, which is the loss of components of the stationary phase, especially problematic at higher temperatures. Column bleed can produce a high background, reducing the sensitivity of the MS measurements.
Q8. What is column bleed? From the structures in Figure 2, why do you think that the DB-5.MS columns have reduced column bleed than those using the standard DB-5 stationary phase?
Consider the chromatogram of a standard mixture of 20 pesticides shown below.
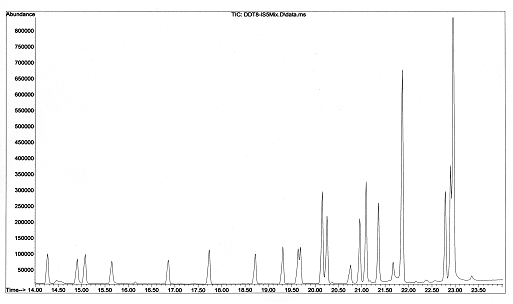
Figure 3. Separation of a 20 pesticide mixture using chrysene-d12 as the internal standard. The separation was performed as described in EPA Method 525.2 except that the carrier gas was at 25 cm/s.
Q9. The chromatogram in Figure 3 shows a separation of a standard containing 20 organochlorine pesticides plus an internal standard. How would you determine which peak correlates to each organochlorine compound? Be specific.
Temperature Programming and Column Stability
The chromatogram in Figure 3 was acquired by increasing the temperature as the separation progresses according to a set program. This is called temperature programming and is a common feature of gas chromatography. The effect of temperature programming on separation time and peak width is illustrated in the animation at http://www.shsu.edu/~chm_tgc/sounds/flashfiles/GCtemp.swf.
Q10. Why is temperature programming commonly used with gas chromatography?
Q11. Look at the maximum temperatures at which the stationary phases in Table 3 are stable. What is the maximum operating temperature for the DB-5 column?
Evaluating the Performance of the Column for Quality Control
Now that we have a column (stationary phase) and a temperature program to achieve separation how do we
- Ensure that we do not overload the column?
- Describe the quality of the separation?
- Establish confidence in the quality of the signal intensity?
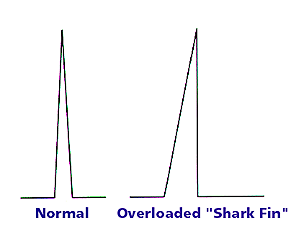
Q12. What would an ideal chromatographic peak look like? What would a chromatographic peak look like if you overloaded the column? Why is it undesirable to overload a column?
The following discussion regarding injection is from EPA method 525.2.
“6.10.1 The GC must be capable of temperature programming and be equipped for splitless/split injection. On-column capillary injection is acceptable if all the quality control specifications in Section 9.0 and Section 10.0 are met. The injection tube liner should be quartz and about 3 mm in diameter. The injection system must not allow the analytes to contact hot stainless steel or other metal surfaces that promote decomposition.”
10.2.3 Inject a 1 µL aliquot of a medium concentration calibration solution, for example 0.5-2 µg/L…”
The instructions in section 10.2.3 indicate that a typical injection should be 1 µL. This injection size coupled with the EPA designated column size sets a limit on the maximum amount of material that can be placed onto the column. The capacity of the column, i.e. the maximum amount of analyte that should be injected, depends upon the volume of the stationary phase and the interaction between the stationary phase and the solute.
Table 4. Column Capacity in ng http://www.chem.agilent.com/cag/cabu/colselect.htm
|
Film Thickness (um) |
Column Diameter (mm) |
|||
|---|---|---|---|---|
|
0.18-0.20 |
0.25 |
0.32 |
0.53 |
|
|
0.10 |
20-35 |
25-50 |
35-75 |
50-100 |
|
0.25 |
35-75 |
50-100 |
75-125 |
100-250 |
|
0.50 |
75-150 |
100-200 |
125-250 |
250-500 |
|
1.00 |
150-250 |
200-300 |
250-500 |
500-1000 |
|
3.00 |
400-600 |
500-800 |
1000-2000 |
|
|
5.00 |
1000-1500 |
1200-2000 |
2000-3000 |
|
Because the EPA method dictates the column used (or similar column) it also dictates the total amount of analyte that can be loaded onto the column.
“6.9 Fused Silica Capillary Gas Chromatography Column -- Any capillary column that provides adequate resolution, capacity, accuracy, and precision (Section 10.0) can be used. Medium polar, low bleed columns are recommended for use with this method to provide adequate chromatography and minimize column bleed. A 30 m X 0.25 mm id fused silica capillary column coated with a 0.25 µm bonded film of polyphenylmethylsilicone (J&W DB-5.MS) was used to develop this method. Any column which provides analyte separations equivalent to or better than this column may be used.”
If the capacity of the column is exceeded the shape of the chromatographic peak is altered from its “normal” Gaussian shape to an asymmetric shape. The figure below shows an example of an asymmetric peak shape that results from fronting. Peak tailing is also possible when columns are overloaded. An older EPA method required documentation that the chromatographic peaks are normal in shape.
If the column is overloaded one solution to the problem is to perform a “split” injection. In splitting, a portion of the sample is swept away in the carrier gas leaving only a fraction behind for injection.
Q13. A 1 L water sample containing 0.1 µg/L of DDT was concentrated to ~1 mL by the sample preparation procedure and 1 µL injected splitless onto a 30 m X 0.25 mm id fused silica capillary column coated with a 0.25 µm bonded film of DB-5.MS. Calculate the ng of material injected. Is this value greater or less than the capacity of the column?
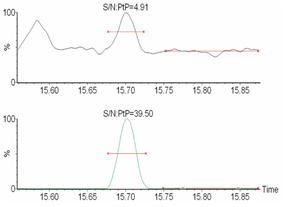
Our method must demonstrate its quality with respect to the baseline. In GC, bleeding of the stationary phase can occur, especially at higher temperatures. Bleeding affects the baseline noise in the spectra. Baseline noise affects the ability to quantitate a given chromatographic peak. This figure shows an example taken from an instrument manufacturer which illustrates the impact of baseline noise in a chromatogram.
Source http://www.waters.com/webassets/cms/category/media/detail_page_images/GCT_Premier_detail_2.jpg
The upper chromatogram has a large baseline signal that registers at about 50% of the intensity of the peak at 15.70 min. The signal to noise (S/N) is calculated as:
\[\dfrac{S}{N} = \dfrac{X_p - X_b}{pp_{baseline}} \nonumber\]
where the signal (S) is defined by the difference in the integrals of Xp (the analyte peak at 15.70 min) and Xb is the integral of a similar area of the baseline. The noise in this formula is calculated as the peak-to-peak noise (ppbaseline) measured in a baseline region containing no peaks. In the top spectrum, the difference between the 15.70 peak intensity (100%) and the baseline intensity (~50%) divided by the peak-to-peak fluctuation in the baseline (shown as a redline) is only 4.91, whereas in the bottom spectrum with less background, a S/N of 39.50. It should be clear that reduction of the baseline bleed (and other contributors to background signals) will greatly enhance the S/N.
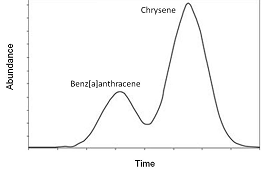
Another quality check for the GC data specified by the EPA method is chromatographic resolution.
“10.2.4.1 GC Performance -- Anthracene and phenanthrene should be separated by baseline. Benz[a]anthracene and chrysene should be separated by a valley whose height is less than 25% of the average peak height of these two compounds. If the valley between benz[a]anthracene and chrysene exceeds 25%, the GC column requires maintenance.”
Q14. Evaluate the GC data below for benz[a]anthracene and chrysene, and determine if the GC column requires maintenance.