
Pesticide Analysis by Mass Spectrometry
- Page ID
- 154517

\( \newcommand{\vecs}[1]{\overset { \scriptstyle \rightharpoonup} {\mathbf{#1}} } \)
\( \newcommand{\vecd}[1]{\overset{-\!-\!\rightharpoonup}{\vphantom{a}\smash {#1}}} \)
\( \newcommand{\id}{\mathrm{id}}\) \( \newcommand{\Span}{\mathrm{span}}\)
( \newcommand{\kernel}{\mathrm{null}\,}\) \( \newcommand{\range}{\mathrm{range}\,}\)
\( \newcommand{\RealPart}{\mathrm{Re}}\) \( \newcommand{\ImaginaryPart}{\mathrm{Im}}\)
\( \newcommand{\Argument}{\mathrm{Arg}}\) \( \newcommand{\norm}[1]{\| #1 \|}\)
\( \newcommand{\inner}[2]{\langle #1, #2 \rangle}\)
\( \newcommand{\Span}{\mathrm{span}}\)
\( \newcommand{\id}{\mathrm{id}}\)
\( \newcommand{\Span}{\mathrm{span}}\)
\( \newcommand{\kernel}{\mathrm{null}\,}\)
\( \newcommand{\range}{\mathrm{range}\,}\)
\( \newcommand{\RealPart}{\mathrm{Re}}\)
\( \newcommand{\ImaginaryPart}{\mathrm{Im}}\)
\( \newcommand{\Argument}{\mathrm{Arg}}\)
\( \newcommand{\norm}[1]{\| #1 \|}\)
\( \newcommand{\inner}[2]{\langle #1, #2 \rangle}\)
\( \newcommand{\Span}{\mathrm{span}}\) \( \newcommand{\AA}{\unicode[.8,0]{x212B}}\)
\( \newcommand{\vectorA}[1]{\vec{#1}} % arrow\)
\( \newcommand{\vectorAt}[1]{\vec{\text{#1}}} % arrow\)
\( \newcommand{\vectorB}[1]{\overset { \scriptstyle \rightharpoonup} {\mathbf{#1}} } \)
\( \newcommand{\vectorC}[1]{\textbf{#1}} \)
\( \newcommand{\vectorD}[1]{\overrightarrow{#1}} \)
\( \newcommand{\vectorDt}[1]{\overrightarrow{\text{#1}}} \)
\( \newcommand{\vectE}[1]{\overset{-\!-\!\rightharpoonup}{\vphantom{a}\smash{\mathbf {#1}}}} \)
\( \newcommand{\vecs}[1]{\overset { \scriptstyle \rightharpoonup} {\mathbf{#1}} } \)
\( \newcommand{\vecd}[1]{\overset{-\!-\!\rightharpoonup}{\vphantom{a}\smash {#1}}} \)
At the end of this assignment, students will be able to:
- Explain the processes involved in the ionization of compounds in GC-MS.
- Predict isotopic distributions and identify chlorinated compounds by their MS isotopic signature and fragmentation patterns.
- Identify and use unique ions for MS quantitation in complex samples.
- Using a sampling scheme for Lake Nakuru, determine the concentrations of DDT from GC-MS results and draw some conclusions as to whether the levels of DDT detected in Lake Nakuru water play a role in flamingos’ death.
Purpose
The purpose of this assignment is to introduce concepts of mass spectrometry (MS) as they pertain to the qualitative and quantitative analysis of organochlorine pesticides found in water samples.
In the previous modules you have been introduced to the problem of flamingo die off events in
Introduction
This section is designed to provide an introduction to mass spectrometry (MS) in the context of its utilization as a gas chromatography detector. The basic concepts of ionization, mass analysis, isotope ratios, and mass spectral interpretation are introduced. Often to solve an analytical problem one must identify a single component in a complex mixture. This is one reason that chromatography is such an important tool for chemical analysis. A goal of our experiment might be to identify a specific pesticide in a water sample containing other pesticides and their degradation products.
Q1. What important information would you need to unambiguously identify a pesticide like DDT in the presence of other similar compounds?
What is unique about a molecule?
One answer to this question could be molecular weight or mass. Consider ethanol, CH3CH2OH. What makes a molecule ethanol and nothing else? You might say “2 carbons, 6 hydrogens, and 1 oxygen” make ethanol. You could further characterize the molecule by saying it had a molar mass of (2 x 12) + (6 x 1) + (1 x 16) = 46 grams/mole. But, that said, what distinguishes it from all other molecules (such as its structural isomer dimethyl ether, CH3OCH3) with a molar mass of 46? Obviously we need more than just molecular weight to unambiguously distinguish ethanol from dimethyl ether. There are important structural differences between these two compounds that distinguish them chemically. Analytical chemists devise techniques that allow determination of both the identity (qualitative analysis) and the concentration or amount (quantitative analysis). One of the most powerful analytical techniques is mass spectrometry. Mass spectrometry is widely used in analytical chemistry and in other fields such as forensics and bioanalysis. In fact, you may have encountered a mass spectrometer while going through airport security. (Jacoby 2009) Some advantages of mass spectrometry include its sensitivity and low detection limits. Both qualitative and quantitative results can be obtained using a mass spectrometer. However, mass spectrometers are in general more costly than the electrochemical and spectroscopic techniques with which you may be familiar from your laboratory coursework.
What happens to molecules in a mass spectrometer?
Mass spectrometry (MS) is a technique in which the analysis is conducted on gas phase ions. These ions are manipulated through a mass analyzer and pass through to a detector. The basic components of a GC-MS instrument are shown in Figure 1.
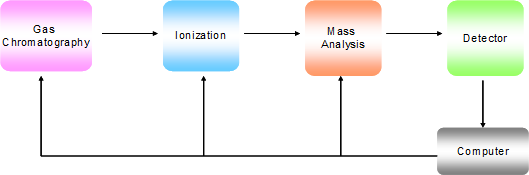
Figure 1. Block diagram of the basic components of a GC-MS instrument.
What kind of information is produced by a mass spectrometer?
A mass spectrometer discriminates between different ions by their mass to charge ratio (m/z). A variety of mass analyzers are available, but for GC-MS, the most commonly used are the quadrupole mass filter and the quadrupole ion trap. These mass analyzers facilitate the movement of ions using electrostatic focusing, and allow only ions of a particular mass to charge ratio (m/z) to hit the detector at a given time, generating a signal. By scanning through the desired mass range, the ions at each m/z value can be detected in turn. The mass spectrum is a plot of ion abundance versus mass-to-charge ratio (m/z). Figure 2 shows the mass spectrum of DDT; the y axis is ion count and the x axis is m/z.

Figure 2. Mass spectrum of DDT.
The molecular weight of DDT, C14H9Cl5, is 354.486 g/mole. Although there is a group of small peaks in the mass spectrum between m/z 350 and 360, the most abundant ion, called the base peak, is at m/z 235. Clearly MS analysis is more complex than it might appear at first glance. In order to interpret the mass spectrum of DDT, we need to understand the process of ionization.
Q2. Why are ions needed instead of neutral species in mass spectrometry?
Q3. Mass spectrometers operate under high vacuum conditions. Why?
MS Ionization Methods
There are many ionization methods available for use in mass spectrometry. The ionization method used is determined by the properties of the analyte and the type of sample (e.g., gas, liquid or solid) to be introduced into the mass spectrometer. In GC-MS, the GC eluent is introduced directly into the ionization source of the mass spectrometer. Because the MS instrument is designed to selectively analyze and detect ions, the molecules in the eluent must first be ionized. The modes of ionization commonly used for GC-MS are electron ionization (EI) and chemical ionization (CI). Electron ionization is used much more frequently than chemical ionization. This learning module will focus on electron ionization. EPA method 525.2 section 6.10.3 states:
“The mass spectrometer must be capable of electron ionization at a nominal electron energy of 70 eV to produce positive ions.”
What happens during electron ionization?
Molecules must be in the vapor state for EI, making it compatible with gas chromatography. In an EI source, electrons are produced by electrically heating a wire filament. A voltage applied between the filament and an anode accelerates the emitted electrons towards the anode. In the ionization space, the energized electrons interact with analyte molecules (M) and induce the loss of a valence electron. This creates a radical cation with an odd number of electrons:
\[\mathrm{M(\mathit{g}) + \mathit{e}^- → M^{+●} + 2\mathit{e}^-}\nonumber\]
When one electron is lost, the resulting radical cation is referred to as the molecular ion. EI is described as a hard ionization method because it produces extensive fragmentation of the molecule. A summary of the process of EI ionization with animations can be viewed at https://www.shimadzu.com/an/gcms/support/fundamentals/molecularion_by_ei.html.
Q4. What is an advantage of having a large number of fragment ions present in the mass spectrum? Are there any disadvantages?
The analysis of organochlorine pesticides in
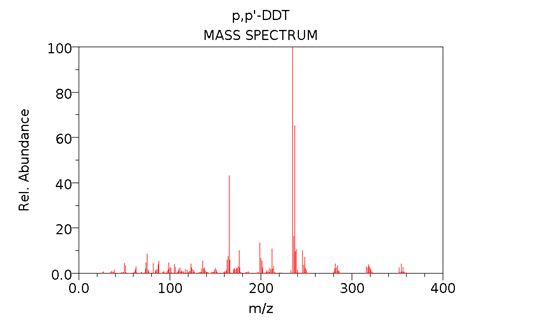
Figure 3. EI mass spectrum of DDT from the NIST webbook, www.webbook.nist.gov/chemistry. Note that in this spectrum, ion intensity is expressed as relative abundance, with the most intense peak defined as 100%.
Q5. Compare the experimentally determined mass spectrum for DDT in Figure 3 to that from the NIST database in Figure 4. Do you think this is a good match? Why?
For complex samples, like water samples from
Q6. Table 2 of the EPA method 525.2 lists the quantitation ions for DDT as 235 and 165. Why do you think these ions were selected to determine the amount of DDT in our sample?
The molecular weight of DDT is 354.486 g/mole. This value is calculated using the average atomic masses of carbon (12.010), hydrogen (1.007), and chlorine (35.453 g/mole). These average atomic weights are calculated from the masses of the naturally occurring isotopes of each element and their relative abundances. For example, there are two naturally occurring isotopes of chlorine, 35Cl (mass 34.96885) and 37Cl (mass 36.96590). These isotopes have a relative abundance of 75.78% for 35Cl and 24.22% for 37Cl.
For a compound containing one chlorine atom, for example CH3Cl, we would calculate an average molecular weight of 50.484 g/mole. Although it is appropriate to use average molecular weights when we are analyzing large numbers of molecules, the mass spectrometer detects individual ions containing either 35Cl or 37Cl. Therefore, we would expect two MS peaks for CH3Cl+ at m/z values of 50 (M+) and 52 (M++2) Da. (
Q7. Using this program, calculate the isotopic abundances of the molecular ion peak for CH3Cl+. Are the calculated relative intensities of the ions at 50 and 52 what you expected? In addition to the expected peaks at 50 and 52 Da, the program lists low intensity peaks at 51 and 53. What is the source of these peaks?
Q8. Now use this program to compare the isotopic distribution patterns of CH3Cl+ to CH2Cl2+, CHCl3+ and CCl4+. What trends do you observe as the number of chlorine atoms increases?
Q9. Now calculate the isotopic distribution expected for the molecular ion (M+) of DDT. How many 35Cl atoms are in the molecule that comprises the most intense peak?
Q10. In a complex environmental sample that has pesticide contaminants at low levels, the GC-MS spectrum extracted for the DDT molecular ion or base peak may have contributions from other compounds, naturally occurring or anthropogenic, that might be confused with DDT. How could the chlorine signature in the mass spectrum be used to help with compound identification?
Q11. Propose a structure for the 235 fragment ion of DDT. Use the isotopic distribution calculator to calculate the relative abundances of the ions expected for the structure you propose. How does the predicted spectrum match the intensities in Figure 2?
In addition to the database match of the fragments in the mass spectrum and analysis of the chlorine signature of each compound, there is additional information that can be used to give confidence in our assignment of an unknown peak in the chromatogram. In GC-MS we have two pieces of information for each compound: its chromatographic retention time and its mass spectrum. Figure 4 shows the total ion chromatogram (TIC) for a standard organochlorine pesticide mixture. The TIC represents the intensity of all of the ions detected over the mass range measured (shown on the y axis) as a function of time (the x axis). Chrysene-d12 was added as an internal standard for this analysis and the GC-MS chromatogram was recorded as described in EPA method 525.2. Although this chromatogram appears complex, it is much less complicated than what would be expected for a real water sample from
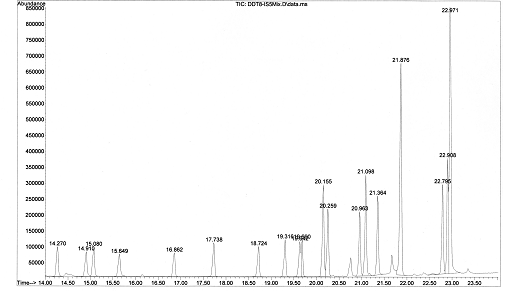
Figure 4. Total Ion Chromatogram (TIC) measured for a standard mixture of 20 organochlorine pesticides, www.restek.com/restek/prod/5670.asp.
The number plotted above each peak in Figure 4 gives its exact retention time (minutes). Each time point in the chromatogram in Figure 4 contains a mass spectrum. Integration across a chromatographic peak produces an average mass spectrum for that peak. For example, Figures 5 and 6 show the mass spectra extracted for the DDT, chrysene-d12, DDE and DDD peaks. Each figure shows the mass spectrum extracted from the chromatogram at a specific time and for comparison, the spectrum from the NIST library is shown below the experimental mass spectrum. Quantitation for chrysene uses the 240 ion, while for DDT, the intensity of the 235 can be used. DDT and DDE share several common ions, because they are closely related structurally.

Figure 5. The top mass spectra were extracted from the TIC in Figure 4 at the retention times indicated. The database mass spectra plotted below for DDT and chrysene-d12 are from the NIST webbook. In each case, the GC retention time and the MS fragmentation pattern gives a positive identification.
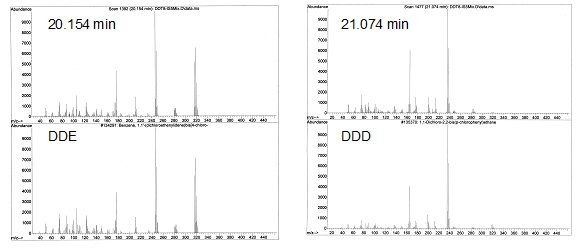
Figure 6. The top mass spectra were extracted from the TIC in Figure 4 at the retention times indicated. The database mass spectra plotted below for DDE and DDD are from the NIST webbook. In each case, the GC retention time and the MS fragmentation pattern gives a positive identification. Note the similarity of the DDD and DDT fragmentation patterns.
Q12. Why was chrysene-d12 selected as an internal standard rather than chrysene with a natural isotopic abundance of hydrogen nuclei? Would you expect that the chrysene and chrysene-d12 to be resolved in the GC chromatogram?
For complex samples, like water samples from
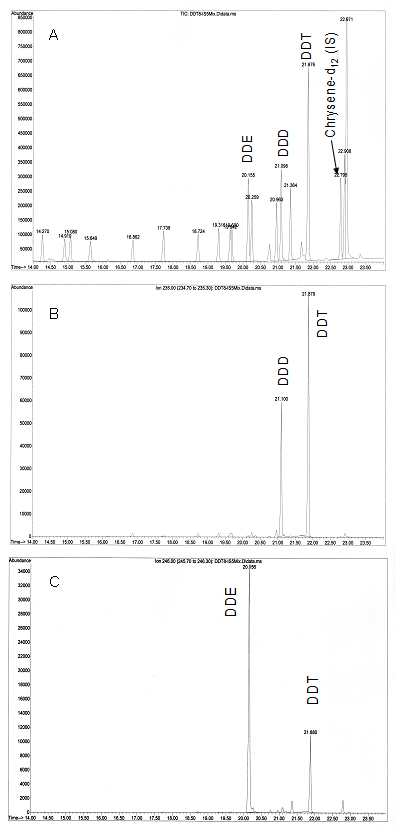
Figure 7. Selected ion chromatograms measured for the pesticide test mixture.
Analysis of Data
With any analysis you must first evaluate the minimum amount of sample that your method can reliably detect. In addition, to demonstrate that analyte is not lost from the sample extraction and other steps in the procedure, you must assess percent recovery for the analyte.
Tables 1 and 2 below present data for DDT collected according to EPA Method 525.2. The data in Table 1 resulted from laboratory fortified blank (LFB) solutions that were spiked at a level of 5.00 μg/L with the internal standard (chrysene-d12) and 0.50 μg/L of DDT. One liter samples of the LFB were carried through the extraction procedure outlined in the method, and the resulting solutions analyzed for DDT concentration. Data in Table 2 resulted from the analysis of calibration standards containing between 0.50 – 10.00 mg/L DDT and 5.00 mg/L chrysene-d12 prepared by the dilution of stock standard solutions in ethyl acetate.
Table 1. Laboratory fortified blank data (0.50 μg/L DDT and 5.00 μg/L chrysene-d12)
|
Sample # |
Intensity of m/z = 240 for chrysene-d12 |
Intensity of m/z = 235 for 4,4'-DDT |
|---|---|---|
|
1 |
2494373 |
143803.1 |
|
2 |
2800996 |
148889.7 |
|
3 |
2985785 |
182870.4 |
|
4 |
2855369 |
180016.7 |
|
5 |
2762538 |
154296.0 |
|
6 |
2602473 |
152374.8 |
|
7 |
2289537 |
125819.2 |
Table 2. DDT calibration data
|
Concentration (mg/L) |
Intensity of m/z = 240 for chrysene-d12 (5 mg/L) |
Intensity of m/z = 235 for 4,4'-DDT |
|---|---|---|
|
0.00 |
0 |
0 |
|
0.50 |
2053420 |
132008 |
|
1.00 |
2874852 |
313059 |
|
2.00 |
3115040 |
614663 |
|
5.00 |
2233038 |
1035790 |
|
10.00 |
2818628 |
2567623 |
Q13. Section 13.1.2 of EPA 525.2 describes the calculation of the method detection limit (MDL) for each analyte. Use the data in Tables 1 and 2 to calculate the MDL for DDT (μg/L). How does this value compare with those found in Tables 3-6 of EPA Method 525.2?
Q14. What is the average percent recovery for DDT indicated for the given data?
A sampling plan is provided for

Figure 8.
Q15. What is the concentration of DDT (μg/L) for each of the five samples you selected?
Q16. Are the levels of DDT that you observed in your samples from
Q17. If you were not limited to water samples, what other types of samples would you collect for analysis and why?