Identifying the Problem
- Page ID
- 216872
\( \newcommand{\vecs}[1]{\overset { \scriptstyle \rightharpoonup} {\mathbf{#1}} } \)
\( \newcommand{\vecd}[1]{\overset{-\!-\!\rightharpoonup}{\vphantom{a}\smash {#1}}} \)
\( \newcommand{\id}{\mathrm{id}}\) \( \newcommand{\Span}{\mathrm{span}}\)
( \newcommand{\kernel}{\mathrm{null}\,}\) \( \newcommand{\range}{\mathrm{range}\,}\)
\( \newcommand{\RealPart}{\mathrm{Re}}\) \( \newcommand{\ImaginaryPart}{\mathrm{Im}}\)
\( \newcommand{\Argument}{\mathrm{Arg}}\) \( \newcommand{\norm}[1]{\| #1 \|}\)
\( \newcommand{\inner}[2]{\langle #1, #2 \rangle}\)
\( \newcommand{\Span}{\mathrm{span}}\)
\( \newcommand{\id}{\mathrm{id}}\)
\( \newcommand{\Span}{\mathrm{span}}\)
\( \newcommand{\kernel}{\mathrm{null}\,}\)
\( \newcommand{\range}{\mathrm{range}\,}\)
\( \newcommand{\RealPart}{\mathrm{Re}}\)
\( \newcommand{\ImaginaryPart}{\mathrm{Im}}\)
\( \newcommand{\Argument}{\mathrm{Arg}}\)
\( \newcommand{\norm}[1]{\| #1 \|}\)
\( \newcommand{\inner}[2]{\langle #1, #2 \rangle}\)
\( \newcommand{\Span}{\mathrm{span}}\) \( \newcommand{\AA}{\unicode[.8,0]{x212B}}\)
\( \newcommand{\vectorA}[1]{\vec{#1}} % arrow\)
\( \newcommand{\vectorAt}[1]{\vec{\text{#1}}} % arrow\)
\( \newcommand{\vectorB}[1]{\overset { \scriptstyle \rightharpoonup} {\mathbf{#1}} } \)
\( \newcommand{\vectorC}[1]{\textbf{#1}} \)
\( \newcommand{\vectorD}[1]{\overrightarrow{#1}} \)
\( \newcommand{\vectorDt}[1]{\overrightarrow{\text{#1}}} \)
\( \newcommand{\vectE}[1]{\overset{-\!-\!\rightharpoonup}{\vphantom{a}\smash{\mathbf {#1}}}} \)
\( \newcommand{\vecs}[1]{\overset { \scriptstyle \rightharpoonup} {\mathbf{#1}} } \)
\( \newcommand{\vecd}[1]{\overset{-\!-\!\rightharpoonup}{\vphantom{a}\smash {#1}}} \)
\(\newcommand{\avec}{\mathbf a}\) \(\newcommand{\bvec}{\mathbf b}\) \(\newcommand{\cvec}{\mathbf c}\) \(\newcommand{\dvec}{\mathbf d}\) \(\newcommand{\dtil}{\widetilde{\mathbf d}}\) \(\newcommand{\evec}{\mathbf e}\) \(\newcommand{\fvec}{\mathbf f}\) \(\newcommand{\nvec}{\mathbf n}\) \(\newcommand{\pvec}{\mathbf p}\) \(\newcommand{\qvec}{\mathbf q}\) \(\newcommand{\svec}{\mathbf s}\) \(\newcommand{\tvec}{\mathbf t}\) \(\newcommand{\uvec}{\mathbf u}\) \(\newcommand{\vvec}{\mathbf v}\) \(\newcommand{\wvec}{\mathbf w}\) \(\newcommand{\xvec}{\mathbf x}\) \(\newcommand{\yvec}{\mathbf y}\) \(\newcommand{\zvec}{\mathbf z}\) \(\newcommand{\rvec}{\mathbf r}\) \(\newcommand{\mvec}{\mathbf m}\) \(\newcommand{\zerovec}{\mathbf 0}\) \(\newcommand{\onevec}{\mathbf 1}\) \(\newcommand{\real}{\mathbb R}\) \(\newcommand{\twovec}[2]{\left[\begin{array}{r}#1 \\ #2 \end{array}\right]}\) \(\newcommand{\ctwovec}[2]{\left[\begin{array}{c}#1 \\ #2 \end{array}\right]}\) \(\newcommand{\threevec}[3]{\left[\begin{array}{r}#1 \\ #2 \\ #3 \end{array}\right]}\) \(\newcommand{\cthreevec}[3]{\left[\begin{array}{c}#1 \\ #2 \\ #3 \end{array}\right]}\) \(\newcommand{\fourvec}[4]{\left[\begin{array}{r}#1 \\ #2 \\ #3 \\ #4 \end{array}\right]}\) \(\newcommand{\cfourvec}[4]{\left[\begin{array}{c}#1 \\ #2 \\ #3 \\ #4 \end{array}\right]}\) \(\newcommand{\fivevec}[5]{\left[\begin{array}{r}#1 \\ #2 \\ #3 \\ #4 \\ #5 \\ \end{array}\right]}\) \(\newcommand{\cfivevec}[5]{\left[\begin{array}{c}#1 \\ #2 \\ #3 \\ #4 \\ #5 \\ \end{array}\right]}\) \(\newcommand{\mattwo}[4]{\left[\begin{array}{rr}#1 \amp #2 \\ #3 \amp #4 \\ \end{array}\right]}\) \(\newcommand{\laspan}[1]{\text{Span}\{#1\}}\) \(\newcommand{\bcal}{\cal B}\) \(\newcommand{\ccal}{\cal C}\) \(\newcommand{\scal}{\cal S}\) \(\newcommand{\wcal}{\cal W}\) \(\newcommand{\ecal}{\cal E}\) \(\newcommand{\coords}[2]{\left\{#1\right\}_{#2}}\) \(\newcommand{\gray}[1]{\color{gray}{#1}}\) \(\newcommand{\lgray}[1]{\color{lightgray}{#1}}\) \(\newcommand{\rank}{\operatorname{rank}}\) \(\newcommand{\row}{\text{Row}}\) \(\newcommand{\col}{\text{Col}}\) \(\renewcommand{\row}{\text{Row}}\) \(\newcommand{\nul}{\text{Nul}}\) \(\newcommand{\var}{\text{Var}}\) \(\newcommand{\corr}{\text{corr}}\) \(\newcommand{\len}[1]{\left|#1\right|}\) \(\newcommand{\bbar}{\overline{\bvec}}\) \(\newcommand{\bhat}{\widehat{\bvec}}\) \(\newcommand{\bperp}{\bvec^\perp}\) \(\newcommand{\xhat}{\widehat{\xvec}}\) \(\newcommand{\vhat}{\widehat{\vvec}}\) \(\newcommand{\uhat}{\widehat{\uvec}}\) \(\newcommand{\what}{\widehat{\wvec}}\) \(\newcommand{\Sighat}{\widehat{\Sigma}}\) \(\newcommand{\lt}{<}\) \(\newcommand{\gt}{>}\) \(\newcommand{\amp}{&}\) \(\definecolor{fillinmathshade}{gray}{0.9}\)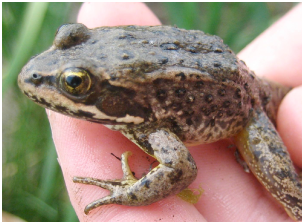
Columbia Spotted Frog Breeding Survey:
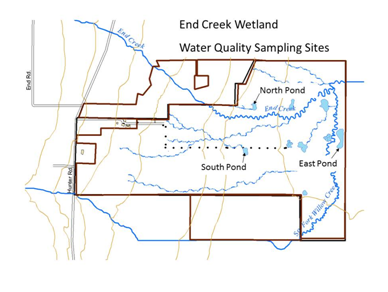
Figure 1. End Creek wetland area.
Aquatic Snails at End Creek:
Three families of pulmonate snails occur in the ponds at End Creek, Physidae, Lymnaeidae, and Planorbidae (Figs. 2-4). Pulmonate snails contain a lung-like organ that allows them to store oxygenated air and remain under water for long periods of time. They also use this air reserve to adjust their buoyancy in the water. Because of their capacity to store air, they are better adapted to survive in water with low oxygen content than other types of snails.
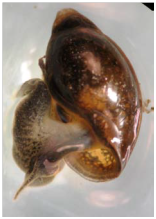
Fig. 2. Physidae
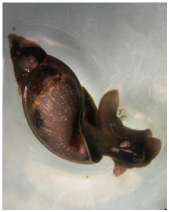
Fig. 3. Lymnaeidae
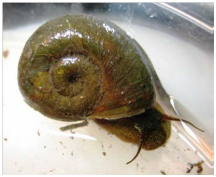
Fig. 4. Planorbidae
These snails are annual species. Adults lay eggs in late winter; eggs hatch in early spring, and the snails grow throughout the summer months. They reach adult size by fall, lay eggs in late winter, and then die. Because of this seasonal life cycle, the time of sampling appears to influence how many snails are found in the samples. In spring, snails presumably are still so small that they are easily missed in the sampling process. By fall, they are larger and are more easily located.
Snails require calcium in order to build their shells; consequently, their growth rates may be influenced by calcium availability (3). Some snails may be more tolerant of low-calcium environments than others. Other aspects of water quality that may influence snail distribution include pH and water buffering capacity. Acidic water can cause loss of calcium from snail shells. Some species may be more tolerant of low pH than others as long as sufficient environmental calcium is available. Sources of acidification may include atmospheric deposition of sulfur and nitrogen oxides from automobiles and industrial emissions. Atmospheric CO2 also can diffuse into water, creating carbonic acid and lowering pH. At pH levels below 5.7, many organisms cannot survive (3). Nitrate toxicity needs to be considered as well. Much like noted for spotted frogs, nitrate can be toxic to aquatic invertebrates and its toxicity increases with concentration and exposure time (1).
Samples of aquatic invertebrates, including snails were collected from two ponds in May 2008 and October 2008 (Tables 1 and 2). In May, a large number of Planorbid snails were found in the North Pond, but in October, only Physid snails were identified in that pond. In May, few snails were found in the South Pond, and Lymnaeids were the most abundant. In October, all three snail families were present in higher numbers. In spring, on average, snails represented about 11% of the total number of invertebrates collected from both ponds. In fall, in both ponds, snails represented about 16% of the total aquatic invertebrates collected in our samples.
Table 1. Snails collected in two ponds in May 2008.
|
North Pond |
South Pond |
|||
|---|---|---|---|---|
|
Family |
Number |
% of total sample |
Number |
% of total sample |
|
Physidae |
2 |
0.39 |
1 |
1.72 |
|
Lymnaeidae |
1 |
0.20 |
4 |
6.90 |
|
Planorbidae |
67 |
13.11 |
0 |
0.0 |
|
Total |
70 |
13.7% |
5 |
8.62% |
Table 2. Snails collected in two ponds in October 2008.
|
North Pond |
South Pond |
|||
|---|---|---|---|---|
|
Family |
Number |
% of total sample |
Number |
% of total sample |
|
Physidae |
46 |
16.4 |
16 |
4.73 |
|
Lymnaeidea |
0 |
0.0 |
25 |
7.4 |
|
Planorbidae |
0 |
0.0 |
15 |
4.44 |
|
Total |
46 |
16.4% |
56 |
16.57% |
In summary, these data suggest that Lymnaeid snails are most abundant in the South Pond and Physid snails are most abundant in the North Pond. It is difficult to understand the dynamics of the Planorbid snails. They were abundant in the North Pond in spring, but did not appear in any samples from that pond in fall. In the South Pond, they did not appear in any samples in spring, but were well-represented in fall sampling. Obviously, further studies will be necessary to better assess snail population distribution in different ponds and over time.
Q1. What are some possible water quality parameters that could affect invertebrate and amphibian populations in a fresh water environment? You may want to research if any information is available on recommended levels of specific ions that may positively or negatively impact these populations.
We could then ask the following questions:
- Is water quality at the End Creek ponds potentially responsible for the decrease observed in spotted frog population?
- Are there differences in water chemistry that influence snail family distribution in the ponds at End Creek?
Following are some water quality parameters that you may want to consider as you undertake this investigation.
Nutrients. Nutrients such as nitrogen and phosphorous are essential to plants and aquatic organisms. However, in larger quantities, they can vastly reduce water quality by triggering accelerated plant growth and algae blooms. These, in turns, may lead to large amounts of decaying plant material causing low dissolved oxygen and, ultimately, death of fish and other aquatic species. Nitrogen species can be particularly toxic to freshwater invertebrates and amphibians (1). Due to the agricultural practices around End Creek, one can speculate that nitrogen and phosphorous sources may come from residual fertilizers. Possible forms of nitrogen can include ammonia (NH3), nitrates (NO3-) and nitrites (NO2-). Phosphorous is typically found as phosphate (PO43-) and can be in the form of organic phosphorous (associated with carbon-based molecules) or inorganic phosphorous (4).
Water hardness. Calcium and magnesium compounds along with other metals contribute to water hardness. Typical guidelines classify water with 0-60 mg/L calcium carbonate as soft; 61-120 mg/L as moderately hard; 121-180 mg/L as hard; and more than 180 mg/L as very hard (5). Snails require calcium to grow their shell and differences in calcium concentrations may play a role as to why snails may be found preferentially in certain ponds (3).
Dissolved oxygen. The amount of oxygen dissolved in water is measured as Dissolved Oxygen (DO). It is typically reported in mg/L or % saturation. The level of dissolved oxygen varies with temperature and altitude and fluctuates seasonally and over a 24-hour period. In ponds dissolved oxygen can fluctuate greatly due to photosynthetic oxygen production by algae during the day and the continuous consumption of oxygen due to respiration. As a result of these processes, dissolved oxygen typically reaches a maximum during the late afternoon and a minimum around sunrise (6). The solubility of oxygen also increases in colder water and decreases at higher altitudes. Decreased availability of dissolved oxygen negatively impacts aquatic organisms and in extreme conditions can cause death.
pH. pH affects many chemical and biological processes in the water. For example, different organisms flourish within different ranges of pH. The largest variety of aquatic animals prefers a range of 6.5-8.0. pH conditions outside this range reduce the diversity in the stream because it stresses the physiological systems of most organisms and can reduce reproduction. Low pH can also allow toxic elements and compounds to become mobile and “available” for uptake by aquatic plants and animals. This can produce conditions that are toxic to aquatic life, particularly to invertebrates such as snails. Changes in acidity can be caused by atmospheric deposition (acid rain), the surrounding rock, and certain wastewater discharges.
Total solids. Total solids include dissolved solids (typically cations and anions of salts that will pass through a filter with 2 micron pores) and suspended solids (silt and clay particles, algae, small debris and other particulate matter with size larger than 2 micron). Because the particles absorb heat, greater amounts of suspended solids contribute to increased water temperature thus decreasing availability of dissolved oxygen. Suspended particles can be carriers of toxins, particularly pesticides and herbicides, in water bodies in proximity to agricultural land. They can clog fish gills and affect egg development. Dissolved solids affect the water balance in cells. If the amount of dissolved solids is too low, aquatic organisms will tend to swell as water moves inside the cells. Levels of dissolved solids that are too high will cause organisms to shrink due to water moving out of cells (4).
Identifying possible analysis methods
Water quality tests can be performed on site using inexpensive field kits that provide fast response with minimal sample preparation. Alternatively, water can be collected and brought back to a laboratory where analyses can be conducted using more sophisticated instrumentation.
The purpose of this module is to lead you to identify appropriate methods of analysis best suited to test possible differences in the water quality of the ponds located at End Creek. As you research these methods, assess them in terms of their sensitivity, ease of implementation, cost, speed, etc.
Experimental Design for this Project
Once you decide on the most appropriate methods of analysis, the next step will be to design an experiment that will provide meaningful data so that sound conclusions can ultimately be drawn. It may be helpful as you embark in this investigation to refer to guidelines and protocols such as those provided by the Environmental Protection Agency (EPA) (4) or the American Public Health Association (APHA) (7). You may want to specifically refer to the EPA Volunteer Stream Monitoring: A Methods Manual (http://water.epa.gov/type/rsl/monitoring/stream_index.cfm). Often one may have to adapt a method based on available equipment or other limitations. Therefore, it is important to understand all aspects of a given method and be able to show that your method is valid.
Analysis of Samples from End Creek ponds
In our case study we will develop a sampling plan for water samples to be collected at three ponds where egg clusters and snails have been identified. Some tests could be conducted on site and compared to more sophisticated analyses conducted in the laboratory. For this purpose water will be collected, brought back to the lab and stored for further analyses. Due to time and cost constraints, there are limitations on the number of samples that can be processed (limited to 30).
The subsequent parts of this module will examine the following two questions:
How do you decide where and when to collect samples to ensure they are representative?
How will you process the water for storage to ensure that analytes are not degraded or lost during storage and how long can you store your water sample?
A series of assignments are presented to help you understand how to design a water quality monitoring experiment and address questions such as those posed above. Through this process, you will also be introduced to important analytical chemistry concepts that underlie the analytical methods discussed.
References
- Camargo, J.A., Alonso, A., Salamanca, A. Nitrate toxicity to aquatic animals: a review with new data for freshwater invertebrates. Chemosphere 58 (2005) 1255–1267.
- Columbia spotted frogs -http://ecos.fws.gov/speciesProfile/profile/speciesProfile.action?spcode=D027 accessed on 07-25-2013.
- Ewald, M.L., Feminella, J.W., Lenertz, K.K., Henry, R.P. Acute physiological responses of the freshwater snail Elimia flava (Mollusca: Pleuroceridae) to environmental pH and calcium. Comparative Biochemistry and Physiology, Part C 150 (2009) 237- 245.
- Volunteer Stream Monitoring: A Methods Manual – http://water.epa.gov/type/rsl/monitoring/stream_index.cfm accessed on 07-25-2013
- Water hardness – http://water.usgs.gov/owq/hardness-alkalinity.html accessed on 07-25-2013
- Caduto, M.J. 1990. Pond and Brook: a guide to nature in freshwater environments. Prentice-Hall, Inc. Englewood Cliffs, NJ.
- APHA. 1992. Standard methods for the examination of water and wastewater. 18th ed. American Public Health Association, Washington, DC.


