
Uncertainty
- Page ID
- 274050

Introduction
Suppose you are analyzing soil samples from a school playground near a busy intersection. After collecting three samples, you return to the lab, extract the soil samples with water and, using an atomic absorption spectrometer, determine the concentration of lead in the resulting extracts, obtaining an average result of 4.38 parts-per-billion (ppb). What kinds of errors might affect this result? As shown in this figure
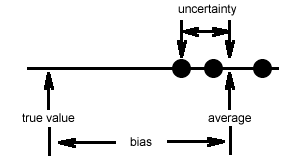
the error has two parts. Any difference between the average result and the true value (there is a true value, even if we do not know it!) is a bias in our analysis. Possible sources of bias include, for example, failing to calibrate the instrument or contaminating the samples by collecting them in bottles that were not properly cleaned. Errors such as these are called determinate and they affect the accuracy of the result. Determinate errors are systematic, with a fixed value in a single direction relative to the true value.
The differences between the results for the three samples and their average (one example is labeled in the figure above) result from the uncertainty in making a measurement. An atomic absorption spectrometer, for example, works by drawing the sample into a flame where the flame's energy converts the aqueous lead ions into gaseous lead atoms. The flow of sample into the flame and the efficiency of atomization are not constant over time; instead, each varies around an average value. The result, as shown below, is a noisy signal.
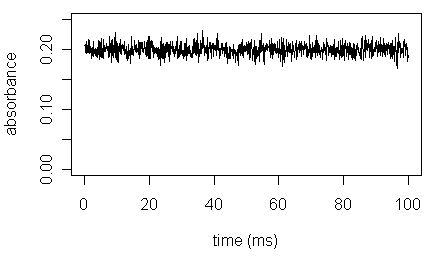
If we divide the signal into five 20 ms periods, the resulting average signals will differ slightly from each other. Some of the results will be greater than 0.200 (the true value) and some results will be less than 0.200. This type of error is indeterminate and affects the precision (reproducibility) of our results, but not their accuracy. Indeterminate errors are random, having a value that is not constant and that may be either greater or smaller than the average value. The uncertainty of measurements is the focus of this module.
After you complete this module you should understand that:
- significant figures are one way to express a measurement's uncertainty
- for a result that depends on several different measurements, the uncertainty of each measurement contributes to the result's uncertainty
Begin with Problem 1.