
20.2: Ion Sources
- Page ID
- 391119

\( \newcommand{\vecs}[1]{\overset { \scriptstyle \rightharpoonup} {\mathbf{#1}} } \)
\( \newcommand{\vecd}[1]{\overset{-\!-\!\rightharpoonup}{\vphantom{a}\smash {#1}}} \)
\( \newcommand{\dsum}{\displaystyle\sum\limits} \)
\( \newcommand{\dint}{\displaystyle\int\limits} \)
\( \newcommand{\dlim}{\displaystyle\lim\limits} \)
\( \newcommand{\id}{\mathrm{id}}\) \( \newcommand{\Span}{\mathrm{span}}\)
( \newcommand{\kernel}{\mathrm{null}\,}\) \( \newcommand{\range}{\mathrm{range}\,}\)
\( \newcommand{\RealPart}{\mathrm{Re}}\) \( \newcommand{\ImaginaryPart}{\mathrm{Im}}\)
\( \newcommand{\Argument}{\mathrm{Arg}}\) \( \newcommand{\norm}[1]{\| #1 \|}\)
\( \newcommand{\inner}[2]{\langle #1, #2 \rangle}\)
\( \newcommand{\Span}{\mathrm{span}}\)
\( \newcommand{\id}{\mathrm{id}}\)
\( \newcommand{\Span}{\mathrm{span}}\)
\( \newcommand{\kernel}{\mathrm{null}\,}\)
\( \newcommand{\range}{\mathrm{range}\,}\)
\( \newcommand{\RealPart}{\mathrm{Re}}\)
\( \newcommand{\ImaginaryPart}{\mathrm{Im}}\)
\( \newcommand{\Argument}{\mathrm{Arg}}\)
\( \newcommand{\norm}[1]{\| #1 \|}\)
\( \newcommand{\inner}[2]{\langle #1, #2 \rangle}\)
\( \newcommand{\Span}{\mathrm{span}}\) \( \newcommand{\AA}{\unicode[.8,0]{x212B}}\)
\( \newcommand{\vectorA}[1]{\vec{#1}} % arrow\)
\( \newcommand{\vectorAt}[1]{\vec{\text{#1}}} % arrow\)
\( \newcommand{\vectorB}[1]{\overset { \scriptstyle \rightharpoonup} {\mathbf{#1}} } \)
\( \newcommand{\vectorC}[1]{\textbf{#1}} \)
\( \newcommand{\vectorD}[1]{\overrightarrow{#1}} \)
\( \newcommand{\vectorDt}[1]{\overrightarrow{\text{#1}}} \)
\( \newcommand{\vectE}[1]{\overset{-\!-\!\rightharpoonup}{\vphantom{a}\smash{\mathbf {#1}}}} \)
\( \newcommand{\vecs}[1]{\overset { \scriptstyle \rightharpoonup} {\mathbf{#1}} } \)
\(\newcommand{\longvect}{\overrightarrow}\)
\( \newcommand{\vecd}[1]{\overset{-\!-\!\rightharpoonup}{\vphantom{a}\smash {#1}}} \)
\(\newcommand{\avec}{\mathbf a}\) \(\newcommand{\bvec}{\mathbf b}\) \(\newcommand{\cvec}{\mathbf c}\) \(\newcommand{\dvec}{\mathbf d}\) \(\newcommand{\dtil}{\widetilde{\mathbf d}}\) \(\newcommand{\evec}{\mathbf e}\) \(\newcommand{\fvec}{\mathbf f}\) \(\newcommand{\nvec}{\mathbf n}\) \(\newcommand{\pvec}{\mathbf p}\) \(\newcommand{\qvec}{\mathbf q}\) \(\newcommand{\svec}{\mathbf s}\) \(\newcommand{\tvec}{\mathbf t}\) \(\newcommand{\uvec}{\mathbf u}\) \(\newcommand{\vvec}{\mathbf v}\) \(\newcommand{\wvec}{\mathbf w}\) \(\newcommand{\xvec}{\mathbf x}\) \(\newcommand{\yvec}{\mathbf y}\) \(\newcommand{\zvec}{\mathbf z}\) \(\newcommand{\rvec}{\mathbf r}\) \(\newcommand{\mvec}{\mathbf m}\) \(\newcommand{\zerovec}{\mathbf 0}\) \(\newcommand{\onevec}{\mathbf 1}\) \(\newcommand{\real}{\mathbb R}\) \(\newcommand{\twovec}[2]{\left[\begin{array}{r}#1 \\ #2 \end{array}\right]}\) \(\newcommand{\ctwovec}[2]{\left[\begin{array}{c}#1 \\ #2 \end{array}\right]}\) \(\newcommand{\threevec}[3]{\left[\begin{array}{r}#1 \\ #2 \\ #3 \end{array}\right]}\) \(\newcommand{\cthreevec}[3]{\left[\begin{array}{c}#1 \\ #2 \\ #3 \end{array}\right]}\) \(\newcommand{\fourvec}[4]{\left[\begin{array}{r}#1 \\ #2 \\ #3 \\ #4 \end{array}\right]}\) \(\newcommand{\cfourvec}[4]{\left[\begin{array}{c}#1 \\ #2 \\ #3 \\ #4 \end{array}\right]}\) \(\newcommand{\fivevec}[5]{\left[\begin{array}{r}#1 \\ #2 \\ #3 \\ #4 \\ #5 \\ \end{array}\right]}\) \(\newcommand{\cfivevec}[5]{\left[\begin{array}{c}#1 \\ #2 \\ #3 \\ #4 \\ #5 \\ \end{array}\right]}\) \(\newcommand{\mattwo}[4]{\left[\begin{array}{rr}#1 \amp #2 \\ #3 \amp #4 \\ \end{array}\right]}\) \(\newcommand{\laspan}[1]{\text{Span}\{#1\}}\) \(\newcommand{\bcal}{\cal B}\) \(\newcommand{\ccal}{\cal C}\) \(\newcommand{\scal}{\cal S}\) \(\newcommand{\wcal}{\cal W}\) \(\newcommand{\ecal}{\cal E}\) \(\newcommand{\coords}[2]{\left\{#1\right\}_{#2}}\) \(\newcommand{\gray}[1]{\color{gray}{#1}}\) \(\newcommand{\lgray}[1]{\color{lightgray}{#1}}\) \(\newcommand{\rank}{\operatorname{rank}}\) \(\newcommand{\row}{\text{Row}}\) \(\newcommand{\col}{\text{Col}}\) \(\renewcommand{\row}{\text{Row}}\) \(\newcommand{\nul}{\text{Nul}}\) \(\newcommand{\var}{\text{Var}}\) \(\newcommand{\corr}{\text{corr}}\) \(\newcommand{\len}[1]{\left|#1\right|}\) \(\newcommand{\bbar}{\overline{\bvec}}\) \(\newcommand{\bhat}{\widehat{\bvec}}\) \(\newcommand{\bperp}{\bvec^\perp}\) \(\newcommand{\xhat}{\widehat{\xvec}}\) \(\newcommand{\vhat}{\widehat{\vvec}}\) \(\newcommand{\uhat}{\widehat{\uvec}}\) \(\newcommand{\what}{\widehat{\wvec}}\) \(\newcommand{\Sighat}{\widehat{\Sigma}}\) \(\newcommand{\lt}{<}\) \(\newcommand{\gt}{>}\) \(\newcommand{\amp}{&}\) \(\definecolor{fillinmathshade}{gray}{0.9}\)Since a mass spectrum shows the relative abundance of ions with different mass-to-charge ratios, a mass spectrometer must include a way to generate ions. More specifically, it needs a method that generates the initial ion as it, once formed, will undergo fragmentation without additional help from the analyst (which does not mean the analyst cannot assist in that fragmentation; see discussion of tandem mass spectrometry in Section 20.4). In this section we consider several common ion sources. We can describe these sources using two characteristic properties: (a) the physical state of the species that is initially ionized (gas, liquid, or solid phase), and (b) whether ionization favors the formation of fragment ions or the formation of molecular ions (hard sources or soft sources).
Electron Ionization Sources (gas phase/hard source)
The electron ionization (EI) source, also known as an electron impact source, uses a beam of energetic electrons to ionize the analyte. As shown in \(\PageIndex{1}\), the sample is volatilized prior to entering the ion source as gas phase molecules, M(g). A heated tungsten filament is used to generate electrons, which are pulled toward a positively charged anode. This electron beam intersects with the gas phase molecules at 90° where ionization occurs
\[ \ce{M}(g) + e^- \rightarrow \ce{M^{+•}}(g) + 2e^- \label{ei1} \]
The molecular ions, \(\ce{M^{+•}}(g)\), are then swept into the mass analyzer using a set of accelerating plates (not shown here).
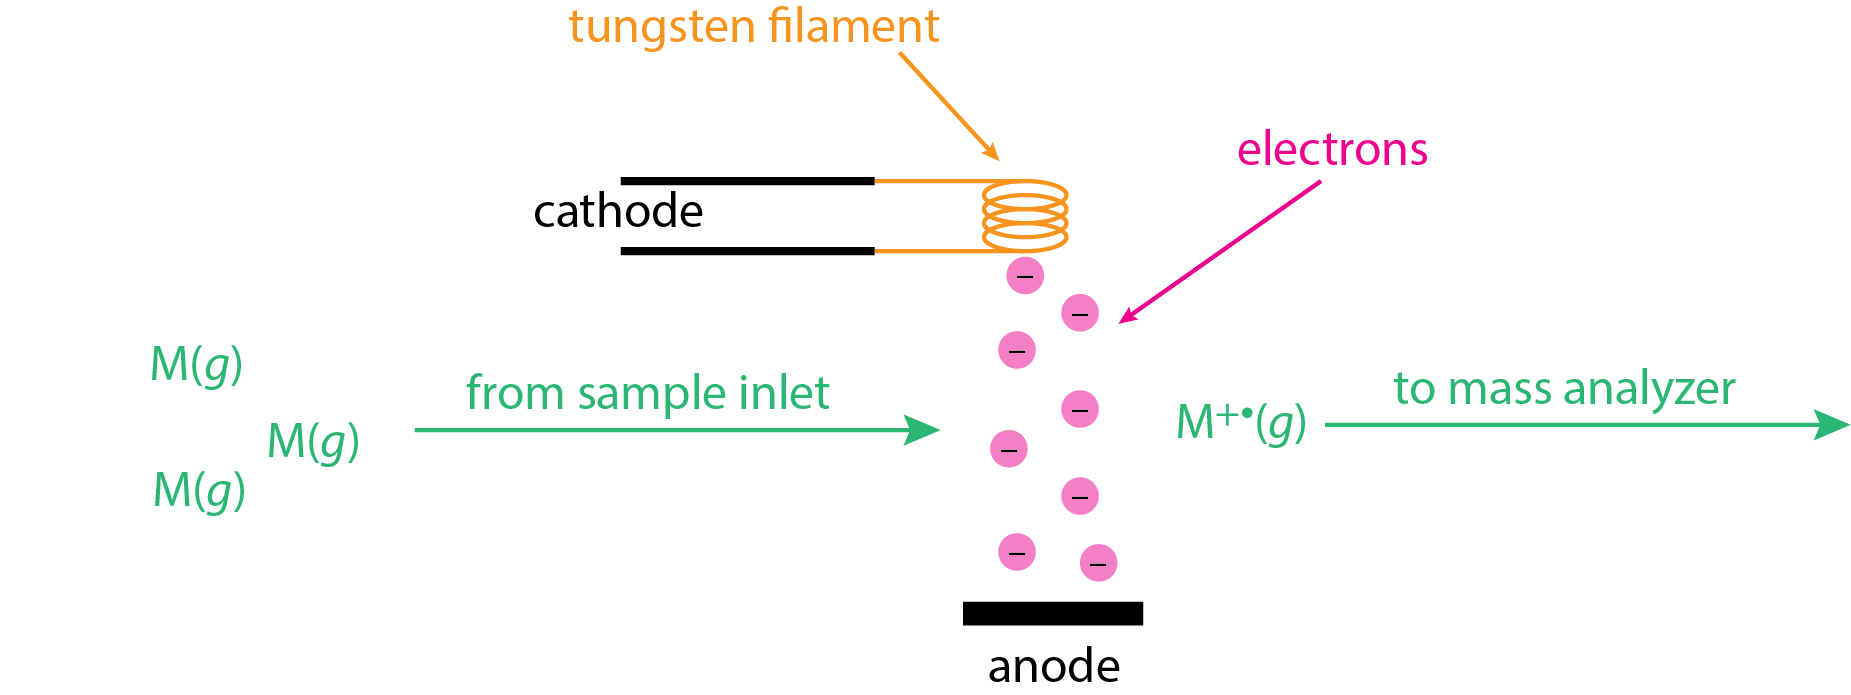
The electron beam in Figure \(\PageIndex{1}\) has a lot of energy due to the significant potential difference between the cathode and the anode, which may be as much as 70 V. The kinetic energy of these electrons is equivalent to the product of the electron's charge in Coulombs, the applied potential in volts, and Avogadro's number
\[e \times V \times N_A = 1.6 \times 10^{-19} \times 6.022 \times 10^{-23} = 6.7 \times 10^{6} \text{ J/mol} \nonumber \]
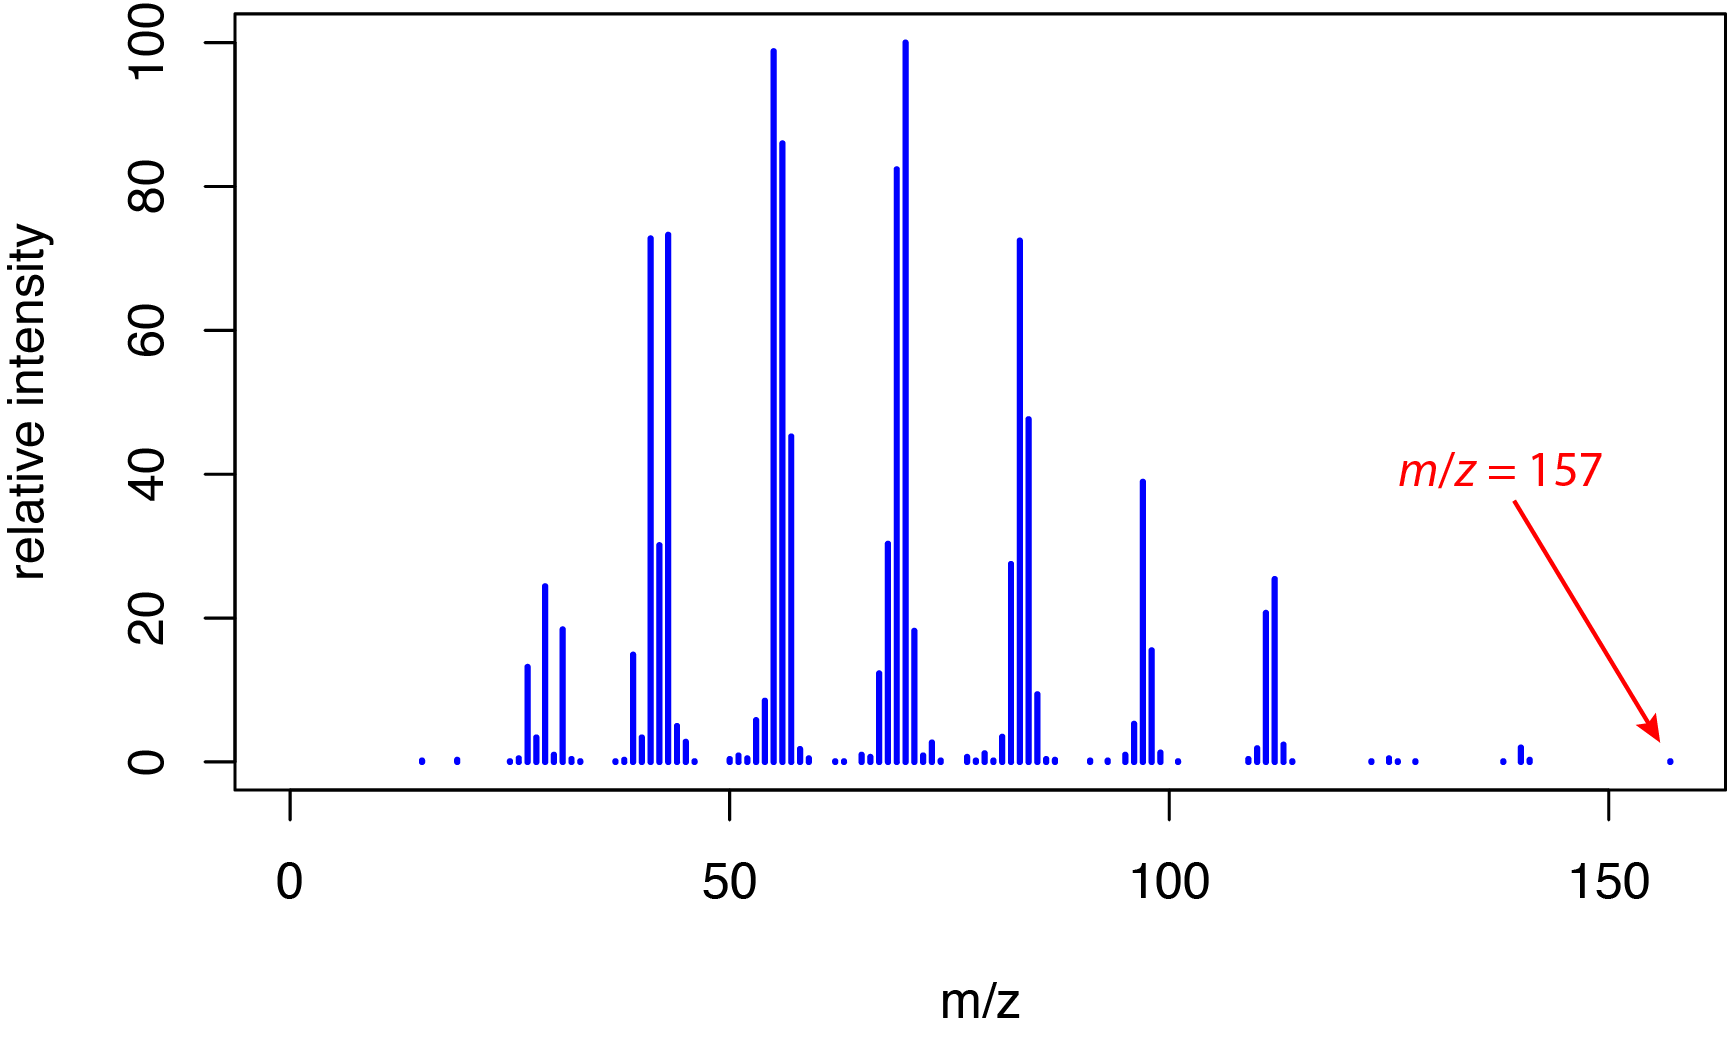
or 6,700 kJ/mol. This energy is much greater than typical bond energies, which range from approximately 150–600 kJ/mol for single bonds, from approximately 500–750 kJ/mol for double bonds, and from approximately 800–1100 kJ/mol for triple bonds. The significant difference between the energy of the electrons and bond energies explains why electron ionization spectra are rich in fragment ions, as we saw earlier in Section 20.1 for o-nitrophenol, m-nitrophenol, and p-nitrophenol. This extensive fragmentation is useful in determining an analyte's structure—which is an advantage of a hard ionization method—but at the possible cost of the loss of the molecular ion peak for some analytes. For example, Figure \(\PageIndex{2}\) shows the electron ionization mass spectrum from 1-decanol, C10H22O, which has a nominal mass of 158 daltons. The small peak at m/z = 157 is for the fragment ion C10H21O+; the molecular ion is not observed in this spectrum.
Chemical Ionization Sources (gas phase/soft source)
Electron ionization is a hard source because the electron beam's energy results in easy fragmentation. In chemical ionization, we introduced a reagent molecule, such as methane, into the electron ionization (CI) source so that it is present at level that is \(1000 \times\) to \(10,000 \times\) greater than the analyte. At this higher concentration, it is the reagent molecule that is ionized; for example, when using CH4 as the reagent gas, ions such as \(\ce{CH4+}\) and \(\ce{CH3+}\) form. These ions then react with additional methane molecules
\[\ce{CH4+}(g) + \ce{CH4}(g) \rightarrow \ce{CH5+}(g) + \ce{CH3}(g) \label{ci1} \]
\[\ce{CH3+}(g) + \ce{CH4}(g) \rightarrow \ce{C2H5+}(g) + \ce{H2}(g) \label{ci2} \]
to form \(\ce{CH5+}\) and \(\ce{C2H5+}\), species that are sufficiently reactive that they easily transfer a hydrogen to a molecule of the analyte, MH
\[\ce{CH5+}(g) + \ce{MH}(g) \rightarrow \ce{MH2+}(g) + \ce{CH4}(g) \label{ci3} \]
to give a molecular ion that we identify as [M + H]+ and that has a mass that is one amu unit greater than that for M. Alternatively, they can easily remove a hydrogen from a molecule of the analyte, MH
\[\ce{C2H5+}(g) + \ce{MH}(g) \rightarrow \ce{M+}(g) + \ce{C2H6}(g) \label{ci4} \]
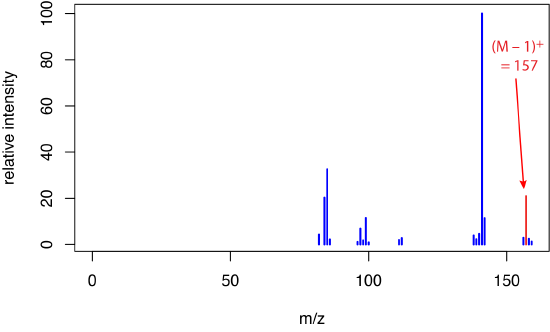
to give a molecular ion that we identify as [M – H]– and that has a mass that is one amu less than that for M. Because formation of the molecular ion occurs indirectly and less energetically, fragmentation is suppressed, leading to a mass spectrum with a molecular ion peak and with only a small number of other ions. Figure \(\PageIndex{2}\) shows the mass spectrum for 1-decanol when using chemical ionization with \(\ce{CH4}\) as the reagent gas.
Electrospray Ionization Sources (liquid phase/soft source)
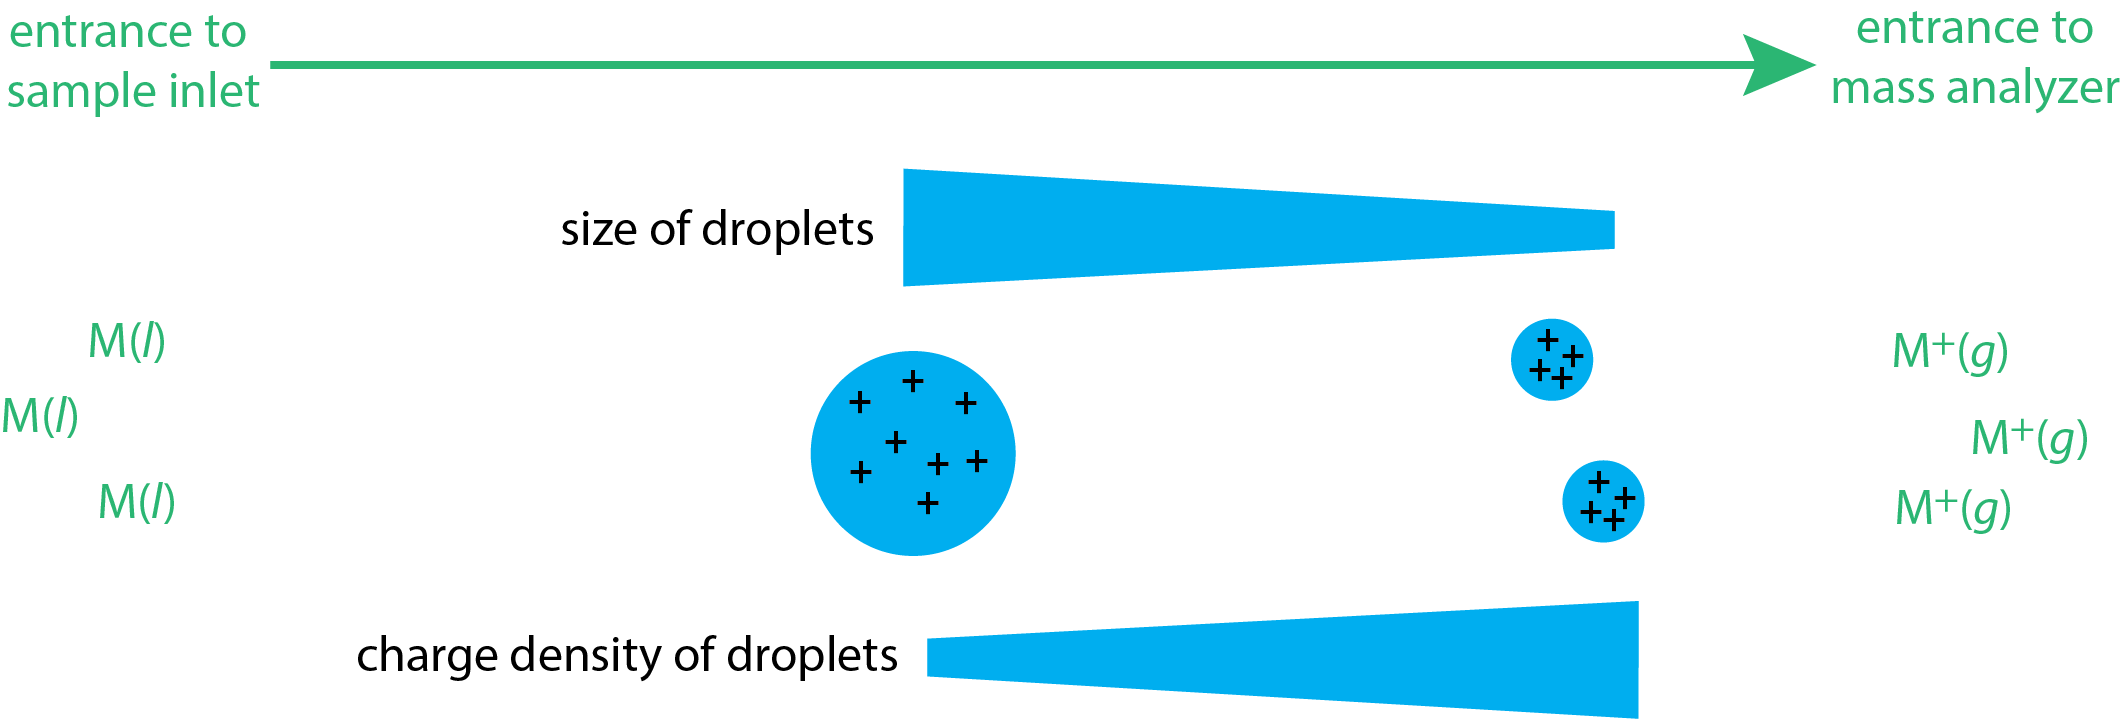
Electron impact and chemical ionization are gas phase sources because the sample is volatilized before it enters the mass spectrometer's inlet. In electrospray ionization (ESI), the sample is a liquid and ions desorb from that matrix in the mass spectrometer's inlet system. The liquid sample is pulled into the spectrometer's inlet through a capillary needle, forming a mist of droplets. The application of a large potential across this inlet assures that the droplets carry positive charges. These charged droplets then enter a chamber where they undergo desolvation, which decreases the size of the droplet and increases their charge density (see Figure \(\PageIndex{4}\)). As this charge density increases, the droplets eventually become unstable, for reasons that are not fully understood, and ionized gas-phase ions desorb from the droplets and enter into the mass analyzer.
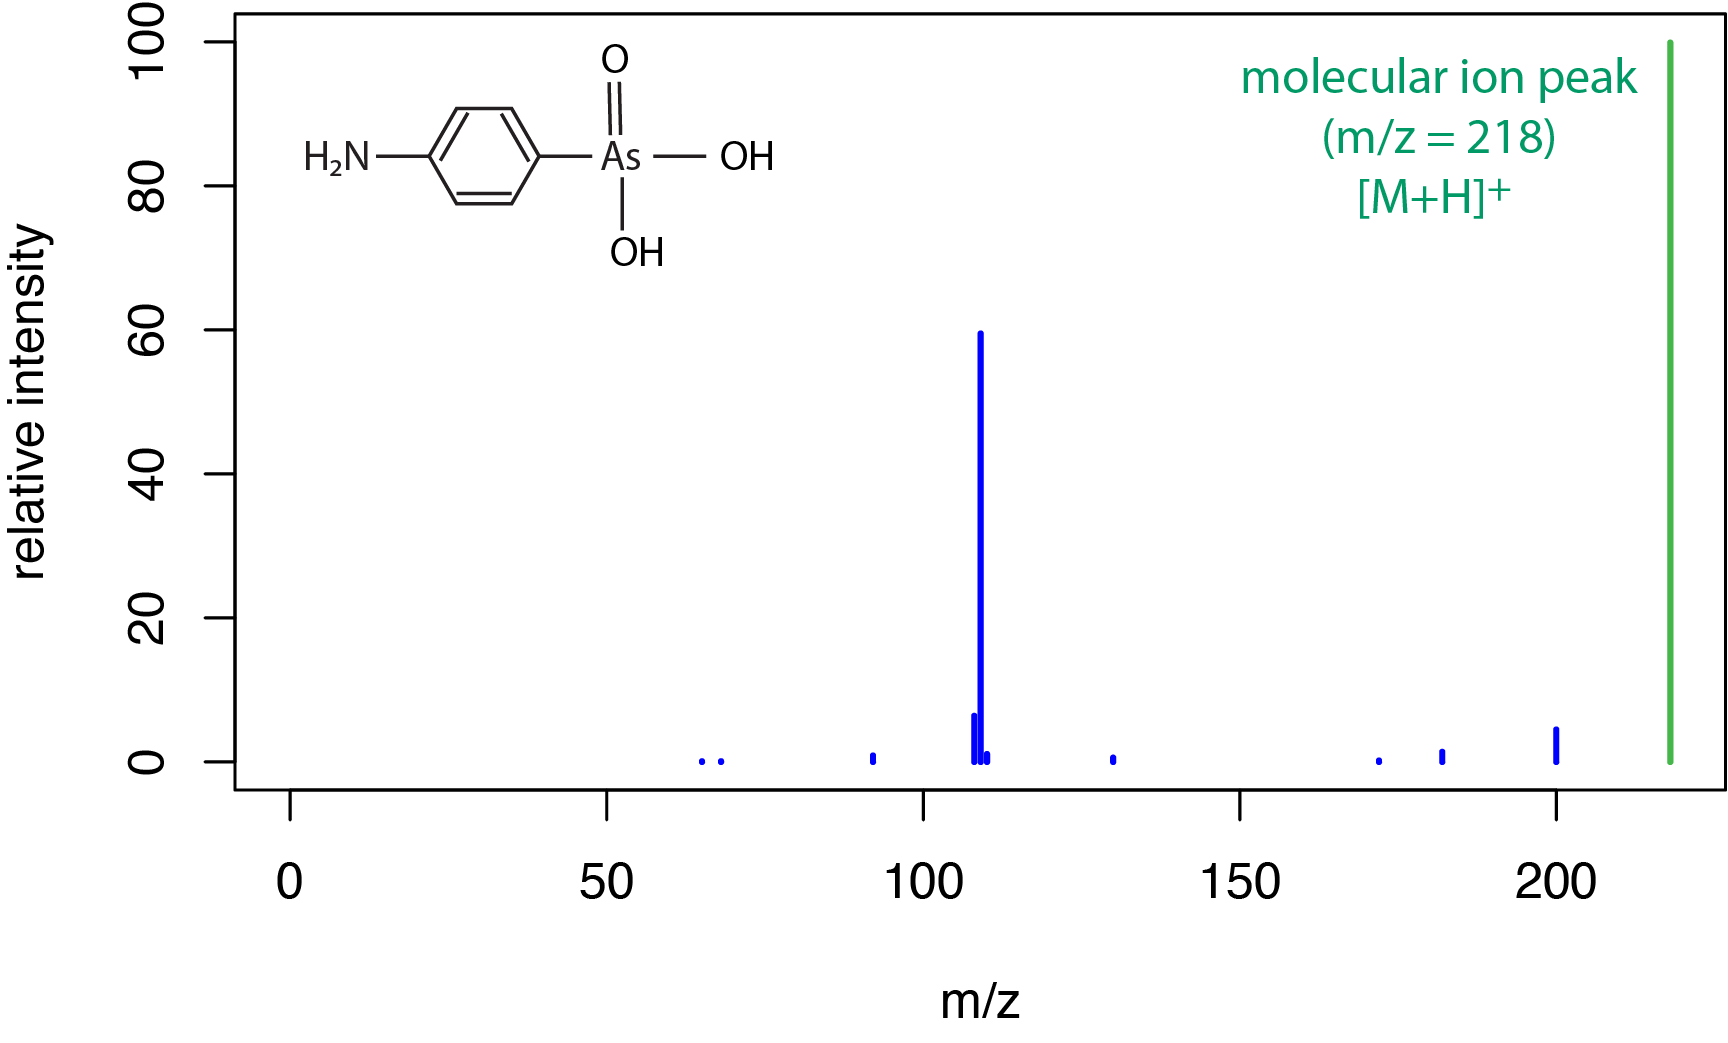
A typical electrospray ionization mass spectrum for a small molecule is shown in Figure \(\PageIndex{5}\) for the compound (4-aminophenyl)arsonic acid. As we saw in Figure \(\PageIndex{3}\) for chemical ionization, a soft ionization source results in a limited amount of fragmentation and a strong peak for the molecular ion, which here includes a proton transfer to give the [M + H]+ peak at a m/z of 218 amu.
Electrospray ionization is particularly useful for biological molecules, such as peptides and proteins, because the soft ionization ensures that molecular weight information is retained. Because these molecules are large, they readily pick up multiple protons, forming multiply charged ions of the general form [M + zH]z+ where z is the number of protons added. Figure \(\PageIndex{6}\) shows a hypothetical spectrum for the molecule M and Table \(\PageIndex{1}\) provides the corresponding m/z values for the mass spectrum's peaks.
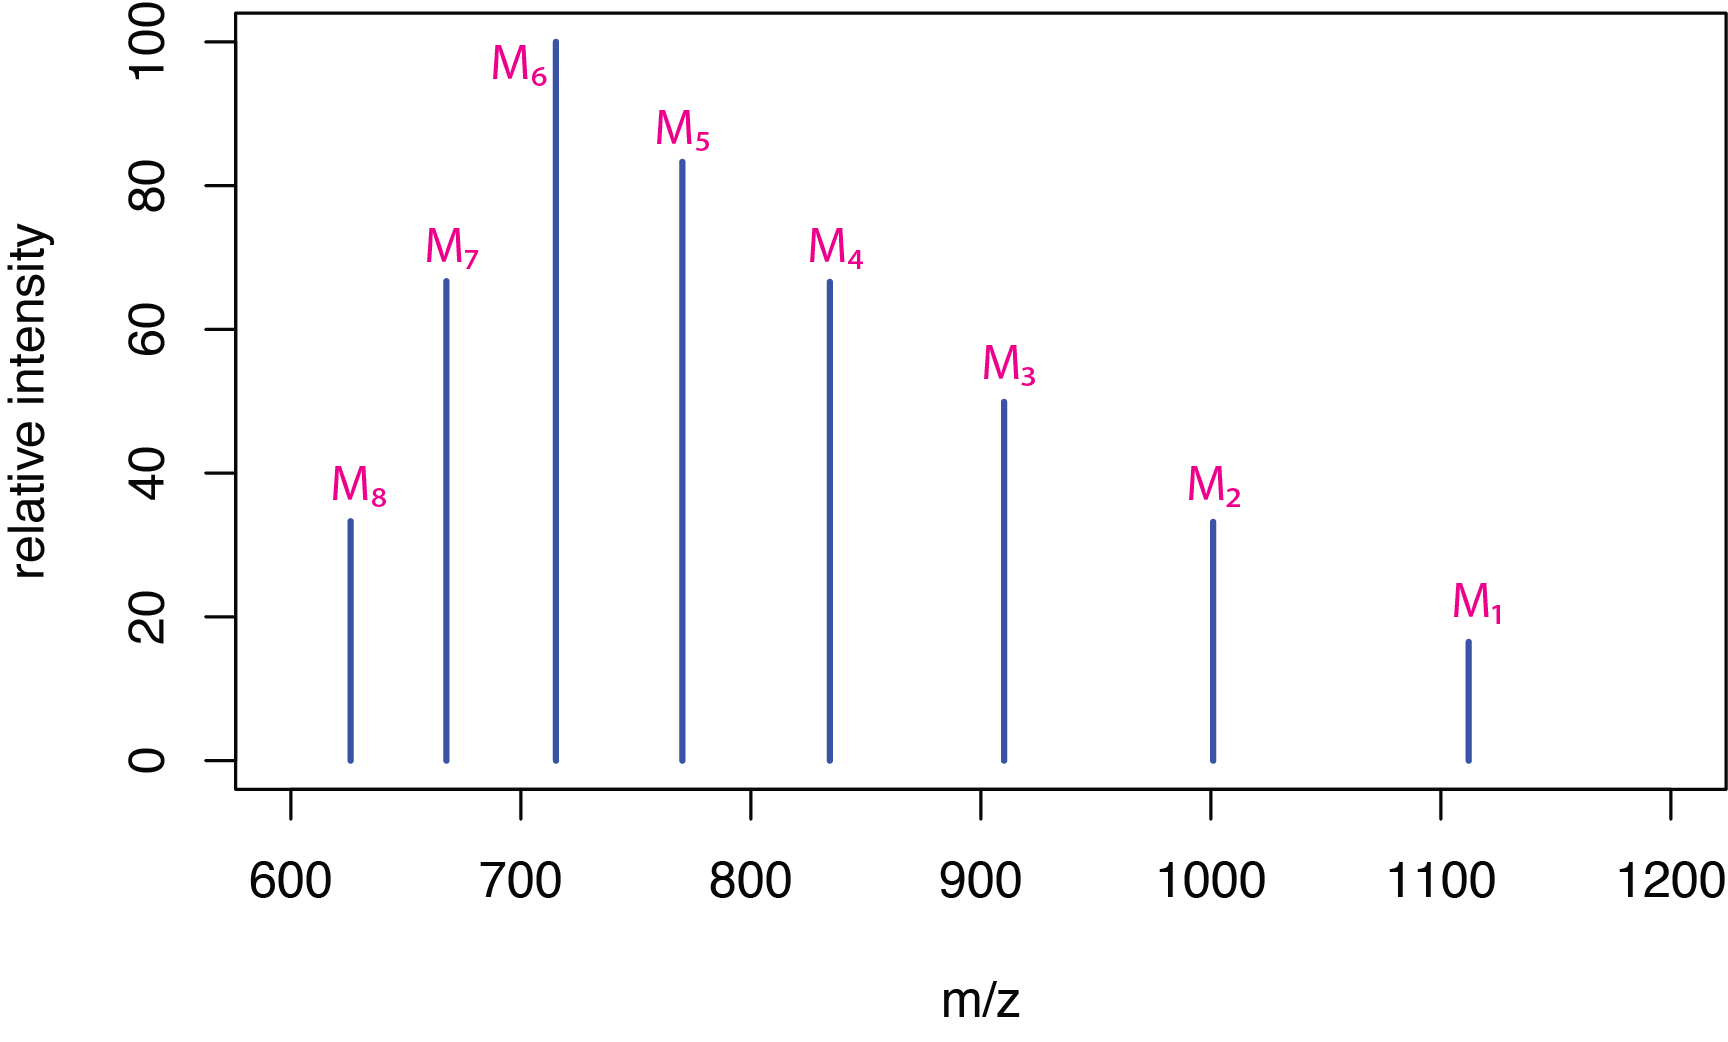
| peak | m/z |
|---|---|
| M1 | 1112 |
| M2 | 1001 |
| M3 | 910 |
| M4 | 834 |
| M5 | 770 |
| M6 | 715 |
| M7 | 667 |
| M8 | 626 |
If we take the mass-to-charge ratios for any two adjacent peaks, \(M_i\) and \(M_j\), where the peak \(M_i\) has the greater value for m/z, and if we assume that \(M_j\) has one additional hydrogen atom, giving it a charge that is one unit higher, then
\[Z_i = \frac{M_j - 1}{M_i - M_j} \label{findz} \]
where \(Z_i\) is the charge on the ion \(M_i\). Table \(\PageIndex{2}\) shows the calculated charges for the ions \(M_1\) to \(M_7\).
Here is a derivation for Equation \ref{findz}. Suppose the molecule of interest has a molecular weight of \(m\). If the charge on the ion responsible for peak \(M_i\) is \(Z\), then it must be the case that the peak's mass is equal to m + Z as it has Z extra hydrogens and it must be the case that its mass-to-charge ratio is
\[M_i = \frac{m + Z}{Z} \nonumber \]
and its molecular weight, \(m\), is
\[m = (M_i \times Z) - Z \nonumber \]
In the same way, the peak \(M_j\) has a charge of \(Z + 1\) and
\[M_j = \frac{m + Z + 1}{Z + 1} \nonumber \]
\[m = (M_j \times Z )+ M_j - Z - 1 \nonumber \]
Setting the two equations for \(m\) equal to each other and solving for \(Z\) gives
\[(M_i \times Z) - Z = (M_j \times Z) + M_j - Z - 1 \nonumber \]
\[(M_i \times Z) = (M_j \times Z) + M_j - 1 \nonumber \]
\[(M_i \times Z) - (M_j \times Z) = M_j - 1 \nonumber \]
\[Z = \frac{M_j - 1}{M_i - M_j} \nonumber \]
| peak | m/z | Z |
|---|---|---|
| M1 | 1112 | 9 |
| M2 | 1001 | 10 |
| M3 | 910 | 11 |
| M4 | 834 | 12 |
| M5 | 770 | 13 |
| M6 | 715 | 14 |
| M7 | 667 | 15 |
| M8 | 626 | — |
The molecular weight, \(m\), is given by the equation
\[m = (M_i \times Z) - Z \label{findmw} \]
Table \(\PageIndex{3}\) shows the molecular weights for the ions \(M_1\) to \(M_7\) and their average value. The simulated mass spectrum was created by setting the molecular weight to 10,000 amu and with charges ranging from +9 to +16.
| peak | m/z | Z | \(m\) |
|---|---|---|---|
| M1 | 1112 | 9 | 9,999 |
| M2 | 1001 | 10 | 10,000 |
| M3 | 910 | 11 | 9,999 |
| M4 | 834 | 12 | 9,996 |
| M5 | 770 | 13 | 9,997 |
| M6 | 715 | 14 | 9,996 |
| M7 | 667 | 15 | 10,005 |
| M8 | 626 | — | — |
| average molecular weight | 9,999 | ||
Matrix-Assisted Laser Desorption/Ionization Sources (solid phase/soft source)
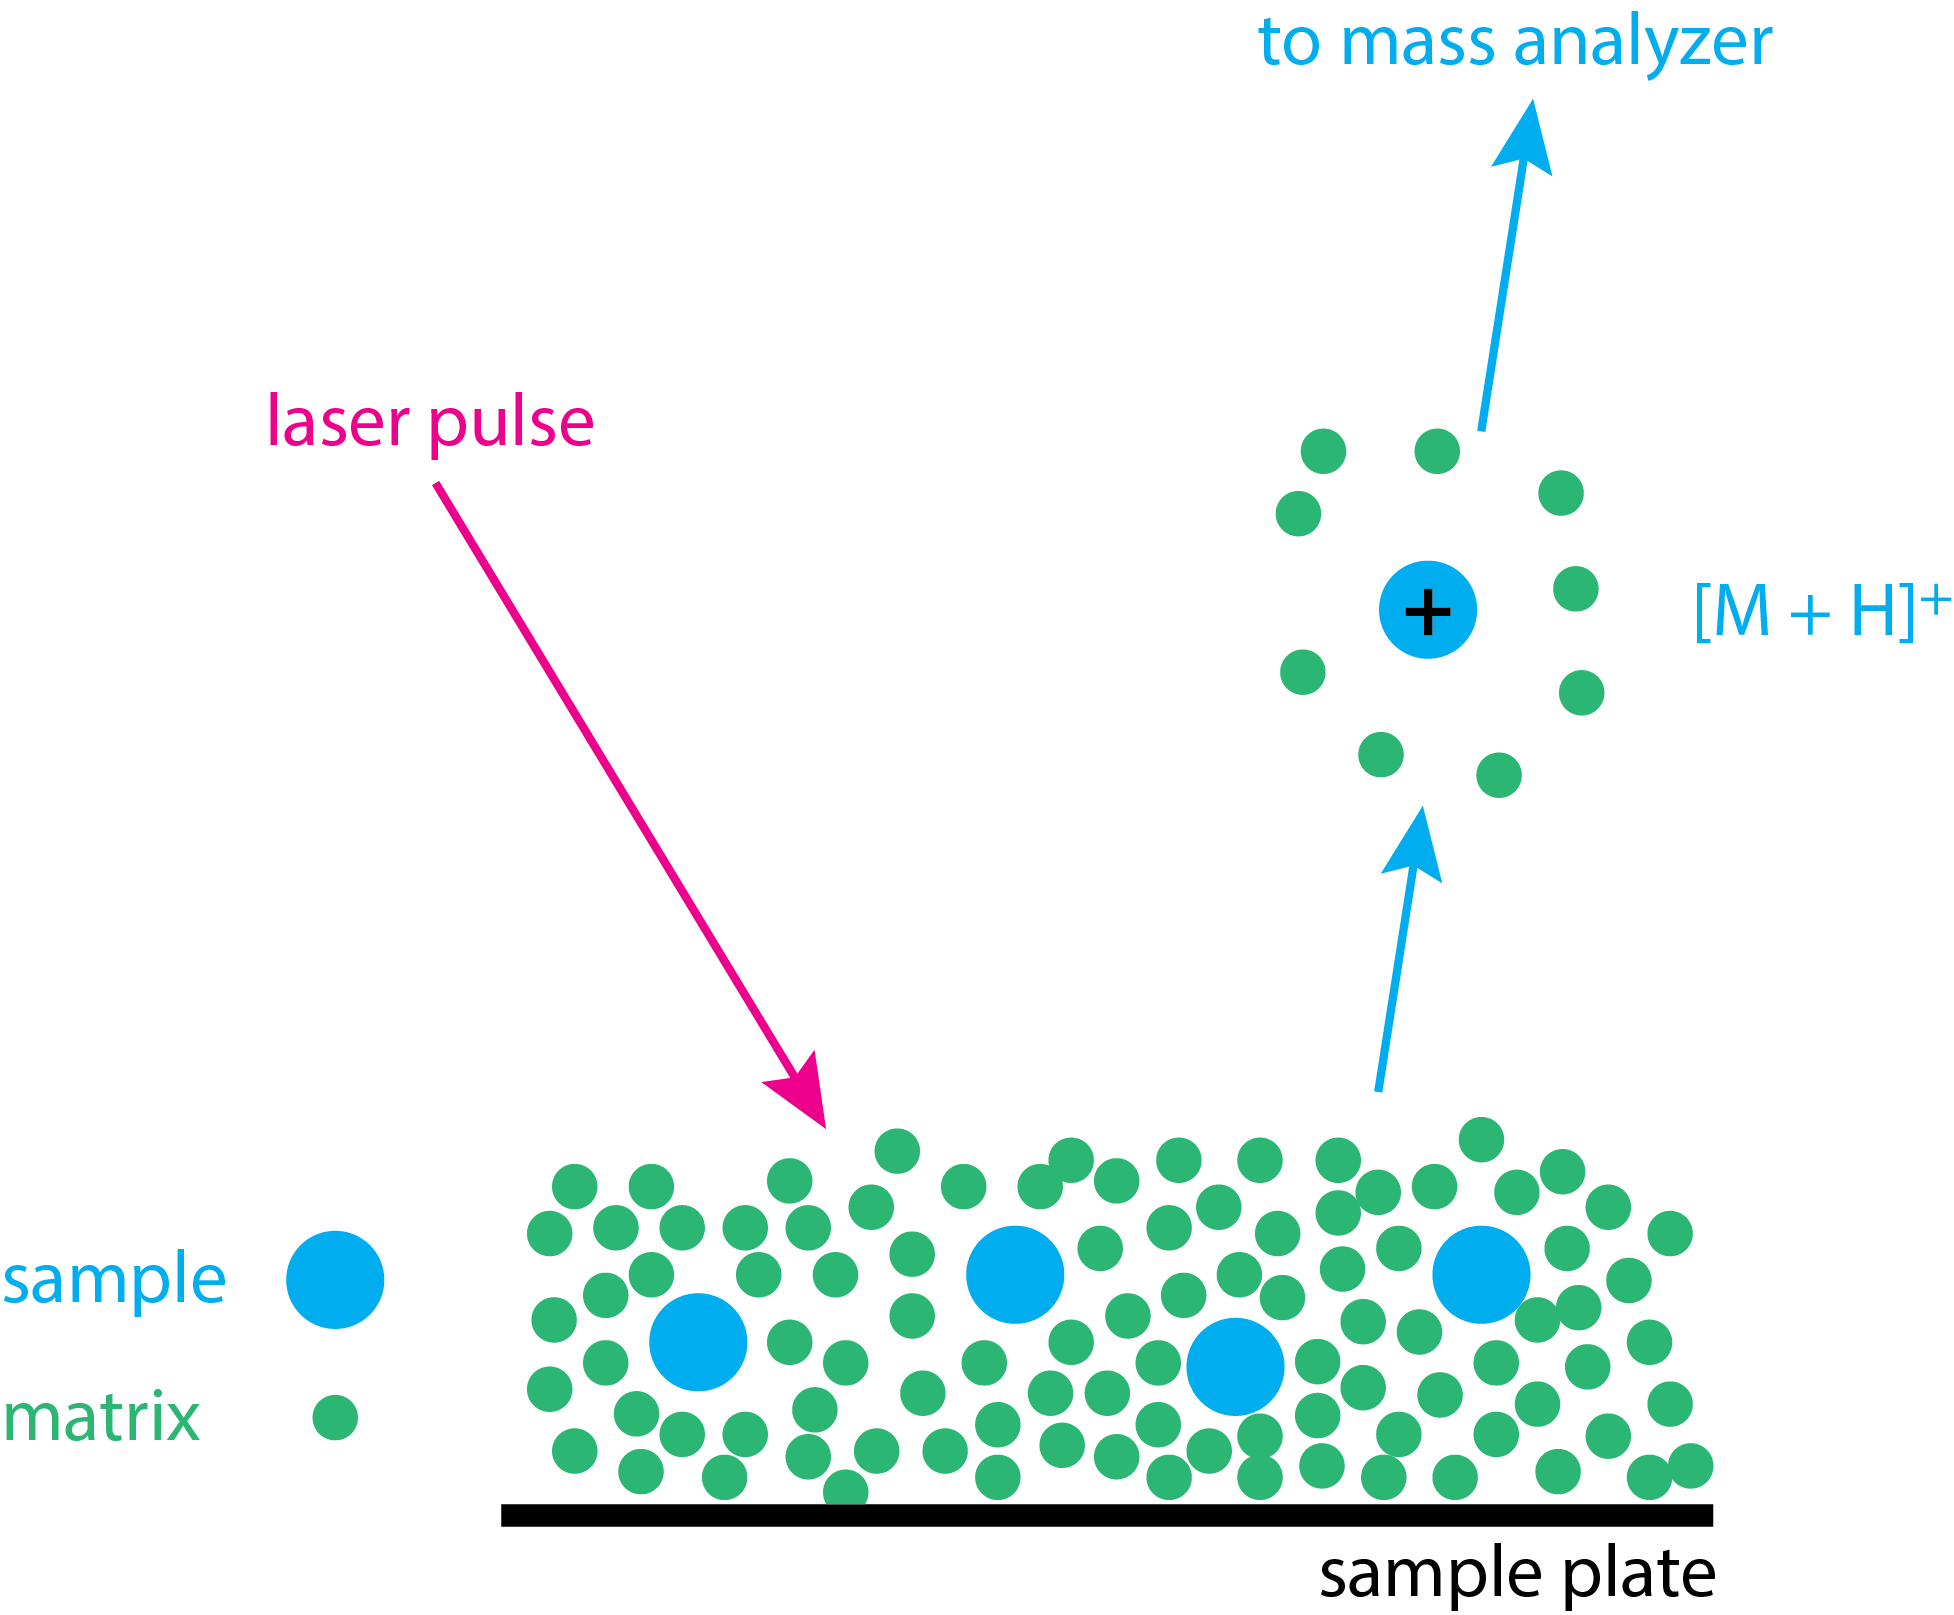
Matrix-assisted laser desorption ionization (MALDI) is a soft ionization source for obtaining the mass spectrum for biologically important molecules, such as proteins and peptides. Figure \(\PageIndex{7}\) illustrates the basic steps in obtaining a MALDI spectrum. The sample is first mixed with a small molecule—which is called the matrix—to form a solution; the matrix usually is present in a 10:1 ratio. A drop of this mixture is placed on a sample probe and allowed to dry, leaving the sample in a solid form. A pulsed laser beam (\(\lambda = 237\) nm is typical) is focused on the solid sample–matrix mixture. The matrix absorbs the laser pulse and the absorption of the laser's energy volatilizes both the matrix and the sample. Ionization of the sample forms molecular ions, usually [M + H]+ ions, which are then swept into the mass analyzer.
When the sample is a digestion of a protein, then it is a mixture of peptides, each of which appeara as a [M + H]+ peak in the resulting mass spectrum. For example, a peptide with the sequence AWSVAR (alanine–tryptophan–serine–valine–alanine–arginine) will appear as a peak with a mass of 689.8 daltons. To find this value we add together the molecular weights of the amino acids, account for the loss of a molecule of water for each peptide bond that forms, and then account for the hydrogen that gives the [M + H]+ ion. In this case we have
\[ \ce{[M + H]^+} = 89.1 + 204.2 + 105.1 + 117.1 + 89.1 + 174.2 - (5 \times 18.0) + 1 = 689.8 \text{ amu} \nonumber \]
where the term \(5 \times 18.0\) accounts for the loss of five molecules of \(\ce{H2O}\) when forming the five peptide bonds.
Fast Atom Bombardment Sources (liquid phase/soft source)
Fast atom bombardment (FAB) bears some similarity to MALDI: the sample is mixed with a liquid matrix (often glycerol) and bombarded with a beam of xenon or argon atoms (instead of a laser). Desorption of the sample from its matrix forms gas phase ions that are swept into the mass analyzer. Spectra usually contain both a molecular ion and fragmentation patterns.