
19.6: Two-Dimensional Fourier Transform NMR
- Page ID
- 397296

\( \newcommand{\vecs}[1]{\overset { \scriptstyle \rightharpoonup} {\mathbf{#1}} } \)
\( \newcommand{\vecd}[1]{\overset{-\!-\!\rightharpoonup}{\vphantom{a}\smash {#1}}} \)
\( \newcommand{\dsum}{\displaystyle\sum\limits} \)
\( \newcommand{\dint}{\displaystyle\int\limits} \)
\( \newcommand{\dlim}{\displaystyle\lim\limits} \)
\( \newcommand{\id}{\mathrm{id}}\) \( \newcommand{\Span}{\mathrm{span}}\)
( \newcommand{\kernel}{\mathrm{null}\,}\) \( \newcommand{\range}{\mathrm{range}\,}\)
\( \newcommand{\RealPart}{\mathrm{Re}}\) \( \newcommand{\ImaginaryPart}{\mathrm{Im}}\)
\( \newcommand{\Argument}{\mathrm{Arg}}\) \( \newcommand{\norm}[1]{\| #1 \|}\)
\( \newcommand{\inner}[2]{\langle #1, #2 \rangle}\)
\( \newcommand{\Span}{\mathrm{span}}\)
\( \newcommand{\id}{\mathrm{id}}\)
\( \newcommand{\Span}{\mathrm{span}}\)
\( \newcommand{\kernel}{\mathrm{null}\,}\)
\( \newcommand{\range}{\mathrm{range}\,}\)
\( \newcommand{\RealPart}{\mathrm{Re}}\)
\( \newcommand{\ImaginaryPart}{\mathrm{Im}}\)
\( \newcommand{\Argument}{\mathrm{Arg}}\)
\( \newcommand{\norm}[1]{\| #1 \|}\)
\( \newcommand{\inner}[2]{\langle #1, #2 \rangle}\)
\( \newcommand{\Span}{\mathrm{span}}\) \( \newcommand{\AA}{\unicode[.8,0]{x212B}}\)
\( \newcommand{\vectorA}[1]{\vec{#1}} % arrow\)
\( \newcommand{\vectorAt}[1]{\vec{\text{#1}}} % arrow\)
\( \newcommand{\vectorB}[1]{\overset { \scriptstyle \rightharpoonup} {\mathbf{#1}} } \)
\( \newcommand{\vectorC}[1]{\textbf{#1}} \)
\( \newcommand{\vectorD}[1]{\overrightarrow{#1}} \)
\( \newcommand{\vectorDt}[1]{\overrightarrow{\text{#1}}} \)
\( \newcommand{\vectE}[1]{\overset{-\!-\!\rightharpoonup}{\vphantom{a}\smash{\mathbf {#1}}}} \)
\( \newcommand{\vecs}[1]{\overset { \scriptstyle \rightharpoonup} {\mathbf{#1}} } \)
\(\newcommand{\longvect}{\overrightarrow}\)
\( \newcommand{\vecd}[1]{\overset{-\!-\!\rightharpoonup}{\vphantom{a}\smash {#1}}} \)
\(\newcommand{\avec}{\mathbf a}\) \(\newcommand{\bvec}{\mathbf b}\) \(\newcommand{\cvec}{\mathbf c}\) \(\newcommand{\dvec}{\mathbf d}\) \(\newcommand{\dtil}{\widetilde{\mathbf d}}\) \(\newcommand{\evec}{\mathbf e}\) \(\newcommand{\fvec}{\mathbf f}\) \(\newcommand{\nvec}{\mathbf n}\) \(\newcommand{\pvec}{\mathbf p}\) \(\newcommand{\qvec}{\mathbf q}\) \(\newcommand{\svec}{\mathbf s}\) \(\newcommand{\tvec}{\mathbf t}\) \(\newcommand{\uvec}{\mathbf u}\) \(\newcommand{\vvec}{\mathbf v}\) \(\newcommand{\wvec}{\mathbf w}\) \(\newcommand{\xvec}{\mathbf x}\) \(\newcommand{\yvec}{\mathbf y}\) \(\newcommand{\zvec}{\mathbf z}\) \(\newcommand{\rvec}{\mathbf r}\) \(\newcommand{\mvec}{\mathbf m}\) \(\newcommand{\zerovec}{\mathbf 0}\) \(\newcommand{\onevec}{\mathbf 1}\) \(\newcommand{\real}{\mathbb R}\) \(\newcommand{\twovec}[2]{\left[\begin{array}{r}#1 \\ #2 \end{array}\right]}\) \(\newcommand{\ctwovec}[2]{\left[\begin{array}{c}#1 \\ #2 \end{array}\right]}\) \(\newcommand{\threevec}[3]{\left[\begin{array}{r}#1 \\ #2 \\ #3 \end{array}\right]}\) \(\newcommand{\cthreevec}[3]{\left[\begin{array}{c}#1 \\ #2 \\ #3 \end{array}\right]}\) \(\newcommand{\fourvec}[4]{\left[\begin{array}{r}#1 \\ #2 \\ #3 \\ #4 \end{array}\right]}\) \(\newcommand{\cfourvec}[4]{\left[\begin{array}{c}#1 \\ #2 \\ #3 \\ #4 \end{array}\right]}\) \(\newcommand{\fivevec}[5]{\left[\begin{array}{r}#1 \\ #2 \\ #3 \\ #4 \\ #5 \\ \end{array}\right]}\) \(\newcommand{\cfivevec}[5]{\left[\begin{array}{c}#1 \\ #2 \\ #3 \\ #4 \\ #5 \\ \end{array}\right]}\) \(\newcommand{\mattwo}[4]{\left[\begin{array}{rr}#1 \amp #2 \\ #3 \amp #4 \\ \end{array}\right]}\) \(\newcommand{\laspan}[1]{\text{Span}\{#1\}}\) \(\newcommand{\bcal}{\cal B}\) \(\newcommand{\ccal}{\cal C}\) \(\newcommand{\scal}{\cal S}\) \(\newcommand{\wcal}{\cal W}\) \(\newcommand{\ecal}{\cal E}\) \(\newcommand{\coords}[2]{\left\{#1\right\}_{#2}}\) \(\newcommand{\gray}[1]{\color{gray}{#1}}\) \(\newcommand{\lgray}[1]{\color{lightgray}{#1}}\) \(\newcommand{\rank}{\operatorname{rank}}\) \(\newcommand{\row}{\text{Row}}\) \(\newcommand{\col}{\text{Col}}\) \(\renewcommand{\row}{\text{Row}}\) \(\newcommand{\nul}{\text{Nul}}\) \(\newcommand{\var}{\text{Var}}\) \(\newcommand{\corr}{\text{corr}}\) \(\newcommand{\len}[1]{\left|#1\right|}\) \(\newcommand{\bbar}{\overline{\bvec}}\) \(\newcommand{\bhat}{\widehat{\bvec}}\) \(\newcommand{\bperp}{\bvec^\perp}\) \(\newcommand{\xhat}{\widehat{\xvec}}\) \(\newcommand{\vhat}{\widehat{\vvec}}\) \(\newcommand{\uhat}{\widehat{\uvec}}\) \(\newcommand{\what}{\widehat{\wvec}}\) \(\newcommand{\Sighat}{\widehat{\Sigma}}\) \(\newcommand{\lt}{<}\) \(\newcommand{\gt}{>}\) \(\newcommand{\amp}{&}\) \(\definecolor{fillinmathshade}{gray}{0.9}\)The 1H and 13C spectra up to this point are shown in one dimension (1D), which is the frequency absorbed by the analyte's nuclei expressed in ppm. These spectra were acquired by applying a brief RF pulse to the sample, recording the resulting FID, and then using a Fourier transform to obtain the NMR spectrum. In addition to 1D experiments, there are a host of 2D experiments in which we apply a sequence of two or more pulses, recording the resulting FID after applying the last pulse. In this section we will consider one example of a 2D NMR experiment in some detail: 1H – 1H correlation spectroscopy, or 1H – 1H COSY.
Figure \(\PageIndex{1}\) shows the basic experimental details for the COSY experiment. The pulse train is shown in (a) and consists of a first pulse that is followed by a delay time, \(t_1\), in which the nuclear spins are allowed to precess and relax. This is followed by the application of a second pulse and the measurement of the resulting FID during the acquisition period, \(t_2\), that consists of \(n_{t_2}\) individual data points. The COSY experiment consists of a sequence of \(n_{t_1}\) individual pulse trains, each with a different \(t_1\). The result (b) is a matrix with \(n_{t_1}\) rows and \(n_{t_2}\) columns. To process the data, each row in this matrix is Fourier transformed, the resulting \(n_{t_1} \times n_{t_2}\) matrix is transposed to a \(n_{t_2} \times n_{t_1}\) matrix and then Fourier transformed again to give (c) a \(n_{t_2} \times n_{t_2}\) matrix that shows the intensity of the signal for all possible combinations of applied frequencies.
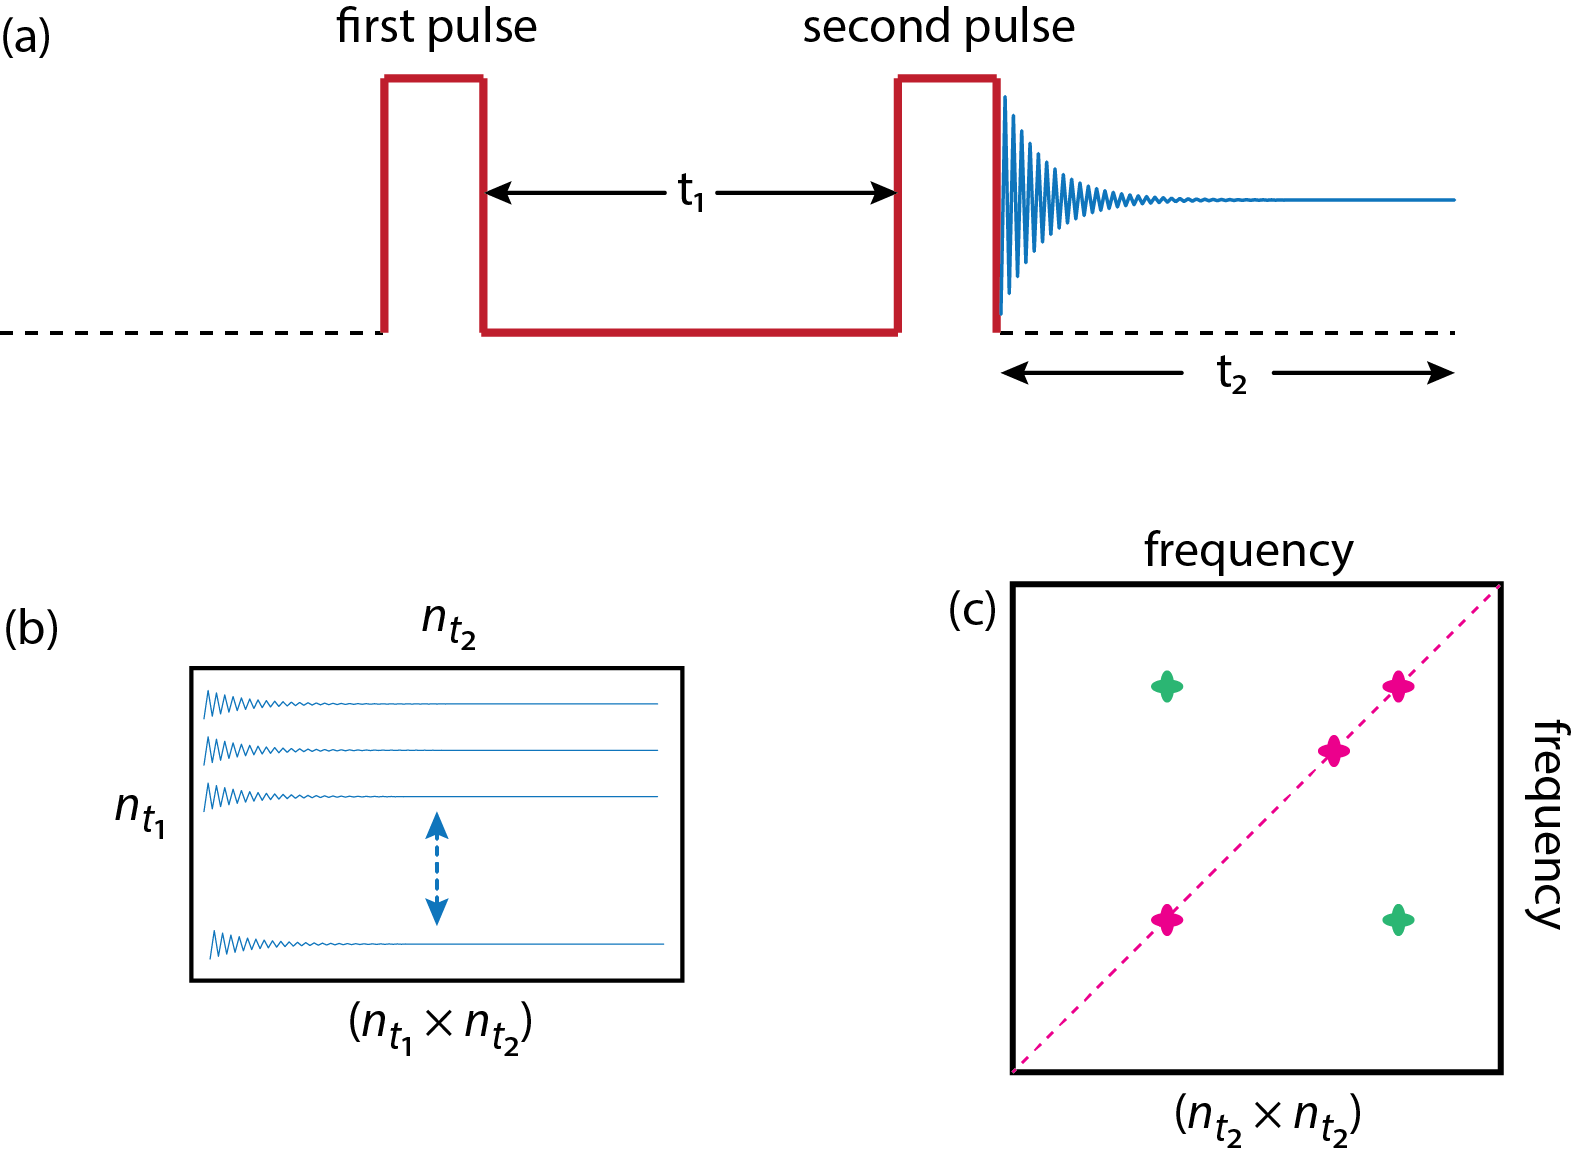
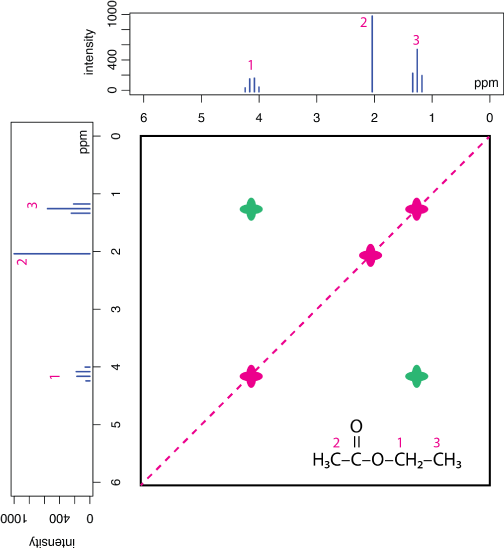
Figure \(\PageIndex{2}\) shows the 1H – 1H COSY spectrum for ethyl acetate. Instead of just annotating the two axes with numerical values of the frequencies, they are displayed by superimposing the 1D 1H NMR spectrum for ethyl acetate in ppm. The points that fall on the diagonal line are just the three frequencies where ethyl acetate has 1H peaks. Of more interest are the points that fall on either side of the diagonal line—these are called cross peaks—as these show pairs of hydrogens that are coupled (or correlated) to each other. The cross peaks in the COSY spectrum are symmetrical about the diagonal line and show the correlation between the hydrogens on the methyl carbon and and the methylene carbon that are adjacent to each other (the ethyl part of ethyl acetate). The remaining methyl group is not coupled to the other hydrogen's in the ethyl acetate, so there is no cross peak at the intersection of \(\delta = 2.038 \text{ ppm}\) and \(\delta = 1.260 \text{ ppm}\). The information about coupling from cross peaks assists in interpreting complex 1H NMR spectra.
COSY is one example of a homonuclear 2D NMR experiment because it examines coupling between identical nuclei, such as 1H in Figure \(\PageIndex{2}\). There are many other 2D NMR experiments, each of which uses a sequence of pulses—some that use two pulses, as in COSY, and others that use three or more pulses—and a data analysis algorithm. Table \(\PageIndex{1}\) provides details on some of these methods.
| method | information obtained from cross peaks |
|---|---|
| correlation spectroscopy (COSY) | coupling between two protons (1H – 1H) that are within three chemical bonds of each other |
| total correlation spectroscopy (TOCSY) | coupling between all protons (1H) in the molecule |
| heteronuclear correlation spectroscopy (HETCOR) | coupling between a proton (1H) and another nucleus, such as carbon (1H – 13C) or nitrogen (1H – 15N) |
| nuclear overhauser and exchange spectroscopy (NOESY) | coupling between two protons (1H – 1H) that are within approximately 5 Å of each other |
| heteronuclear single quantum correlation (HSQC) | coupling between a proton (1H) and another nucleus, such as carbon (1H – 13C) or nitrogen (1H – 15N) |
| heteronuclear multiple bond coherence spectroscopy (HMBC) | coupling between a proton and a carbon (1H – 13C) that are two or three bonds apart |
| incredible natural abundance double-quantum transfer (INADEQUATE) | coupling between adjacent carbon atoms (13C – 13C) |
| double quantum filtered correlation spectroscopy (DQF–COSY) | suppresses signals from water |