

Gas Chromatographic Columns
- Page ID
- 284024

\( \newcommand{\vecs}[1]{\overset { \scriptstyle \rightharpoonup} {\mathbf{#1}} } \)
\( \newcommand{\vecd}[1]{\overset{-\!-\!\rightharpoonup}{\vphantom{a}\smash {#1}}} \)
\( \newcommand{\dsum}{\displaystyle\sum\limits} \)
\( \newcommand{\dint}{\displaystyle\int\limits} \)
\( \newcommand{\dlim}{\displaystyle\lim\limits} \)
\( \newcommand{\id}{\mathrm{id}}\) \( \newcommand{\Span}{\mathrm{span}}\)
( \newcommand{\kernel}{\mathrm{null}\,}\) \( \newcommand{\range}{\mathrm{range}\,}\)
\( \newcommand{\RealPart}{\mathrm{Re}}\) \( \newcommand{\ImaginaryPart}{\mathrm{Im}}\)
\( \newcommand{\Argument}{\mathrm{Arg}}\) \( \newcommand{\norm}[1]{\| #1 \|}\)
\( \newcommand{\inner}[2]{\langle #1, #2 \rangle}\)
\( \newcommand{\Span}{\mathrm{span}}\)
\( \newcommand{\id}{\mathrm{id}}\)
\( \newcommand{\Span}{\mathrm{span}}\)
\( \newcommand{\kernel}{\mathrm{null}\,}\)
\( \newcommand{\range}{\mathrm{range}\,}\)
\( \newcommand{\RealPart}{\mathrm{Re}}\)
\( \newcommand{\ImaginaryPart}{\mathrm{Im}}\)
\( \newcommand{\Argument}{\mathrm{Arg}}\)
\( \newcommand{\norm}[1]{\| #1 \|}\)
\( \newcommand{\inner}[2]{\langle #1, #2 \rangle}\)
\( \newcommand{\Span}{\mathrm{span}}\) \( \newcommand{\AA}{\unicode[.8,0]{x212B}}\)
\( \newcommand{\vectorA}[1]{\vec{#1}} % arrow\)
\( \newcommand{\vectorAt}[1]{\vec{\text{#1}}} % arrow\)
\( \newcommand{\vectorB}[1]{\overset { \scriptstyle \rightharpoonup} {\mathbf{#1}} } \)
\( \newcommand{\vectorC}[1]{\textbf{#1}} \)
\( \newcommand{\vectorD}[1]{\overrightarrow{#1}} \)
\( \newcommand{\vectorDt}[1]{\overrightarrow{\text{#1}}} \)
\( \newcommand{\vectE}[1]{\overset{-\!-\!\rightharpoonup}{\vphantom{a}\smash{\mathbf {#1}}}} \)
\( \newcommand{\vecs}[1]{\overset { \scriptstyle \rightharpoonup} {\mathbf{#1}} } \)
\(\newcommand{\longvect}{\overrightarrow}\)
\( \newcommand{\vecd}[1]{\overset{-\!-\!\rightharpoonup}{\vphantom{a}\smash {#1}}} \)
\(\newcommand{\ket}[1]{\left| #1 \right>}\)
\(\newcommand{\bra}[1]{\left< #1 \right|}\)
\(\newcommand{\braket}[2]{\left< #1 \vphantom{#2} \right| \left. #2 \vphantom{#1} \right>}\)
\(\newcommand{\braopket}[3]{\left< #1 \vphantom{#2}\vphantom{#3} \right| #2 \vphantom{#1}\vphantom{#3} \left| #3 \vphantom{#1}\vphantom{#2} \right>}\)
\(\newcommand{\qmvec}[1]{\mathbf{\vec{#1}}}\)
\(\newcommand{\op}[1]{\hat{\mathbf{#1}}}\)
\(\newcommand{\expect}[1]{\langle #1 \rangle}\)
\(\newcommand{\dfn}[1]{\emph{\textbf{#1}}}\)
Learning Objectives
All students are expected to:
- Differentiate different types of columns (i.e., WCOT, PLOT, packed), their dimensions, applicability and diffusion factors affecting the separation
- Evaluate suitability of common stationary phases for different analytes
- Distinguish types of interactions between the analytes and stationary phase
- Justify the selection of a stationary phase based on its interactions, stability, and bleed with the targeted analyte
- Evaluate and explain the column bleed
Quiz GC Columns
Provide handwritten answers and bring them to the class
- Compare capillary and packed columns, their dimensions, the common number of theoretical plates, and factors affecting peak broadening.
- Explain the principle and strength of dispersive interactions (London forces), dipole-dipole interactions, hydrogen bonding.
- Differentiate stationary phases and discuss their relationship to the interactions with analytes.
- What is the difference in the interactions with analytes on methyl and phenyl dimethyl polysiloxane stationary phases?
- A homological series of alkanes is analyzed using a linear temperature gradient. What defines the elution order? How does Δtr change for sequentially eluting compounds?
- What are PLOT columns and how are they used?
- What is the column bleed?
- In GC analysis, what is the source of an ion of 207 m/z?
A. Stationary Phases and Integrations in GC
- Match a suitable stationary phase to the following analytes
Heptane C7H16

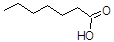
Heptanoic Acid C7H14O2
Glycerol C3H8O3

Nitrobenzene C6H5NO2

Acetic Acid C2H4O2

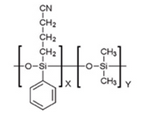
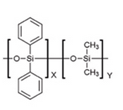

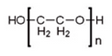
- List the types of interactions expected between the analytes and stationary phases selected above.
- Which of the stationary phases above would be suitable specifically for GC-MS analysis?
- Which of these stationary phases is the least thermally stable?
B. Separation on PLOT columns
- What are PLOT columns? Please sketch.
- Which of the analytes listed below would be separated on a PLOT column?
- Organic solvents
- Polycyclic aromatic hydrocarbons
- Refinery gases
- Air
- Fatty acids
- Which analytes (of those listed above) would not be suitable for a PLOT column and why?
- Sketch two chromatograms of air on an alumina PLOT column with retention H2< O2 < N2, CO2 using a column with stationary phases of 0.1 µm and 5.0 µm film thickness.
- Would you expect to have longer or shorter retention times on a thicker stationary phase and why?
- How fast would be the elution of the analytes listed above?
- Based on the points 5 and 6 reconsider your chromatograms.
- Would it better work with higher or lower flowrates (Consider Van Deemter theory)
C. GC Analysis and Column Bleed
- Sketch a chromatogram of a solvent (hexane) analyzed using the temperature program from 40 °C to 320 °C with a 25 °C/min gradient.
- What is the column bleed? Consider whether it would affect the sketched chromatogram above?
- Sketch three chromatograms and label all peaks of a series of alkanes (C7-C15) dissolved in n-hexane on a dimethyl polysiloxane stationary phase analyzed using a split injection and
- An Isothermal analysis at 200 °C.
- A temperature program from 40 °C to 320 °C with a 5 °C/min gradient.
- A temperature program from 100 °C to 320 °C with a 5 °C/min gradient.
- Do you expect any co-elution? Why?
D. Optimizing Temperature Program
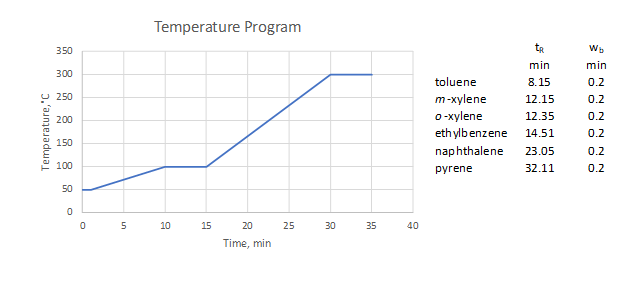
- The temperature program and analytes elution profile are shown above. How could you modify the temperature program to improve the analysis?
- Determine temperatures at which each analyte eluted in the temperature program used above.
- Is your program shorter or longer than the original?
- Based on questions 2 and 3, reconsider the proposed program and suggest a new one.
Contributors and Attributions
- Alena Kubatova, University of North Dakota (alena.kubatova@und.edu)
- Sourced from the Analytical Sciences Digital Library