
Statistics
- Page ID
- 279200

\( \newcommand{\vecs}[1]{\overset { \scriptstyle \rightharpoonup} {\mathbf{#1}} } \)
\( \newcommand{\vecd}[1]{\overset{-\!-\!\rightharpoonup}{\vphantom{a}\smash {#1}}} \)
\( \newcommand{\dsum}{\displaystyle\sum\limits} \)
\( \newcommand{\dint}{\displaystyle\int\limits} \)
\( \newcommand{\dlim}{\displaystyle\lim\limits} \)
\( \newcommand{\id}{\mathrm{id}}\) \( \newcommand{\Span}{\mathrm{span}}\)
( \newcommand{\kernel}{\mathrm{null}\,}\) \( \newcommand{\range}{\mathrm{range}\,}\)
\( \newcommand{\RealPart}{\mathrm{Re}}\) \( \newcommand{\ImaginaryPart}{\mathrm{Im}}\)
\( \newcommand{\Argument}{\mathrm{Arg}}\) \( \newcommand{\norm}[1]{\| #1 \|}\)
\( \newcommand{\inner}[2]{\langle #1, #2 \rangle}\)
\( \newcommand{\Span}{\mathrm{span}}\)
\( \newcommand{\id}{\mathrm{id}}\)
\( \newcommand{\Span}{\mathrm{span}}\)
\( \newcommand{\kernel}{\mathrm{null}\,}\)
\( \newcommand{\range}{\mathrm{range}\,}\)
\( \newcommand{\RealPart}{\mathrm{Re}}\)
\( \newcommand{\ImaginaryPart}{\mathrm{Im}}\)
\( \newcommand{\Argument}{\mathrm{Arg}}\)
\( \newcommand{\norm}[1]{\| #1 \|}\)
\( \newcommand{\inner}[2]{\langle #1, #2 \rangle}\)
\( \newcommand{\Span}{\mathrm{span}}\) \( \newcommand{\AA}{\unicode[.8,0]{x212B}}\)
\( \newcommand{\vectorA}[1]{\vec{#1}} % arrow\)
\( \newcommand{\vectorAt}[1]{\vec{\text{#1}}} % arrow\)
\( \newcommand{\vectorB}[1]{\overset { \scriptstyle \rightharpoonup} {\mathbf{#1}} } \)
\( \newcommand{\vectorC}[1]{\textbf{#1}} \)
\( \newcommand{\vectorD}[1]{\overrightarrow{#1}} \)
\( \newcommand{\vectorDt}[1]{\overrightarrow{\text{#1}}} \)
\( \newcommand{\vectE}[1]{\overset{-\!-\!\rightharpoonup}{\vphantom{a}\smash{\mathbf {#1}}}} \)
\( \newcommand{\vecs}[1]{\overset { \scriptstyle \rightharpoonup} {\mathbf{#1}} } \)
\(\newcommand{\longvect}{\overrightarrow}\)
\( \newcommand{\vecd}[1]{\overset{-\!-\!\rightharpoonup}{\vphantom{a}\smash {#1}}} \)
\(\newcommand{\avec}{\mathbf a}\) \(\newcommand{\bvec}{\mathbf b}\) \(\newcommand{\cvec}{\mathbf c}\) \(\newcommand{\dvec}{\mathbf d}\) \(\newcommand{\dtil}{\widetilde{\mathbf d}}\) \(\newcommand{\evec}{\mathbf e}\) \(\newcommand{\fvec}{\mathbf f}\) \(\newcommand{\nvec}{\mathbf n}\) \(\newcommand{\pvec}{\mathbf p}\) \(\newcommand{\qvec}{\mathbf q}\) \(\newcommand{\svec}{\mathbf s}\) \(\newcommand{\tvec}{\mathbf t}\) \(\newcommand{\uvec}{\mathbf u}\) \(\newcommand{\vvec}{\mathbf v}\) \(\newcommand{\wvec}{\mathbf w}\) \(\newcommand{\xvec}{\mathbf x}\) \(\newcommand{\yvec}{\mathbf y}\) \(\newcommand{\zvec}{\mathbf z}\) \(\newcommand{\rvec}{\mathbf r}\) \(\newcommand{\mvec}{\mathbf m}\) \(\newcommand{\zerovec}{\mathbf 0}\) \(\newcommand{\onevec}{\mathbf 1}\) \(\newcommand{\real}{\mathbb R}\) \(\newcommand{\twovec}[2]{\left[\begin{array}{r}#1 \\ #2 \end{array}\right]}\) \(\newcommand{\ctwovec}[2]{\left[\begin{array}{c}#1 \\ #2 \end{array}\right]}\) \(\newcommand{\threevec}[3]{\left[\begin{array}{r}#1 \\ #2 \\ #3 \end{array}\right]}\) \(\newcommand{\cthreevec}[3]{\left[\begin{array}{c}#1 \\ #2 \\ #3 \end{array}\right]}\) \(\newcommand{\fourvec}[4]{\left[\begin{array}{r}#1 \\ #2 \\ #3 \\ #4 \end{array}\right]}\) \(\newcommand{\cfourvec}[4]{\left[\begin{array}{c}#1 \\ #2 \\ #3 \\ #4 \end{array}\right]}\) \(\newcommand{\fivevec}[5]{\left[\begin{array}{r}#1 \\ #2 \\ #3 \\ #4 \\ #5 \\ \end{array}\right]}\) \(\newcommand{\cfivevec}[5]{\left[\begin{array}{c}#1 \\ #2 \\ #3 \\ #4 \\ #5 \\ \end{array}\right]}\) \(\newcommand{\mattwo}[4]{\left[\begin{array}{rr}#1 \amp #2 \\ #3 \amp #4 \\ \end{array}\right]}\) \(\newcommand{\laspan}[1]{\text{Span}\{#1\}}\) \(\newcommand{\bcal}{\cal B}\) \(\newcommand{\ccal}{\cal C}\) \(\newcommand{\scal}{\cal S}\) \(\newcommand{\wcal}{\cal W}\) \(\newcommand{\ecal}{\cal E}\) \(\newcommand{\coords}[2]{\left\{#1\right\}_{#2}}\) \(\newcommand{\gray}[1]{\color{gray}{#1}}\) \(\newcommand{\lgray}[1]{\color{lightgray}{#1}}\) \(\newcommand{\rank}{\operatorname{rank}}\) \(\newcommand{\row}{\text{Row}}\) \(\newcommand{\col}{\text{Col}}\) \(\renewcommand{\row}{\text{Row}}\) \(\newcommand{\nul}{\text{Nul}}\) \(\newcommand{\var}{\text{Var}}\) \(\newcommand{\corr}{\text{corr}}\) \(\newcommand{\len}[1]{\left|#1\right|}\) \(\newcommand{\bbar}{\overline{\bvec}}\) \(\newcommand{\bhat}{\widehat{\bvec}}\) \(\newcommand{\bperp}{\bvec^\perp}\) \(\newcommand{\xhat}{\widehat{\xvec}}\) \(\newcommand{\vhat}{\widehat{\vvec}}\) \(\newcommand{\uhat}{\widehat{\uvec}}\) \(\newcommand{\what}{\widehat{\wvec}}\) \(\newcommand{\Sighat}{\widehat{\Sigma}}\) \(\newcommand{\lt}{<}\) \(\newcommand{\gt}{>}\) \(\newcommand{\amp}{&}\) \(\definecolor{fillinmathshade}{gray}{0.9}\)Reading
For the second half of this lesson:
Chapter 4 (sections 1-3, 5, 6, 7), Chapter 5 (all sections)
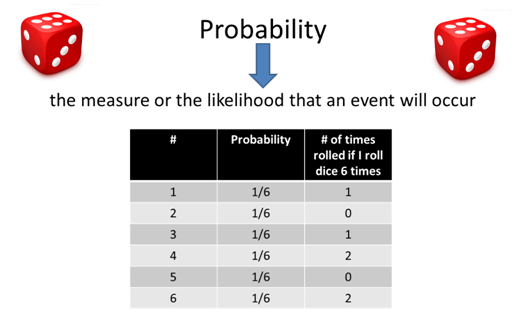
- As a group decide if the probability says that 1 out of each 6 rolls I should get each number once why when I roll the dice 6 times I don’t get each number once?
STOP
- In “Measurement Exercise” you calculated the average of the length and width of your measured rectangle 2 different times, before you agreed on how to measure the rectangle (Experiment 1) and after you agreed on how to measure the rectangle (Experiment 2), calculate the standard deviation of the length for both measurements.
|
Experiment |
Average ± Standard deviation |
|---|---|
|
Experiment 1 |
|
|
Experiment 2 |
|
STOP
BEFORE CONTINUING: request a sheet from Dr. FP that will be turned in to her before you talk about the next two parts with your group.
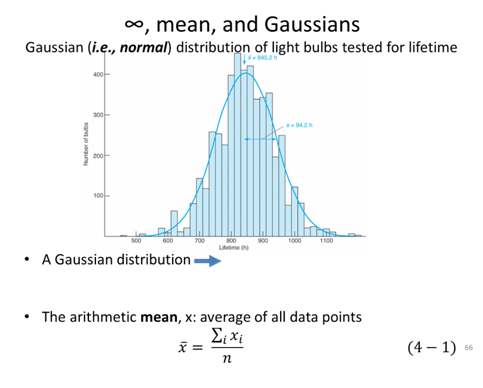
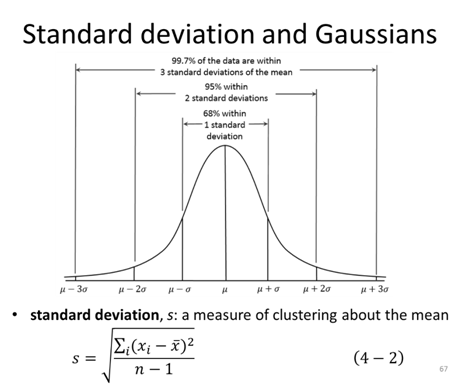
- On the axes below draw two Gaussian curves that represent how your data from the previous question compare, label the average and standard deviation, and be prepared to defend why you have drawn them that way. Be sure to label both the length and the standard deviation.
- Discuss as a group how does the accuracy and the precision of the two data sets compare for these 2 data sets?
- Now imagine that your averages and standard deviations were very different, on the axes below draw two Gaussian curves that represent those two data sets, label the average and standard deviation, and be prepared to defend why you have drawn them that way.
- Discuss as a group how does the accuracy and the precision of the two data sets compare for these 2 data sets?
STOP
![GaussianRepresentationOf[Cu2+]Experiments.png](https://chem.libretexts.org/@api/deki/files/346519/GaussianRepresentationOf%255BCu2%252B%255DExperiments.png?revision=1)
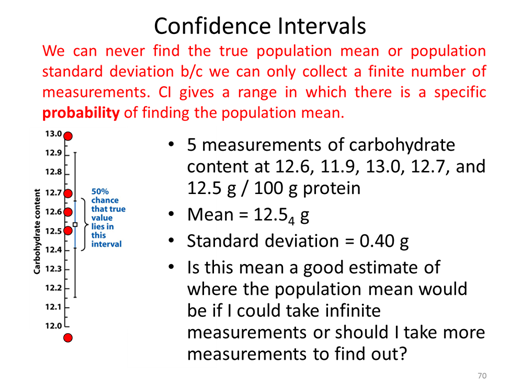
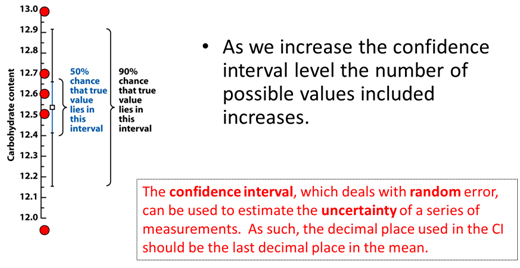
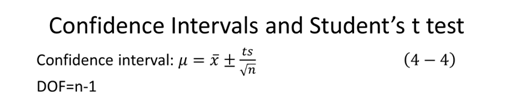
- Calculate the confidence interval of the length for both Experiment 1 and Experiment 2.
|
Problem from Measurement Exercise |
Average ± Confidence interval |
|---|---|
|
Experiment 1 |
|
|
Experiment 2 |
|
- As a group discuss how your confidence intervals compare between the two experiments and does it make sense that one of them should be lower than the other. Why or why not?
- Discuss what are two ways that you could lower your confidence intervals?
-
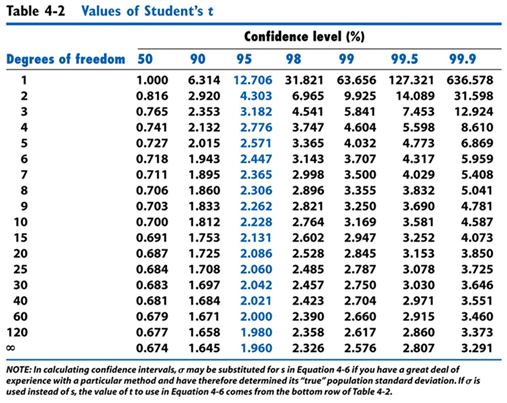
- When you look up the t-value on the table you have been told to use the column labeled 95%, as a group discuss what that means.
STOP
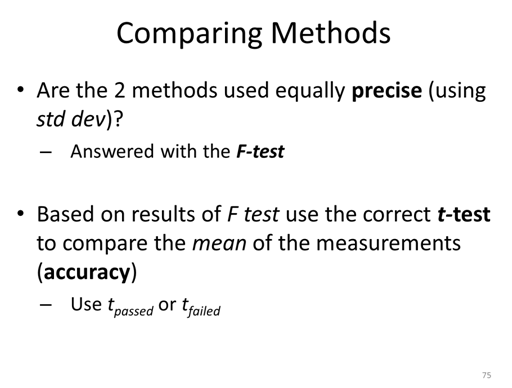
- As a group discuss what values would we want to compare if we wanted to determine which experiment was more precise? And which experiment was more accurate?
STOP
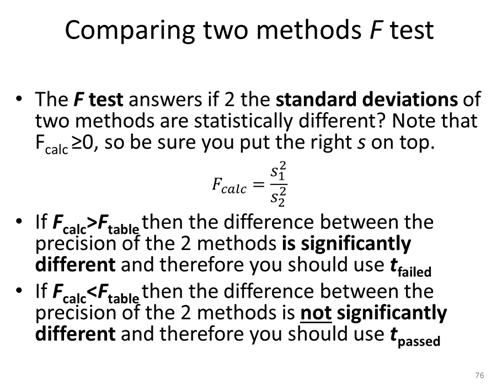
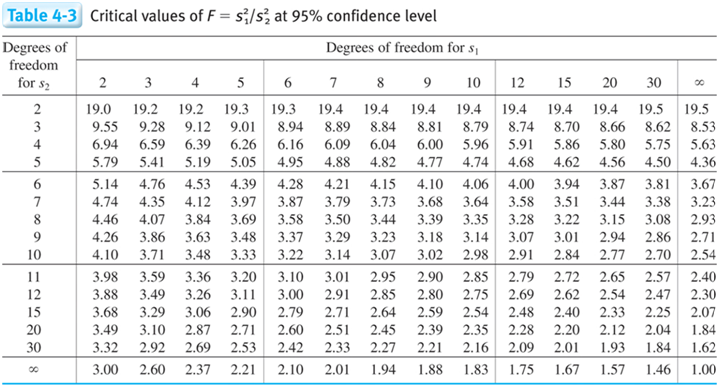
F test table
Degrees of Freedom = n-1
- Determine if the standard deviations of the two experiments are statistically different.
STOP
- Determine if the length and thus the measurements themselves are statistically different.
- As a group discuss what can you say about the relative precision and accuracy of the two methods (ie. is the precision and accuracy statically the same or statistically different?).
STOP
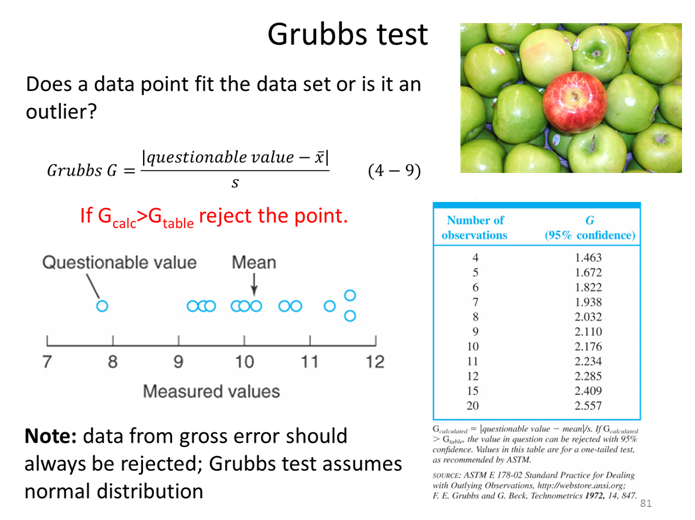
Should any data points be removed from this set before it can be compared to Method 2 (not shown)? (Note: you should check all highs and lows until there is no change, so after doing the first calculation explain what you would do next.)
\(\begin{array}{c|c}
& \textrm{Method 1} \\
\hline
& 0.089 \\
& 0.080 \\
& 0.084 \\
& 0.102 \\
& 0.084 \\
& 0.088 \\
& 0.089 \\
\hline
s & 0.006 \\
\bar{x} & 0.088
\end{array}
\nonumber\)
STOP
- We have talked about tolerance factor, standard deviation, and confidence interval. As a group discuss and be prepared to defend the differences between these three values that can give information about the range of a measurement.
Homework for the first part of statistics
- Explain what each of these different tests/statistical values are used for:
- Confidence interval
- t test
- F-test
- Grubbs test
- Confidence interval
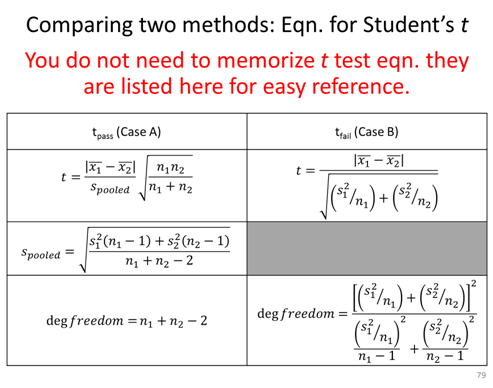
- What would the Gaussians of 2 methods look like if they passes the F-test but failed the t-test? vice versa?
Concentration Calibration Procedures Activity
Accurately knowing the amount, in terms of concentration, of a particular substance (analyte) is important in fundamental research and also in many applied fields of study such as medicine, environmental studies, and the food industry.
In medicine, many drug dosages are effective within a narrow concentration range. If too little is administered, the benefits of the drug will not be obtained. However, if too much is administered in a particular time frame, overdose or toxicity can occur. Therefore, many patients must have their blood tested on a regular basis to determine the amount of such drugs in their system. Also, many common analytes such a metals are required by the human body at low levels, but are toxic to the cells at high levels.
In environmental studies, it is important to ensure that levels of environmental contaminants are monitored. In 2010 the BP Oil spill devastated the wildlife on the Gulf Coast of Mexico in the United States. It was one of the worst environmental accidents in the history of the United States. Years and vast amounts of money was required to clean up the spill. The Gulf waters have since been deemed safe to use; however, four years later, scientists still monitor the concentration of oil contaminants to ensure safety of Gulf water for patron use.
The previous examples provide important reasons for knowing the concentration of a particular analyte in a sample (biological fluid, water, food etc.). The substance that we want to know the amount of in a sample is called the analyte. In order to determine the concentration of a particular analyte in a sample we must perform a procedure called “concentration calibration”. This module discusses the three most common types of concentration calibration procedures.
Analytes themselves cannot be measured directly; however, specific properties of the analyte can. Many analysis techniques that we will talk about at the end of the semester provide a response to a solution containing some concentration of an analyte. Two common ways to get a response for an analyte is to measured light absorbance or an electrochemical property. However, the absorption or electrochemical response of an analyte can rarely be used alone to determine the concentration in the sample. For example, the absorption or electrochemical measurement might be slightly different from one day to the next for the exact same sample due to a variety of uncontrollable variables including background noise from the instrument.
- If an instrument response to the same concentration of an analyte varies from day-to-day, can you devise a general procedure to determine the concentration of an analyte in a solution despite this issue? Report to your professor when done before moving on.
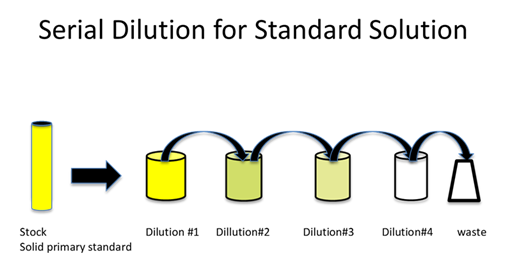
General steps of a concentration calibration:
Finding suitable standard solutions
A primary standard analyte solution is a solution that contains a known amount of the analyte called the standard. The standard may be a pure analyte, a solution containing the analyte, or a solution containing the analyte along with other solutes; in either case, the analyte concentration is accurately known. The solution may be a solid, liquid, or gas phase solution and the standard analyte may exist in either of these three phases as well. Standards are referred to as Standard Reference Materials (SRM) because they have been tested by The National Institute of Standards and Technology (NIST). This agency ensures the analyte concentration in many types of samples is accurate. The picture below is a SRM for Gulf of Mexico Crude Oil, which may be used to test for crude oil contaminants, for example to monitor the safety of the gulf waters after the BP oil spill.
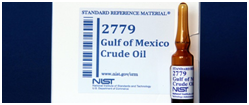
Figure taken from: http://www.nist.gov/publication-portal.cfm?defaultSearch=false&researchfield=245
- What are common characteristics of a primary standard such as the one shown above?
- Do you think that standards are available for all analytes? Why or why not? Elaborate.
STOP
Calibration Curve
To help you understand the ideas of calibration curve and standard addition curves we are going to use a cartoon example, but it translates directly into any chemistry scenario where the dependent variable (y) varies linearly with the independent variable (x).
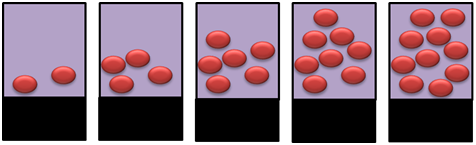
- Imagine that you have 5 containers as shown below and assume that each ball gives an instrument response of 3. Determine the instrument response for each of the containers, plot the instrument response (dependent variable) vs. number of balls (independent variable), and determine using the graph how many balls are present if the instrument response is 26. Be sure to label the graph.
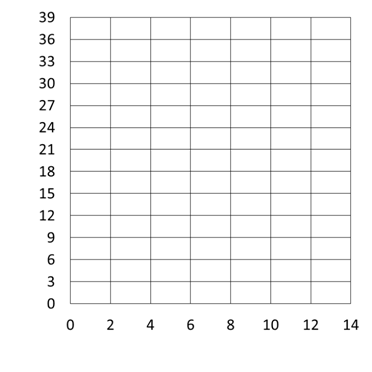
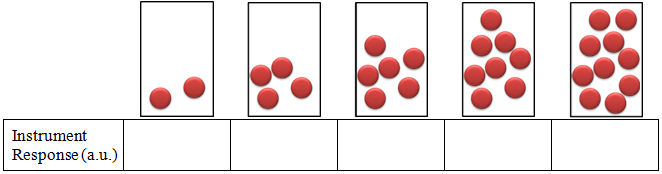
STOP

As a group work through this real lab problem on using calibration. This is very similar to what you will do in Quantitative Analysis Laboratory and EXAMS for this class.
- Using a Calibration Curve
Below is a calibration curve for the determination of vitamin C (ascorbic acid [AA]) via voltammetry. This allows us to plot the current as a function of concentration. Four standards have been made (4.00, 8.00, 12.00, and 16.00 μM) and run to create the calibration curve. Then three fruit juice samples with an unknown amount of vitamin C are run and the current is recorded (Fruit Juice).
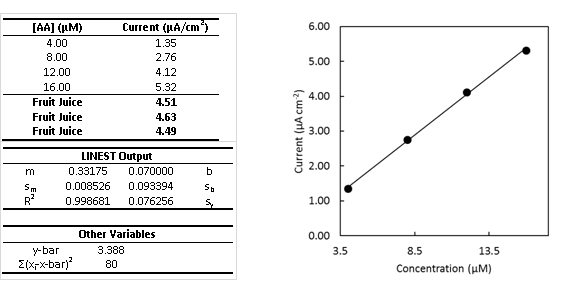
- The table above is readily available from Excel whenever you create a calibration curve and use the LINEST function. You will learn how to create this table in CHEM 316, but you need to know how to use the data in it for this class. Therefore, label all variables in the tables above so you will be able to readily use them. *Note: standard deviation is always given as “s” with a subscript denoting what it is the standard deviation of.
- What is the average concentration of vitamin C in the 3 samples?
- Draw a horizontal line on the plot from the average measured current for the diluted sample to the calibration curve. Then draw a vertical line from the curve to the appropriate concentration on the x-axis. This provides a graphical check of your math. Does your graphical check confirm your math?
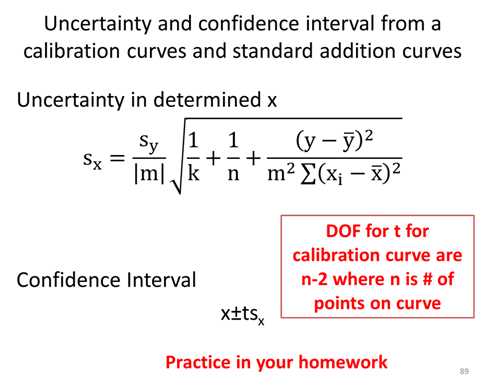
- Determine the uncertainty, sx, of the sample concentration.
- Calculate the confidence interval and write the complete confidence interval (e.g. XX±YY μM) with the correct number of significant figures.
- If the detection limit is 0.20 µM, what is the quantitation limit? (come back to after we learn LOD, LOQ, and sensitivity)
- The y-intercept is non-zero. What could this be indicative of?
STOP
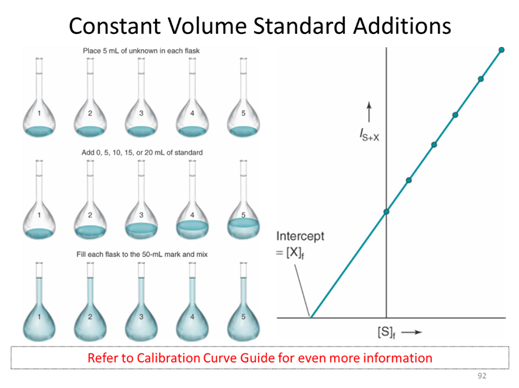
Assuming that we have to take the measurement in the presence of the purple solution which is very hard to make or may not have a standard solution. We start with some unknown amount of balls that I am covering up with a black box so you can’t see them. We put 2 additional balls in and collect an instrument response. We repeat this spiking procedure 4 more times. This is referred to as a constant volume standard addition, for which the initial concentration is given by the absolute value of the x-intercept. (The derivation of this fact is in section 5-3 if you are interested)
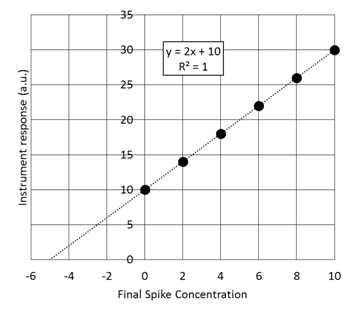
- Given the standard addition graph below determine the initial concentration of the solution that has been spiked.
STOP
- Using a Standard Addition Curve
Brilliant Blue G (BBG) dye was recently discovered as promising dye to analyze the extent of spinal cord injury. In this experiment, standard addition was used to minimize the matrix effect in determining concentration of BBG in a sample of spinal fluid.
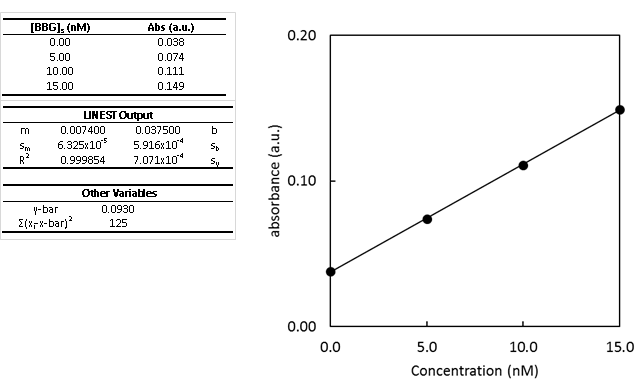
- Determine the concentration of BBG in the unspiked sample using the standard addition curve.
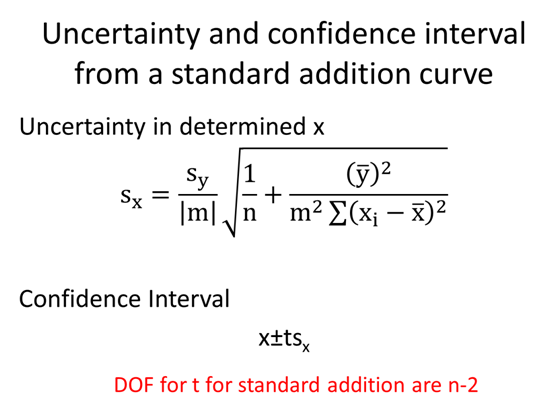
- Second, determine the uncertainty in the concentration of BBG.
- Calculate and write the complete confidence interval with the correct number of significant figures.
- The y-intercept is non-zero. What could this be indicative of?
STOP
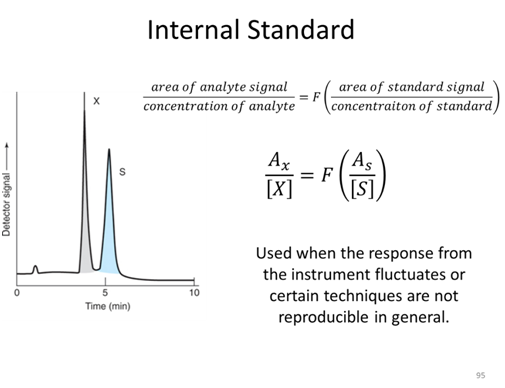
Internal Standard Activity
Suppose you wanted to measure the quercetin concentration in a plant food such as Prunus serotina. Before performing the measurement, you would first need to remove quercetin from the plant sample because the plant itself will not be compatible with the measurement technique. For example, most measurement techniques require the sample in liquid form. A likely procedure for removing the quercetin from the plant is to use an extraction process. A sample of the plant might be mixed with a suitable solvent in a blender, homogenized, and filtered. One concern in this process is whether all of the quercetin has been extracted from the plant. If a lesser amount is extracted, the concentration of quercetin in Prunus serotina will be underestimated using an external standard curve.
- Can your group think of a way to determine the extraction efficiency of an analyte such as quercetin?
STOP
- A standard solution containing 75 ppm of quercetin and 60 ppm of internal standard kaempferol gave peak areas of 300 and 200, respectively. A plant sample is spiked such that the extract to be analyzed should have 60 ppm of kaempferol. Analysis of the sample gives a peak area for the kaempferol of 163. The quercetin peak in the same extract has an area of 407. What is the concentration of quercetin in the extract?
STOP
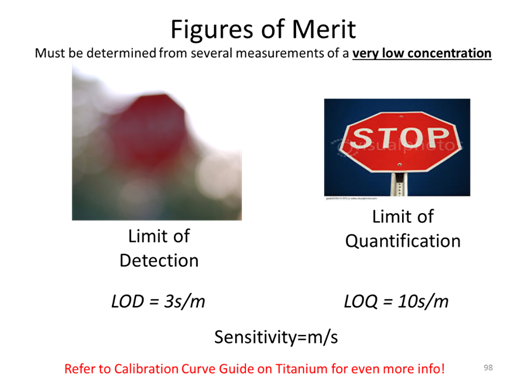
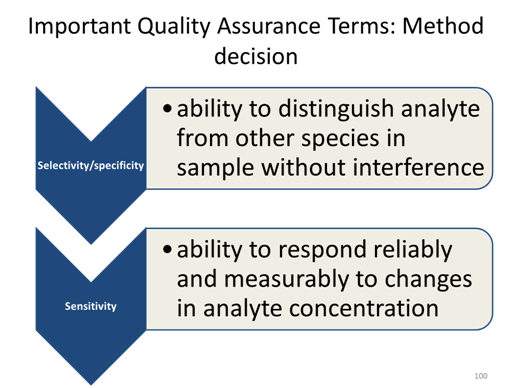
- What are the LOD, LOQ, and sensitivity for the calibration curve made for [Cu2+] via AA?
\(
\:\:\textrm{LOD Data (a.u.)}\\
\begin{array}{|c|c|}
\hline
&\textrm{AA} \\
\hline
1& 0.025 \\
\hline
2& 0.026 \\
\hline
3& 0.025 \\
\hline
4& 0.026 \\
\hline
5& 0.026 \\
\hline
6& 0.03 \\
\hline
7& 0.027 \\
\hline
8& 0.028 \\
\hline
9& 0.027 \\
\hline
10& 0.028 \\
\hline
\textrm{std dev} & 0.00154 \\
\hline
\textrm{m} & 5170.55 \\
\hline
\end{array}
\nonumber\)
STOP
From a previous exam:
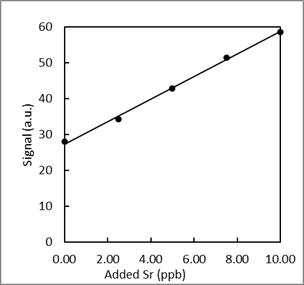
- Trace elements, such as Sr, in teeth of archeological specimens provide anthropologists with clues about diet and diseases of ancient people. Atomic absorption spectroscopy measurements were collected to determine the amount of Sr in a tooth specimen. Use the data to answer the following questions a-f.
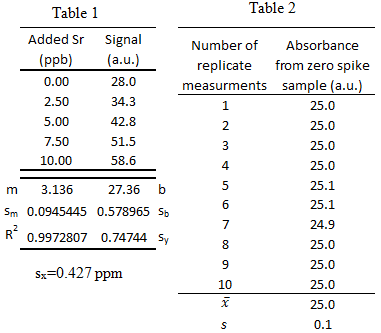
-
What is the 95% confidence interval for unknown Sr concentration? Write the confidence interval in this form: XX ± YY.
- What is the limit of detection for the calibration curve?
- What is the limit of quantification for the calibration curve?
- What is the sensitivity for the calibration curve?
- Could the concentration 0.2 ppb be measured via this method? \(\dfrac{yes\: or\: no}{circle\: one}\)
- Could the concentration 0.2 ppb be quantified via this method? \(\dfrac{yes\: or\: no}{circle\: one}\)
-
From a previous exam:
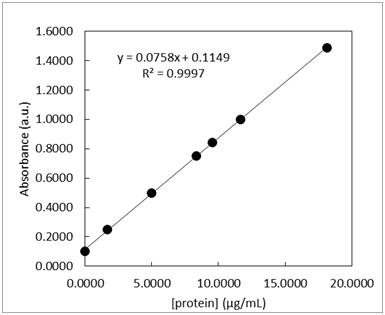
- Standard solutions of a blue protein were made and their absorbance was measured at 508 nm using UV-vis spectroscopy. The standard calibration curve and LINEST output are shown below in Table 1. A unknown sample was also measured and the 3 replicate measurements are listed in Table 1. The measurements of the lowest concentration sample, 1.6670 µg/mL, was measured 10 times and the resulting absorbance values are listed in Table 2.
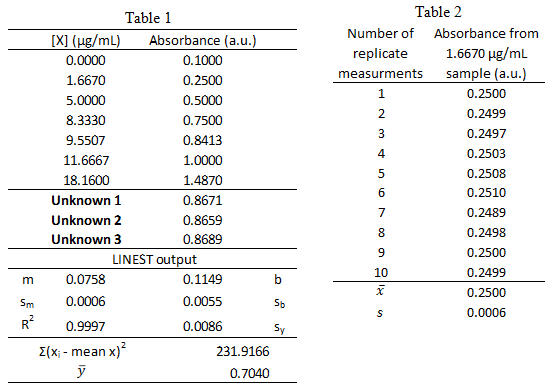
-
What is the 95% confidence interval for unknown protein concentration? Write the confidence interval in this form: XX ± YY.
- What is the limit of detection for the calibration curve?
- What is the limit of quantification for the calibration curve?
- What is the sensitivity for the calibration curve?
- Could the concentration 0.06 µg/mL be measured via this method? \(\dfrac{yes\: or\: no}{circle\: one}\)
- Could the concentration 0.06 µg/mL be quantified via this method? \(\dfrac{yes\: or\: no}{circle\: one}\)
-