
9.3: Introduction
- Page ID
- 212005
\( \newcommand{\vecs}[1]{\overset { \scriptstyle \rightharpoonup} {\mathbf{#1}} } \)
\( \newcommand{\vecd}[1]{\overset{-\!-\!\rightharpoonup}{\vphantom{a}\smash {#1}}} \)
\( \newcommand{\dsum}{\displaystyle\sum\limits} \)
\( \newcommand{\dint}{\displaystyle\int\limits} \)
\( \newcommand{\dlim}{\displaystyle\lim\limits} \)
\( \newcommand{\id}{\mathrm{id}}\) \( \newcommand{\Span}{\mathrm{span}}\)
( \newcommand{\kernel}{\mathrm{null}\,}\) \( \newcommand{\range}{\mathrm{range}\,}\)
\( \newcommand{\RealPart}{\mathrm{Re}}\) \( \newcommand{\ImaginaryPart}{\mathrm{Im}}\)
\( \newcommand{\Argument}{\mathrm{Arg}}\) \( \newcommand{\norm}[1]{\| #1 \|}\)
\( \newcommand{\inner}[2]{\langle #1, #2 \rangle}\)
\( \newcommand{\Span}{\mathrm{span}}\)
\( \newcommand{\id}{\mathrm{id}}\)
\( \newcommand{\Span}{\mathrm{span}}\)
\( \newcommand{\kernel}{\mathrm{null}\,}\)
\( \newcommand{\range}{\mathrm{range}\,}\)
\( \newcommand{\RealPart}{\mathrm{Re}}\)
\( \newcommand{\ImaginaryPart}{\mathrm{Im}}\)
\( \newcommand{\Argument}{\mathrm{Arg}}\)
\( \newcommand{\norm}[1]{\| #1 \|}\)
\( \newcommand{\inner}[2]{\langle #1, #2 \rangle}\)
\( \newcommand{\Span}{\mathrm{span}}\) \( \newcommand{\AA}{\unicode[.8,0]{x212B}}\)
\( \newcommand{\vectorA}[1]{\vec{#1}} % arrow\)
\( \newcommand{\vectorAt}[1]{\vec{\text{#1}}} % arrow\)
\( \newcommand{\vectorB}[1]{\overset { \scriptstyle \rightharpoonup} {\mathbf{#1}} } \)
\( \newcommand{\vectorC}[1]{\textbf{#1}} \)
\( \newcommand{\vectorD}[1]{\overrightarrow{#1}} \)
\( \newcommand{\vectorDt}[1]{\overrightarrow{\text{#1}}} \)
\( \newcommand{\vectE}[1]{\overset{-\!-\!\rightharpoonup}{\vphantom{a}\smash{\mathbf {#1}}}} \)
\( \newcommand{\vecs}[1]{\overset { \scriptstyle \rightharpoonup} {\mathbf{#1}} } \)
\(\newcommand{\longvect}{\overrightarrow}\)
\( \newcommand{\vecd}[1]{\overset{-\!-\!\rightharpoonup}{\vphantom{a}\smash {#1}}} \)
\(\newcommand{\avec}{\mathbf a}\) \(\newcommand{\bvec}{\mathbf b}\) \(\newcommand{\cvec}{\mathbf c}\) \(\newcommand{\dvec}{\mathbf d}\) \(\newcommand{\dtil}{\widetilde{\mathbf d}}\) \(\newcommand{\evec}{\mathbf e}\) \(\newcommand{\fvec}{\mathbf f}\) \(\newcommand{\nvec}{\mathbf n}\) \(\newcommand{\pvec}{\mathbf p}\) \(\newcommand{\qvec}{\mathbf q}\) \(\newcommand{\svec}{\mathbf s}\) \(\newcommand{\tvec}{\mathbf t}\) \(\newcommand{\uvec}{\mathbf u}\) \(\newcommand{\vvec}{\mathbf v}\) \(\newcommand{\wvec}{\mathbf w}\) \(\newcommand{\xvec}{\mathbf x}\) \(\newcommand{\yvec}{\mathbf y}\) \(\newcommand{\zvec}{\mathbf z}\) \(\newcommand{\rvec}{\mathbf r}\) \(\newcommand{\mvec}{\mathbf m}\) \(\newcommand{\zerovec}{\mathbf 0}\) \(\newcommand{\onevec}{\mathbf 1}\) \(\newcommand{\real}{\mathbb R}\) \(\newcommand{\twovec}[2]{\left[\begin{array}{r}#1 \\ #2 \end{array}\right]}\) \(\newcommand{\ctwovec}[2]{\left[\begin{array}{c}#1 \\ #2 \end{array}\right]}\) \(\newcommand{\threevec}[3]{\left[\begin{array}{r}#1 \\ #2 \\ #3 \end{array}\right]}\) \(\newcommand{\cthreevec}[3]{\left[\begin{array}{c}#1 \\ #2 \\ #3 \end{array}\right]}\) \(\newcommand{\fourvec}[4]{\left[\begin{array}{r}#1 \\ #2 \\ #3 \\ #4 \end{array}\right]}\) \(\newcommand{\cfourvec}[4]{\left[\begin{array}{c}#1 \\ #2 \\ #3 \\ #4 \end{array}\right]}\) \(\newcommand{\fivevec}[5]{\left[\begin{array}{r}#1 \\ #2 \\ #3 \\ #4 \\ #5 \\ \end{array}\right]}\) \(\newcommand{\cfivevec}[5]{\left[\begin{array}{c}#1 \\ #2 \\ #3 \\ #4 \\ #5 \\ \end{array}\right]}\) \(\newcommand{\mattwo}[4]{\left[\begin{array}{rr}#1 \amp #2 \\ #3 \amp #4 \\ \end{array}\right]}\) \(\newcommand{\laspan}[1]{\text{Span}\{#1\}}\) \(\newcommand{\bcal}{\cal B}\) \(\newcommand{\ccal}{\cal C}\) \(\newcommand{\scal}{\cal S}\) \(\newcommand{\wcal}{\cal W}\) \(\newcommand{\ecal}{\cal E}\) \(\newcommand{\coords}[2]{\left\{#1\right\}_{#2}}\) \(\newcommand{\gray}[1]{\color{gray}{#1}}\) \(\newcommand{\lgray}[1]{\color{lightgray}{#1}}\) \(\newcommand{\rank}{\operatorname{rank}}\) \(\newcommand{\row}{\text{Row}}\) \(\newcommand{\col}{\text{Col}}\) \(\renewcommand{\row}{\text{Row}}\) \(\newcommand{\nul}{\text{Nul}}\) \(\newcommand{\var}{\text{Var}}\) \(\newcommand{\corr}{\text{corr}}\) \(\newcommand{\len}[1]{\left|#1\right|}\) \(\newcommand{\bbar}{\overline{\bvec}}\) \(\newcommand{\bhat}{\widehat{\bvec}}\) \(\newcommand{\bperp}{\bvec^\perp}\) \(\newcommand{\xhat}{\widehat{\xvec}}\) \(\newcommand{\vhat}{\widehat{\vvec}}\) \(\newcommand{\uhat}{\widehat{\uvec}}\) \(\newcommand{\what}{\widehat{\wvec}}\) \(\newcommand{\Sighat}{\widehat{\Sigma}}\) \(\newcommand{\lt}{<}\) \(\newcommand{\gt}{>}\) \(\newcommand{\amp}{&}\) \(\definecolor{fillinmathshade}{gray}{0.9}\)III. Introduction
General References
These provide background information on the techniques and theory and are provided to improve your understanding and provide practical hints that may help you avoid mistakes that may prove costly in terms of laboratory time.
- Measuring Mass & Volume MHS, Chapter 5 pp. 52-61
- Using Pasteur Pipettes to Transfe MHS, Chapter 5 pp. 55-62
- Thermometer Calibration MHS, Chapter 5.4 pp. 63
- Refluxing a Reaction Mixture MHS, Chapter 7 pp. 59-60
- Extraction: Separatory Funnel MHS, Chapter 11 pp. 113-124
- Boiling Point & Distillation MHS, Chapter 12 pp. 174-176
- Refractive Index MHS, Chapter 13 pp. 206-211
- Nuclear Magnetic Resonance MHS, Chapter 22 pp. 350-405
- Mass Spectrometry MHS, Chapter 24 pp. 441-462
- Infrared Spectroscopy MHS, Chapter 21 pp. 311-344
- Distillation ATKINS, Chapter 10, pp. 404-406
- Boiling ATKINS, Chapter 10.4 pp. 373-374
- Esters ATKINS, Chapter 20 pp. 828-829
- Clausius-Clapeyron Equation ATKINS, Chapter 10.3 pp. 371-373
Videos: Digital Technique Manual
- #1 Volumetric techniques
- #5 Reaction Work-Up I
- #7 Filtration
- #11 Using a Balance
- #15 Distillation I: Simple & Fractional Distillations
- #17 Refluxing a Reaction
A. Esterification - Background
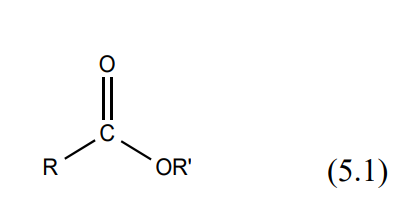
Esters are found naturally in a variety of fruits, vegetables, herbs and spices. Odors can be complex and generally pleasantly smelling usually the odor of the ester stands out. Esters are made, by condensing an alcohol with a carboxylic acid. The reaction is generally catalyzed with concentrated sulfuric acid (H2SO4). Esters have a general formula as illustrated in (5.1).
There are many possible combinations possible between an alcohol and various acids each combination producing different esters with characteristic identifiable odors. See Table 1 on page 5 of this manual. The forward / reverse reaction is rapid and is illustrated in (5.2).
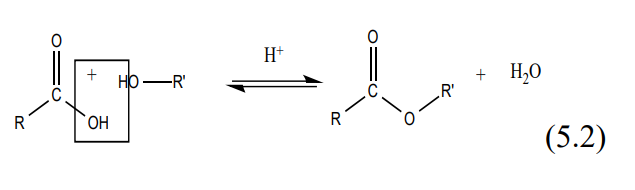
Generally, equilibrium exists between reactants on one side and products on the other. This equilibrium predominantly favors the reactants. Under acidic conditions using concentrated sulfuric acid as a catalyst, the water on the product side is removed causing the equilibrium to shift in favor of the products. The mechanism for the fisher acid catalyzed esterification reaction is shown in (5.3).
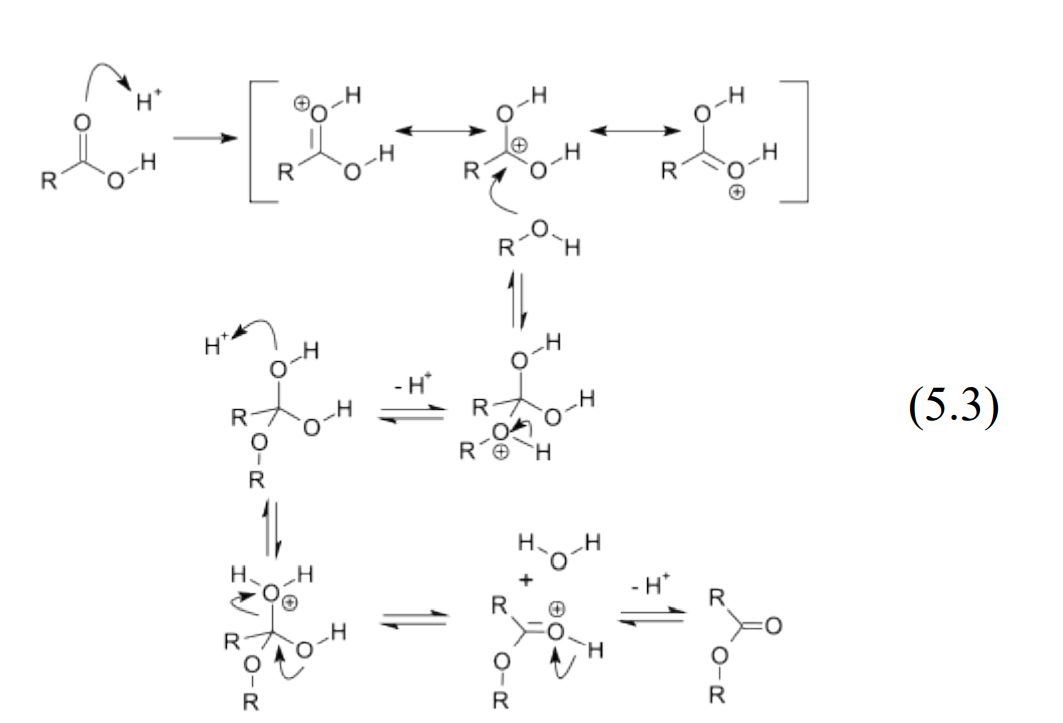
Reaction mechanism © V8rik at English Wikipedia. Wikimedia Commons, License CC BY-SA. All rights reserved. This content is excluded from our Creative Commons license. For more information, see http:// ocw.mit.edu/help/faq-fair-use/
In this classic reaction scheme, the H+ acts as a Lewis acid activating the carbonyl group, which becomes a good electrophile. At the same time, the -OH is converted into a good leaving group as water, which breaks off. The pathway presented lowers the energy barrier speeding up the reaction to products.
B. Esterification Lab - Overview
Day 1— “Introduction to Refluxing, Extraction and Drying the Product” Assembling a ground-glass reflux apparatus in the hood for Fisher synthesis of an ester from an unknown alcohol and unknown carboxylic acid. After refluxing remove any acid impurities from the ester by extraction with aqueous base separating out the ester from the reaction mixture. Dry the ester with an anhydrous chemical drying agent and store in a clean scintillation vial for Day 2.
Day 2— “Introduction to Atmospheric Distillation” Assemble a distillation apparatus.
Day 3— “Product Characterization using Infrared Spectroscopy (IR), Boiling Point (BP), Density, Refractive Index (20nD) and NMR Spectroscopy.”
Day 4— “Further Product Characterization using Mass Spectrometry (MS). Final Product Identification.”
C. Hewlett Packard GC/Mass Spectrometer and Varian Saturn 2200 GC/MS/MS
The GC-Mass Spectrometer has become one of the most sensitive and powerful instruments for the identification of organic compounds. Analysis of trace quantities of organic compounds has advanced to a stage greater than 1 part in 1015. Many impurities and contaminants found in food and water can now be identified unambiguously in trace amounts. To make the process easier many thousands of spectra including insecticides and industrial pollutants have been compiled into databases and are now readily available as packages that can be purchased and downloaded to computers hooked directly to GC/MS systems.
The Organic volatile unknown will be injected neat into the heated injector port of the GC/MS using a special custom-designed 0.01-microliter syringe. The volatilized compound is carried in the helium flow to a splitter with a split-out ration set at 1:300 whereby only 0.33% of the sample is diverted to the GC column (the rest is vaporized and exits the system). The GC column used in this instrument is a capillary column, which is 10-30 meters long and only 0.4 mm in diameter. The conditions above insure that no more than 10-9 gram of the sample is applied to this column.
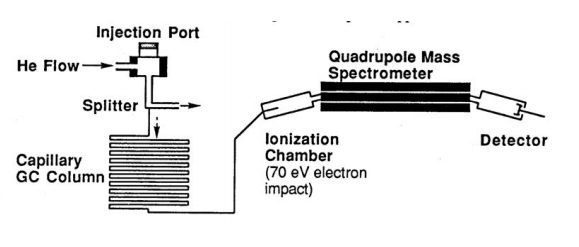
Schematic Diagram of HP GC/MS Quadrupole Mass Spectrometer
In the Hewlett Packard GC/MS as the organic compounds elute from the GC, they are introduced immediately into a Quadrupole Mass Spectrometer and a series of mass spectra are repeatedly recorded for each two-second interval. In the ionization chamber, electrons traveling across a 70-eV potential bombard the molecules. When a molecule is struck by one of these high-energy electrons, it loses one of its own electrons and becomes a radical cation M. +. Many of the molecular ions will be formed with enough excess energy to undergo subsequent reactions in the ionization chamber. From the ionization chamber, the positively charged ions are attracted through the magnetic field of a quadrupole ion chamber maintained under high vacuum. For a given strength of the magnetic field, only those ions having the correct charge/mass ratio (m/e) will be deflected through the magnetic field and reach the detector. The instrument varies the magnetic field continuously to produce a spectrum of m/e peaks.
In the next section are detailed mechanisms for common fragmentation and ionization reactions. It is much more difficult to solve the structure of an organic compound from the mass spectrum alone than it is to match the spectrum with that of the known compound. With the help of NMR and IR spectroscopy, mass spectrometry can play an important role in structure determination.
D. Reactions Observed in Mass Spectroscopy
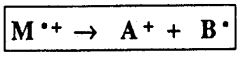
A Fragmentation Reaction involves the cleavage of one bond of the radical cation M.+ to form a cation A+ and a radical B. . The reaction is especially facilitated by substituents, which stabilize the cation A+.
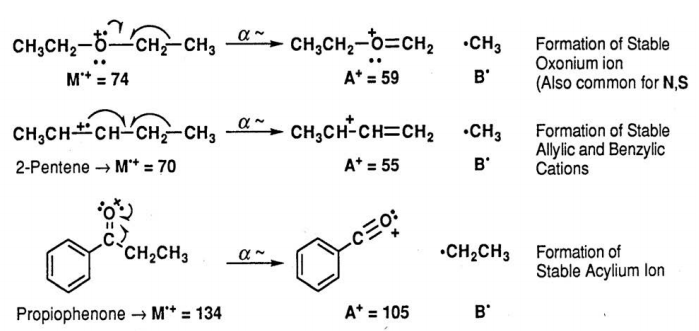
α-Cleavage Reaction. The α-cleavage reaction is driven by the formation of a stable carbocation as shown in the examples listed below. In the first case, ethers readily undergo the α-cleavage reaction forming a stable oxonium ion (also common for similar N, S compounds). In the second example, alkenes undergo a-cleavage reaction to form a stable allylic cation (also common for aryl compounds and alkynes). In the third example, ketones readily undergo acleavage to produce stable acylium ions.
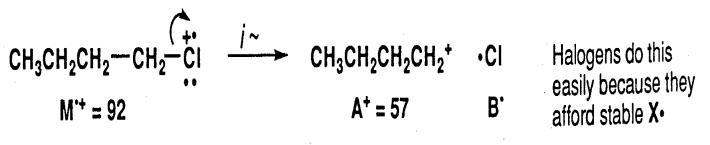
Inductive Cleavage Reaction. Alkyl halides often undergo the inductive cleavage reaction in which the halogen atom (e.g. Cl. ) simply breaks off the initial radical cation. This is most prevalent for bromides and iodides and for compounds, which can produce a stable carbocation.
In each case, fragmentation reactions above produce both a radical and a cation from the initial radical cation M.+. Also, as a consequence of the nitrogen rule: For molecules that do not contain nitrogen, fragmentation reactions of the even-massed radical cations will produce oddmassed A+ ions. This can be a useful method for finding which ions are produced by one of the above reactions.
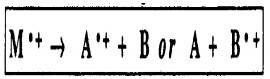
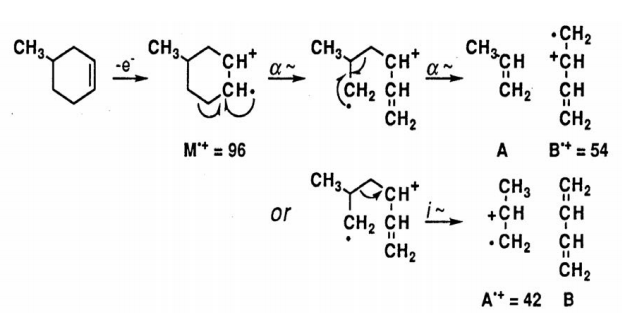
A Rearrangement Reaction involves the cleavage of more than one bond of the radical cation M.+ to ultimately form a new radical cation A.+ and a neutral compound B. Often, rearrangement reactions may proceed by complementary pathways so that the mass numbers for both parts of the molecule can be found in the mass spectrum.
Rearrangement of Cyclic Structures. When a cyclohexene derivative is ionized in the mass spectrum, a particularly facile cleavage of the ring is reminiscent of a retro-Diels-Alder reaction.
Radical Site Rearrangements (McLafferty Rearrangement). Carbonyl derivatives readily undergo a rearrangement reaction in which the M+. undergoes intramolecular H atom transfer to the carbonyl oxygen atom. The best geometry involves a six-membered transition state and subsequent α-cleavage or inductive cleavage leads to the fragment ions of each piece.
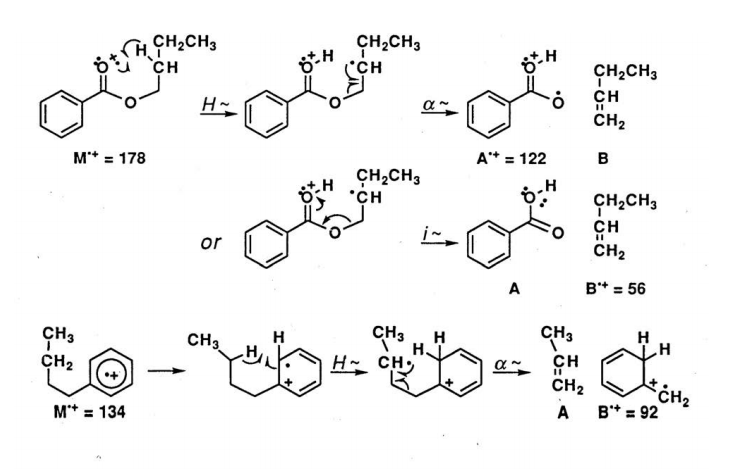
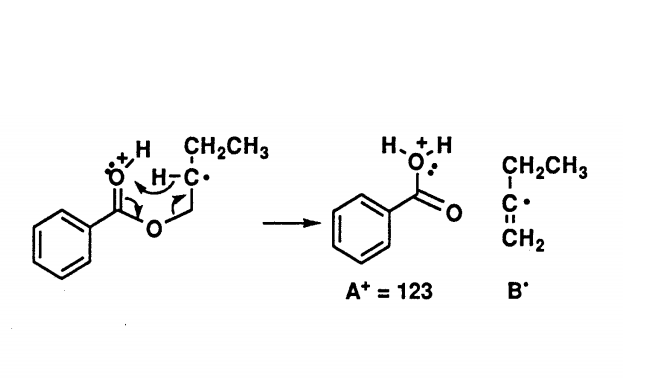
For each example of rearrangement reactions, the observed ions are radical cations. For a molecule which does not contain nitrogen, the McLafferty rearrangement of the even-massed M+. ion produces an even mass A+. ion and so are easily distinguished from the odd-massed ions from a simple fragmentation reaction. Also, many molecules display a peak in the mass spectrum arising from a McLafferty +1 rearrangement. For the ester above, the mechanism involves a second H atom transfer.
D. Nuclear Magnetic Resonance
I. Purpose
The Nuclear Magnetic Resonance portion of the course is designed to introduce 5.310 students to the basic concepts of nuclear magnetic resonance (NMR) spectroscopy including spin, energy levels, absorption of radiation, and a number of other NMR spectral parameters. Most importantly to provide experience in the identification of unknowns from 1H (proton) NMR spectra. All students will be given a tour of the Varian 300 MHz operation room in the Undergraduate lab, which will include observing the running of a sample (subject to the availability of the instruments). You will then receive a recorded spectrum of your Unknown volatile organic sample and will use this spectrum along with your mass spectrum and wet chemistry results to determine the structure and identity of your unknown sample.
II. Safety
One of the main safety considerations that you should be aware of when walking into the instrument room is the field generated by the 300 MHz NMR magnet. The field is strong enough to wipe out data on magnetic credit cards (Master charge, VISA, American Express and others). Thus, when working in the vicinity of an NMR spectrometer, it is a good practice to leave these items in some alternate location. In fact, bringing any type of metal objects near a strong magnet is not a good idea because they could be sucked away ending up under the NMR.
III. Theory: Energy Levels of Nuclei in a Magnetic Field
Many isotopes of elements in the periodic table, but not all, possess spin angular momenta, which results from coupling the spin and orbital angular momenta of the protons and neutrons in the nucleus. In Principles of Chemical Science, 5.111, you learned that the orbital angular momentum, l, of an electron can be oriented in 2l + 1 discrete states (e.g. a p electron (l=1) can have ml = -1, 0, +1 orientation states). With NMR, we will be conducting experiments on the nuclei of atoms, not the electrons. Nuclear spin angular momenta behave the same way. Nuclei with spin I can have 2I + 1 values of the spin orientation, characterized by quantum numbers, mI, which are [-I, -(I-1)……(I-1), I]. For I = ½ the allowed mI are +1/2 and -1/2 and for I = 1 the allowed mI are -1, 0, +1. If I is non-zero, the nucleus has a magnetic moment, and when placed in a magnetic field, the component of the moment along the field direction (conventionally taken as the z direction) is µz = γℏmI, where γ, which is a constant specific for each isotope, termed the gyro magnetic ratio; ℏ is the Planck’s constant divided by 2 π(ℏ = 1.055 x 10⁻³⁴ J s), and mI is the quantum number. Some γ values for chemically important nuclei are given in Table 1. Note that nuclei such as 12C and 16O are not included in the table, since they have I=0.
The rules for determining whether a nucleus has a net spin (I) are fairly simple:
- If a nucleus has an odd number of protons and an odd number of neutrons then the effective spin of the nucleus will be an integer number such as 1, 2, and 3.
- If in a nucleus, the sum of the protons and neutrons is odd, then the effective spin of the nucleus will be on the order of a half-integer such as ½, 3/2, 5/2.
- If the sum of the protons and neutrons is even then the effective spin of the nucleus will be zero.
| Nucleus | Spin | Gyromagnetic Ratio, γ (107T-1s-1) | v (MHz) | Natural Abundance (%) |
| 1H | 1/2 | 26.75 | 42.576 | 99.985 |
| 2H | 1 | 4.11 | 6.536 | 0.015 |
| 13C | 1/2 | 6.73 | 10.705 | 1.108 |
| 15F | 1/2 | 25.18 | 40.054 | 100.00 |
| 14N | 1 | 1.93 | 3.076 | 99.63 |
| 15N | 1/2 | -2.71** | 4.31 | 0.37 |
| 31P | 1/2 | 10.84 | 17.238 | 100.00 |
Table 1. Spin, gyro magnetic ratios, NMR frequencies (in a 1 T (10 kG) field) and the natural abundance of selected nuclides)*
* T stands for Tesla (1 Tesla = 104 Gauss. The earth’s magnetic field is around 0.5 Gauss)
** What is the physical meaning of a negative gyro magnetic constant?
In a laboratory field B0, the nuclei can assume 2I + 1 orientations corresponding to the values of mI, each value of mI corresponds to an energy given by (Figure 1):
\[ \rm E_{mI} = - \mu \textbf{B_0} = - \mu_z \textbf{B}_{\textbf{0}} = - \hbar \gamma \textbf{B}_{\textbf{0}} m_I\]
Which can be rewritten as
\[ \rm E_{mI} = - m_I \hbar \omega_0\]
Where the Larmor frequency is ω0 = γB0
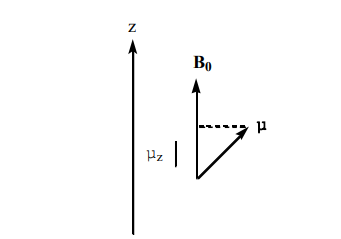
Figure 1. The relationship between the laboratory magnetic field B0 and, the magnetic moment of the nucleus, µ, and its µz component (µ component along the z axis)
As shown in Figure 2, the energy separation between the two levels α and β of an I = ½ system with the magnetic field turned on is shown below. Note in the absence of the magnetic field the two energy levels are degenerate resulting in the same energy, with the field applied the two levels move apart:
\[ \rm \Delta E = E(\beta) - E(\alpha) = 1/2\hbar\gamma \textbf{B}_{\textbf{0}} - (-1/2)\hbar\gamma \textbf{B}_{\textbf{0}} = \hbar\gamma \textbf{B}_{\textbf{0}}\]
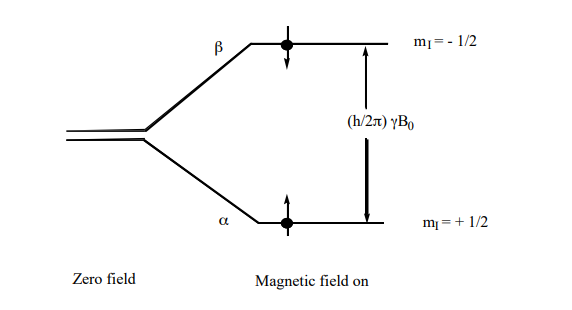
Figure 2. The nuclear spin energy levels of a spin-1/2 nucleus (e.g. 1H or 13C) in a magnetic field. Resonance occurs when the energy separation of the levels, as determined by the magnetic field strength, matches the energy of the photons in the electromagnetic field.
Thus, when the sample resides in a magnetic field and is bathed with radiation of frequency ω0/2π = νo (energy =ℏω0) matching the difference between the levels resonance occurs—i.e. energy is absorbed causing the excited nucleus to jump for the α to the β, energy level, as illustrated schematically in Figure 2. When the nucleus in the higher β energy level drops back down to the lower a energy state, a quantum of energy is released in the radio frequency range and it’s this energy that produces the NMR signal. Equation (3) is the resonance condition. Using the values for γ in Table 1, we can calculate that for 1H in a 4.7 T field, the resonance frequency is 200 MHz, and for an 11.7 T field νo = 500 MHz.
The method of obtaining the NMR spectrum that we use includes FT (Fourier Transform NMR). A short pulse of RF energy is applied to the sample tilting the net magnetization vector off its equilibrium. The decaying oscillations of the magnetization vector are recorded in real time with a magnetic coil as it decays to equilibrium (FID). A computer program uses Fourier transform mathematics to convert the FID, which is a function of time, to an NMR spectrum as a function of frequency.
The amount of energy absorbed (and therefore the NMR signal strength) is proportional to the population difference between the α, and β energy levels. The NMR signal that we are plotting is basically the energy difference between the energy absorbed by the spins that causes them to move from the lower parallel α energy level to the upper antiparallel β energy level and the energy reemitted by the spinning nucleons as they make the transition back down from the higher β energy level to the lower α energy level. In the Charles River Experiment, we used the Beer-Lambert law to calculate the amount of light transmitted by an absorbing sample:
\[ \rm % T = I/I_o = e^{-A} = e^{-\epsilon cl}\]
The absorbance A= εcl can be written as A = kabsNabsl where kabs is an absorption coefficient and Nabs represents the number of absorbing molecules in the beam path. Because excited molecules can re-radiate light, the effective Nabs is actually N (lower α level) – N (upper β level). The ratio of the population of nuclear spins in the upper β state, N(β), to the population of nuclear spins in the lower α state, N(α), can be calculated using the Boltzmann equation:
\[ \rm P = \dfrac{N_{\beta}}{N_{\alpha}}= e^{-\dfrac{\Delta E}{kT}}\]
where, ΔE equals the energy difference between spin states, k is the Boltzmann constant (1.3805 x 10⁻²³ J/K-mole), and T is the absolute temperature in K. At room temperature, the number of spins in the α lower energy state, N(α), just slightly outnumbers the number of spins in the β higher energy state N(β). For a proton, in an applied field with a strength of 7.0 T (e.g. the magnetic field of the Varian 300 MHz), using ΔE = hν, the difference ℏ γ B0 between two spin states of the proton is 1.99x10⁻²⁵J per molecule. The kT at room temperature (T = 298 K) is 4.11 x 10⁻²¹ J, therefore ΔE/kT = 4.84 x 10⁻⁵ substituting,
\[ \rm \dfrac{N_{\beta}}{N_{\alpha}} = e^{-\dfrac{\Delta E}{kT}} \dfrac{N_{\beta}}{N_{\alpha}} = e^{-4.84xE-5} \dfrac{N_{\beta}}{N_{\alpha}} = 0.999952 N_{\beta} = 0.999952 N_{\alpha}\]
With such small population differences, highly sensitive detection techniques are required. The NMR signal depends on the N(β) / N(α)α population ratio. As the temperature decreases the ratio decreases, and as the temperature increases the ratio approaches 1.