
2.2: Day 2 Procedure - Determination of the Activation Energy
- Page ID
- 212000
\( \newcommand{\vecs}[1]{\overset { \scriptstyle \rightharpoonup} {\mathbf{#1}} } \)
\( \newcommand{\vecd}[1]{\overset{-\!-\!\rightharpoonup}{\vphantom{a}\smash {#1}}} \)
\( \newcommand{\id}{\mathrm{id}}\) \( \newcommand{\Span}{\mathrm{span}}\)
( \newcommand{\kernel}{\mathrm{null}\,}\) \( \newcommand{\range}{\mathrm{range}\,}\)
\( \newcommand{\RealPart}{\mathrm{Re}}\) \( \newcommand{\ImaginaryPart}{\mathrm{Im}}\)
\( \newcommand{\Argument}{\mathrm{Arg}}\) \( \newcommand{\norm}[1]{\| #1 \|}\)
\( \newcommand{\inner}[2]{\langle #1, #2 \rangle}\)
\( \newcommand{\Span}{\mathrm{span}}\)
\( \newcommand{\id}{\mathrm{id}}\)
\( \newcommand{\Span}{\mathrm{span}}\)
\( \newcommand{\kernel}{\mathrm{null}\,}\)
\( \newcommand{\range}{\mathrm{range}\,}\)
\( \newcommand{\RealPart}{\mathrm{Re}}\)
\( \newcommand{\ImaginaryPart}{\mathrm{Im}}\)
\( \newcommand{\Argument}{\mathrm{Arg}}\)
\( \newcommand{\norm}[1]{\| #1 \|}\)
\( \newcommand{\inner}[2]{\langle #1, #2 \rangle}\)
\( \newcommand{\Span}{\mathrm{span}}\) \( \newcommand{\AA}{\unicode[.8,0]{x212B}}\)
\( \newcommand{\vectorA}[1]{\vec{#1}} % arrow\)
\( \newcommand{\vectorAt}[1]{\vec{\text{#1}}} % arrow\)
\( \newcommand{\vectorB}[1]{\overset { \scriptstyle \rightharpoonup} {\mathbf{#1}} } \)
\( \newcommand{\vectorC}[1]{\textbf{#1}} \)
\( \newcommand{\vectorD}[1]{\overrightarrow{#1}} \)
\( \newcommand{\vectorDt}[1]{\overrightarrow{\text{#1}}} \)
\( \newcommand{\vectE}[1]{\overset{-\!-\!\rightharpoonup}{\vphantom{a}\smash{\mathbf {#1}}}} \)
\( \newcommand{\vecs}[1]{\overset { \scriptstyle \rightharpoonup} {\mathbf{#1}} } \)
\( \newcommand{\vecd}[1]{\overset{-\!-\!\rightharpoonup}{\vphantom{a}\smash {#1}}} \)
\(\newcommand{\avec}{\mathbf a}\) \(\newcommand{\bvec}{\mathbf b}\) \(\newcommand{\cvec}{\mathbf c}\) \(\newcommand{\dvec}{\mathbf d}\) \(\newcommand{\dtil}{\widetilde{\mathbf d}}\) \(\newcommand{\evec}{\mathbf e}\) \(\newcommand{\fvec}{\mathbf f}\) \(\newcommand{\nvec}{\mathbf n}\) \(\newcommand{\pvec}{\mathbf p}\) \(\newcommand{\qvec}{\mathbf q}\) \(\newcommand{\svec}{\mathbf s}\) \(\newcommand{\tvec}{\mathbf t}\) \(\newcommand{\uvec}{\mathbf u}\) \(\newcommand{\vvec}{\mathbf v}\) \(\newcommand{\wvec}{\mathbf w}\) \(\newcommand{\xvec}{\mathbf x}\) \(\newcommand{\yvec}{\mathbf y}\) \(\newcommand{\zvec}{\mathbf z}\) \(\newcommand{\rvec}{\mathbf r}\) \(\newcommand{\mvec}{\mathbf m}\) \(\newcommand{\zerovec}{\mathbf 0}\) \(\newcommand{\onevec}{\mathbf 1}\) \(\newcommand{\real}{\mathbb R}\) \(\newcommand{\twovec}[2]{\left[\begin{array}{r}#1 \\ #2 \end{array}\right]}\) \(\newcommand{\ctwovec}[2]{\left[\begin{array}{c}#1 \\ #2 \end{array}\right]}\) \(\newcommand{\threevec}[3]{\left[\begin{array}{r}#1 \\ #2 \\ #3 \end{array}\right]}\) \(\newcommand{\cthreevec}[3]{\left[\begin{array}{c}#1 \\ #2 \\ #3 \end{array}\right]}\) \(\newcommand{\fourvec}[4]{\left[\begin{array}{r}#1 \\ #2 \\ #3 \\ #4 \end{array}\right]}\) \(\newcommand{\cfourvec}[4]{\left[\begin{array}{c}#1 \\ #2 \\ #3 \\ #4 \end{array}\right]}\) \(\newcommand{\fivevec}[5]{\left[\begin{array}{r}#1 \\ #2 \\ #3 \\ #4 \\ #5 \\ \end{array}\right]}\) \(\newcommand{\cfivevec}[5]{\left[\begin{array}{c}#1 \\ #2 \\ #3 \\ #4 \\ #5 \\ \end{array}\right]}\) \(\newcommand{\mattwo}[4]{\left[\begin{array}{rr}#1 \amp #2 \\ #3 \amp #4 \\ \end{array}\right]}\) \(\newcommand{\laspan}[1]{\text{Span}\{#1\}}\) \(\newcommand{\bcal}{\cal B}\) \(\newcommand{\ccal}{\cal C}\) \(\newcommand{\scal}{\cal S}\) \(\newcommand{\wcal}{\cal W}\) \(\newcommand{\ecal}{\cal E}\) \(\newcommand{\coords}[2]{\left\{#1\right\}_{#2}}\) \(\newcommand{\gray}[1]{\color{gray}{#1}}\) \(\newcommand{\lgray}[1]{\color{lightgray}{#1}}\) \(\newcommand{\rank}{\operatorname{rank}}\) \(\newcommand{\row}{\text{Row}}\) \(\newcommand{\col}{\text{Col}}\) \(\renewcommand{\row}{\text{Row}}\) \(\newcommand{\nul}{\text{Nul}}\) \(\newcommand{\var}{\text{Var}}\) \(\newcommand{\corr}{\text{corr}}\) \(\newcommand{\len}[1]{\left|#1\right|}\) \(\newcommand{\bbar}{\overline{\bvec}}\) \(\newcommand{\bhat}{\widehat{\bvec}}\) \(\newcommand{\bperp}{\bvec^\perp}\) \(\newcommand{\xhat}{\widehat{\xvec}}\) \(\newcommand{\vhat}{\widehat{\vvec}}\) \(\newcommand{\uhat}{\widehat{\uvec}}\) \(\newcommand{\what}{\widehat{\wvec}}\) \(\newcommand{\Sighat}{\widehat{\Sigma}}\) \(\newcommand{\lt}{<}\) \(\newcommand{\gt}{>}\) \(\newcommand{\amp}{&}\) \(\definecolor{fillinmathshade}{gray}{0.9}\)Day #2: Determination of the Activation Energy for the Catalase-H2O2 Complex12
Enzymes principally act as catalysts increasing the rates at which reactions take place making the conversion of reactants to products go faster. One way that enzymes do this is by lowering the activation energy necessary for a spontaneous reaction to proceed on its own by helping to bring the reactants closer together. An important part of any kinetic analysis is the determination of this activation energy Ea. Activation Energy is the spark of energy necessary to help a spontaneous reaction get started so that it can proceed to form products on its own without any further input of energy. Molecules must have enough effective collisions to make it over an energy hump that needs to get the reaction going. This is the activation energy (Ea) we are talking about. An uncatalyzed reaction would require higher activation energy than a catalyzed reaction.
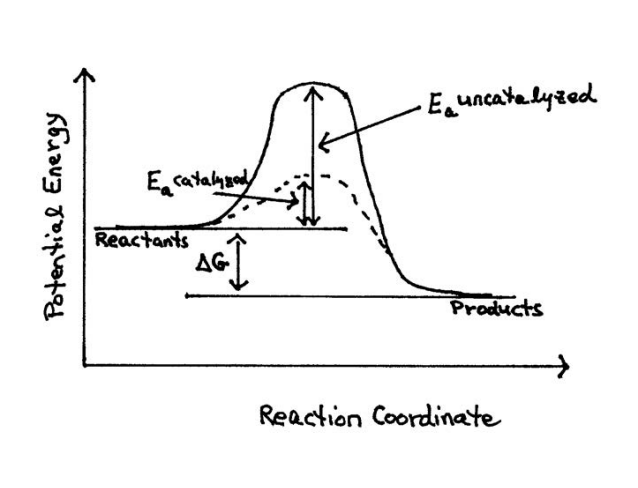
Figure 6. Free Energy diagram monitoring the progress of a catalyzed and uncatalyzed reaction13.
The dependence of the rate constant on activation energy and temperature can be expressed in the Arrhenius Equation:
\[ \rm k = A \space\space e^{-Ea/RT}\]
Ea = activation energy KJ/mole
R = universal gas constant 8.314 J/K-mol
T = absolute temperature in Kelvin (K)
A = collision frequency factor
Rate constants for most chemical reactions follow the above equation. Given the temperature this equation allows us to determine the activation energy required to initiate a reaction. The form of the above equation can be re-written in logarithmic form which provides a useful working equation that relates k and T. Taking the natural logarithm of both sides of the above we arrive at the following:
\[ \rm ln \space k = (-\dfrac{E_a}{R}) (\dfrac{1}{T}) + ln \space A\]
The equation now resembles an equation of a straight-line y = mx + b. Using excel to plot ln k vs. 1/T yields a straight line with a slope m = -Ea/R. The activation energy for the reaction can be determined from the slop of this line.
To determine the activation energy, we will measure the rate constants taken at seven different temperatures. We will monitor the reaction at different temperatures, while keeping the initial concentrations of the reactants identical for each trial. This will allow us to study and measure the effect of changing temperature on our rate of reaction. From the data obtained the student will be able to calculate the activation energy, Ea, for the reaction.
Method14
Each team as assigned by the TA will set up the apparatus used on Day 1 as illustrated in Figure 4. The reaction vessel consists of a glass pressure tube that can be sealed quickly by spinning on a Teflon threaded plug that is fitted with a rubber O-ring. The Teflon plug has another threaded outlet that connects via a luer lock directly to the computer interfaced gas pressure probe. About 80-90% of the pressure tube is submerged in a 600 mL beaker of water during the collection of data to facilitate a constant temperature during each of the kinetic runs. First, heat the water bath up to a temperature between 35 to 40 °C in the 600 mL beaker. Use a thermometer to measure the temperature of the water bath. Record this temperature into your laboratory notebooks. We will make the assumption that the water bath temperature remains constant throughout the entire experiment. You will need to add ice and heat as necessary to maintain the constant temperature. A stir bar and magnetic stir plate is used to vigorously stir the reaction contents inside the pressure tube to promote the rapid evolution of O2 (g). The stir bar setting should be set at the same rate for all four trials. Connect a Gas Pressure sensor to the Go-Link computer interface connector and connect that to the computer. Connect the gas pressure sensor to the luer lock connection at the top of the Teflon® threaded interface. Start the Logger Pro data-monitoring program on your computer and open the appropriate collection file, which we will be found under Advanced Chemistry Module 12 Peroxide.
Each team will run seven trial runs, which vary the temperature of your reaction vessel and you can pick any temperature within the following ranges, 5 to 10 °C, 10 to 15 °C, 15 to 20 °C, 20 to 25 °C, 25 to 30 0 C, 30 to 35 °C, 35 to 40 °C, then, choose a stock H2O2 of 1.00 mL and a phosphate buffer of 23.00 mL with stock enzyme of 1.00 mL for a total volume of 25.00 mL. Or, choose another stock solution that you will keep constant throughout the temperature study. We will call this our standard stock solution.
After the temperature is stabilized in the range of 35 to 40 °C, remove the pressure tube from the water bath and unscrew the threaded Teflon® plug and seal, now, insert the stir bar into the pressure tube along with the first volume of Solution I which includes the stock H2O2 and the Phosphate buffer. You should allow Solution I time to equilibrate to the temperature in the pressure tube. The easiest and quickest means to handle the next part is to screw the Teflon plug onto the pressure tube then, inject 1.00 mL of stock solution of catalase Solution II directly through the luer lock hole in the Teflon plug using an automatic 1000 µL pipettor. Make sure you hold the pipette tightly in the luer lock hole so that when you inject you don’t have any backflow out of the connection. Connecting to the Vernier gas probe then quickly closes the hole. Make sure that you set the stir rate for maximum stirring before you inject the enzyme and leave it constant throughout the entire reaction and all of the subsequent temperature studies. As soon as the enzyme has been added to the pressure tube and you have snapped on the gas probe connector, click collect to begin data collection. The software is designed to run for approximately 5 minutes, however, during the run click on “Experiment” at the top of the screen and then click extend run to 450 seconds as this will give you the best data for your file. After collecting the data when the time has elapsed, carefully unscrew the Teflon® cap to relieve the pressure in the tube. Remove the tube from the water bath and dispose of the contents into the appropriate waste collection flask for this module. Save the data set to a disc drive or appropriate file on the computer. Rinse and clean the pressure tube with distilled water and prepare for the second thru the fourth trials as above. At the end of running the four trials you can begin to analyze the graphs with the data analysis options included with the software. Carefully examine the graph, and select a point just beyond the initial flat upward inflection portion. Use the data analysis software to determine the slope of the tangent line (m) corresponding to the steepest point in your pressure v. time curve. Click the Linear Regression button on the software program to calculate the best-fit line equation that fits the graph at the steepest slope. The slope of the tangent line is your initial rate of your reaction and should be recorded into your laboratory notebooks. You need to convert this rate, which is KPa/sec oxygen formed into M/sec of hydrogen peroxide decomposing. This is critical because you will be using this rate to calculate the rate constant k for each trial. You may if you prefer, use Microsoft Excel to do your data analysis.
Analysis and Discussion
(Be sure to include/discuss these in your report)
- Using the volume of stock solution, you used from Table 1 calculate the molar concentration of H2O2 in your trials.
- Calculate the initial rate of oxygen formation for each trial, which is simply the maximum slope of the curve (m) in your plot of Pressure v. Time. This slope, will have units of kPa/sec, and is the initial rate for the reaction.
- Calculate the initial rate of reaction for each trial in units of M/s by dividing the observed slope of the tangent line (m) from (2) above by RT. (R=8.314 LkPa/mole-K). You should end up with the rate of formation of Oxygen d[O2]/dt in (M/s).
- Using the Vg, Vs, and the stoichiometry of the reaction convert the above rate in (3) into the rate hydrogen peroxide used up (- d[H2O2]/dt) (M/s).
- Construct a table of your results include the mass of water in your pressure tube (g), the temperature of the water (°C), density of water from Chemistry and Physics Handbook (g/mL), Volume of the Pressure tube (mL), Volume of solution Vs, (mL), Volume of Gas, Vg (mL), Room Pressure, 4% H2O2 volumes (mL), [H2O2] (M), Temperature for each trial (°C) & (K), Rate (kPa/s), Rate O2 M/s, Rate O2 mole/s, Rate H2O2 mole/s, Rate M/s with respect to H2O2.
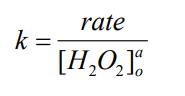
- Calculate the rate constant for each trial by dividing the rate in M/sec with respect to H2O2 by the concentration of H2O2 raised to the power representing the order of the reaction that you calculated from Day 1.
- Using Excel or Log Pro, create a graph of ln k vs. 1/T. Add a trendline to your plotted data, and obtain both the equation of the trendline and R2 value. Be sure to include a printout of this graph in your Appendix of the lab report. Use the graph and equation generated to determine the activation energy, Ea in kJ/mole, and the frequency factor A, for this reaction. Show your calculations.
- Briefly comment on what impact you think the catalyst had on the activation energy of this specific reaction. Discuss and explain.
- What is the effect of changing the temperature of the solution on the reaction rate? Explain.
- Compare your activation energy with other values in the literature and analyze the equipment used here and elsewhere. How accurate do you think the value that you calculated compares with other methods that have been published? What are the advantages of the equipment we used with respect to what has been done? What are the limitations?
Footnotes
12 Equation derivations: Raymond Chang, Chemistry, 9th edition, McGraw Hill, 2007, p. 571.
13 Diagram modified from: Donald & Judith Voet, Biochemistry, 3rd. edition, John Wiley and Sons, Inc., 2004, p. 477 (showing the effect of a catalyst on the transition state diagram of a reaction).
14 Use of the pressure tube technique adopted from: Lewis, M. E.; Levine, R. M.; York, J. T.; Grubbs, W. T., Journal of Chemical Education, (2009) 86, 1227-1230.