
2: Paper Chromatography of Gel Ink Pens (Experiment)
- Page ID
- 93983
\( \newcommand{\vecs}[1]{\overset { \scriptstyle \rightharpoonup} {\mathbf{#1}} } \)
\( \newcommand{\vecd}[1]{\overset{-\!-\!\rightharpoonup}{\vphantom{a}\smash {#1}}} \)
\( \newcommand{\dsum}{\displaystyle\sum\limits} \)
\( \newcommand{\dint}{\displaystyle\int\limits} \)
\( \newcommand{\dlim}{\displaystyle\lim\limits} \)
\( \newcommand{\id}{\mathrm{id}}\) \( \newcommand{\Span}{\mathrm{span}}\)
( \newcommand{\kernel}{\mathrm{null}\,}\) \( \newcommand{\range}{\mathrm{range}\,}\)
\( \newcommand{\RealPart}{\mathrm{Re}}\) \( \newcommand{\ImaginaryPart}{\mathrm{Im}}\)
\( \newcommand{\Argument}{\mathrm{Arg}}\) \( \newcommand{\norm}[1]{\| #1 \|}\)
\( \newcommand{\inner}[2]{\langle #1, #2 \rangle}\)
\( \newcommand{\Span}{\mathrm{span}}\)
\( \newcommand{\id}{\mathrm{id}}\)
\( \newcommand{\Span}{\mathrm{span}}\)
\( \newcommand{\kernel}{\mathrm{null}\,}\)
\( \newcommand{\range}{\mathrm{range}\,}\)
\( \newcommand{\RealPart}{\mathrm{Re}}\)
\( \newcommand{\ImaginaryPart}{\mathrm{Im}}\)
\( \newcommand{\Argument}{\mathrm{Arg}}\)
\( \newcommand{\norm}[1]{\| #1 \|}\)
\( \newcommand{\inner}[2]{\langle #1, #2 \rangle}\)
\( \newcommand{\Span}{\mathrm{span}}\) \( \newcommand{\AA}{\unicode[.8,0]{x212B}}\)
\( \newcommand{\vectorA}[1]{\vec{#1}} % arrow\)
\( \newcommand{\vectorAt}[1]{\vec{\text{#1}}} % arrow\)
\( \newcommand{\vectorB}[1]{\overset { \scriptstyle \rightharpoonup} {\mathbf{#1}} } \)
\( \newcommand{\vectorC}[1]{\textbf{#1}} \)
\( \newcommand{\vectorD}[1]{\overrightarrow{#1}} \)
\( \newcommand{\vectorDt}[1]{\overrightarrow{\text{#1}}} \)
\( \newcommand{\vectE}[1]{\overset{-\!-\!\rightharpoonup}{\vphantom{a}\smash{\mathbf {#1}}}} \)
\( \newcommand{\vecs}[1]{\overset { \scriptstyle \rightharpoonup} {\mathbf{#1}} } \)
\(\newcommand{\longvect}{\overrightarrow}\)
\( \newcommand{\vecd}[1]{\overset{-\!-\!\rightharpoonup}{\vphantom{a}\smash {#1}}} \)
\(\newcommand{\avec}{\mathbf a}\) \(\newcommand{\bvec}{\mathbf b}\) \(\newcommand{\cvec}{\mathbf c}\) \(\newcommand{\dvec}{\mathbf d}\) \(\newcommand{\dtil}{\widetilde{\mathbf d}}\) \(\newcommand{\evec}{\mathbf e}\) \(\newcommand{\fvec}{\mathbf f}\) \(\newcommand{\nvec}{\mathbf n}\) \(\newcommand{\pvec}{\mathbf p}\) \(\newcommand{\qvec}{\mathbf q}\) \(\newcommand{\svec}{\mathbf s}\) \(\newcommand{\tvec}{\mathbf t}\) \(\newcommand{\uvec}{\mathbf u}\) \(\newcommand{\vvec}{\mathbf v}\) \(\newcommand{\wvec}{\mathbf w}\) \(\newcommand{\xvec}{\mathbf x}\) \(\newcommand{\yvec}{\mathbf y}\) \(\newcommand{\zvec}{\mathbf z}\) \(\newcommand{\rvec}{\mathbf r}\) \(\newcommand{\mvec}{\mathbf m}\) \(\newcommand{\zerovec}{\mathbf 0}\) \(\newcommand{\onevec}{\mathbf 1}\) \(\newcommand{\real}{\mathbb R}\) \(\newcommand{\twovec}[2]{\left[\begin{array}{r}#1 \\ #2 \end{array}\right]}\) \(\newcommand{\ctwovec}[2]{\left[\begin{array}{c}#1 \\ #2 \end{array}\right]}\) \(\newcommand{\threevec}[3]{\left[\begin{array}{r}#1 \\ #2 \\ #3 \end{array}\right]}\) \(\newcommand{\cthreevec}[3]{\left[\begin{array}{c}#1 \\ #2 \\ #3 \end{array}\right]}\) \(\newcommand{\fourvec}[4]{\left[\begin{array}{r}#1 \\ #2 \\ #3 \\ #4 \end{array}\right]}\) \(\newcommand{\cfourvec}[4]{\left[\begin{array}{c}#1 \\ #2 \\ #3 \\ #4 \end{array}\right]}\) \(\newcommand{\fivevec}[5]{\left[\begin{array}{r}#1 \\ #2 \\ #3 \\ #4 \\ #5 \\ \end{array}\right]}\) \(\newcommand{\cfivevec}[5]{\left[\begin{array}{c}#1 \\ #2 \\ #3 \\ #4 \\ #5 \\ \end{array}\right]}\) \(\newcommand{\mattwo}[4]{\left[\begin{array}{rr}#1 \amp #2 \\ #3 \amp #4 \\ \end{array}\right]}\) \(\newcommand{\laspan}[1]{\text{Span}\{#1\}}\) \(\newcommand{\bcal}{\cal B}\) \(\newcommand{\ccal}{\cal C}\) \(\newcommand{\scal}{\cal S}\) \(\newcommand{\wcal}{\cal W}\) \(\newcommand{\ecal}{\cal E}\) \(\newcommand{\coords}[2]{\left\{#1\right\}_{#2}}\) \(\newcommand{\gray}[1]{\color{gray}{#1}}\) \(\newcommand{\lgray}[1]{\color{lightgray}{#1}}\) \(\newcommand{\rank}{\operatorname{rank}}\) \(\newcommand{\row}{\text{Row}}\) \(\newcommand{\col}{\text{Col}}\) \(\renewcommand{\row}{\text{Row}}\) \(\newcommand{\nul}{\text{Nul}}\) \(\newcommand{\var}{\text{Var}}\) \(\newcommand{\corr}{\text{corr}}\) \(\newcommand{\len}[1]{\left|#1\right|}\) \(\newcommand{\bbar}{\overline{\bvec}}\) \(\newcommand{\bhat}{\widehat{\bvec}}\) \(\newcommand{\bperp}{\bvec^\perp}\) \(\newcommand{\xhat}{\widehat{\xvec}}\) \(\newcommand{\vhat}{\widehat{\vvec}}\) \(\newcommand{\uhat}{\widehat{\uvec}}\) \(\newcommand{\what}{\widehat{\wvec}}\) \(\newcommand{\Sighat}{\widehat{\Sigma}}\) \(\newcommand{\lt}{<}\) \(\newcommand{\gt}{>}\) \(\newcommand{\amp}{&}\) \(\definecolor{fillinmathshade}{gray}{0.9}\)- To use paper chromatography to identify whether certain colored inks are pure substances or mixtures.
- To obtain a paper chromatogram of various gel inks
- To identify components of inks by calculating Rf values
Chromatography is a method of physically separating mixtures into its individual components. It is a common laboratory technique used to identify unknown components in mixtures.
There are several types of chromatography; all types employ a mobile phase or eluent (it can be liquid or gas), which is forced through a stationary phase (a solid or semi-solid). Mixtures are separated because some components will be more attracted to the stationary phase (and stick to it) while some components will be more attracted to the mobile phase (and travel with it).
By eye, we cannot know if each ink color is a mixture or pure substance. Using chromatography, the components in a sample will migrate along the filter paper at different rates such that they become spread out and separated from each other. The mobile phase takes advantage of differing solubility or polarity of the components in order to separate them. This component traveling process is called elution. Chromatography can be used to separate inks, dyes, pigments in plants, or used to determine the chemical composition of many substances.
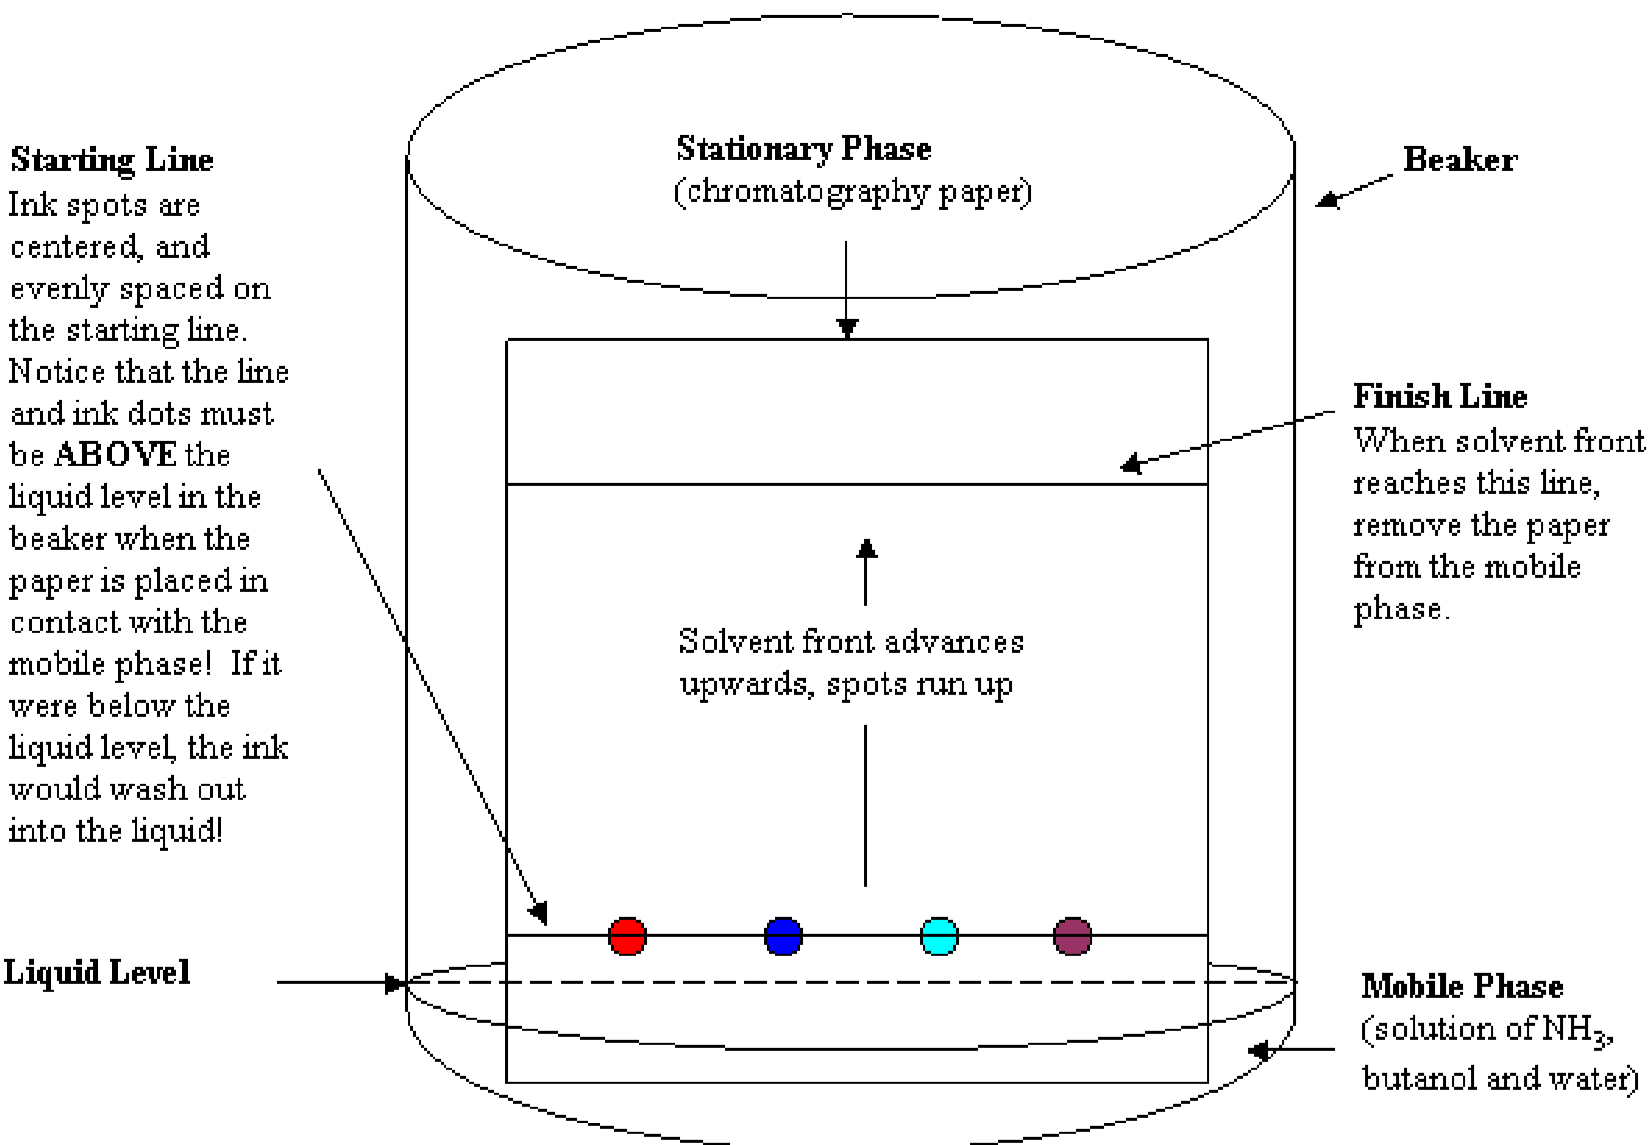
Figure 1 shows a beaker containing mobile phase and a prepared paper stationary phase. A line drawn at the bottom edge of the paper is the starting line. The starting line and ink dots must be above the level of the mobile phase when the paper is placed inside the beaker. If the starting line is below the liquid level, the inks will wash out into the mobile phase rather than elute up the stationary phase. Another line is drawn about 10 cm above the bottom edge of the paper. This is the finish line. Its location was chosen for this experiment because when the eluting solution reaches that line, any inks that are mixtures should be clearly separated.
When the solvent front reaches the finish line, the paper should be removed immediately from contact with the mobile phase.
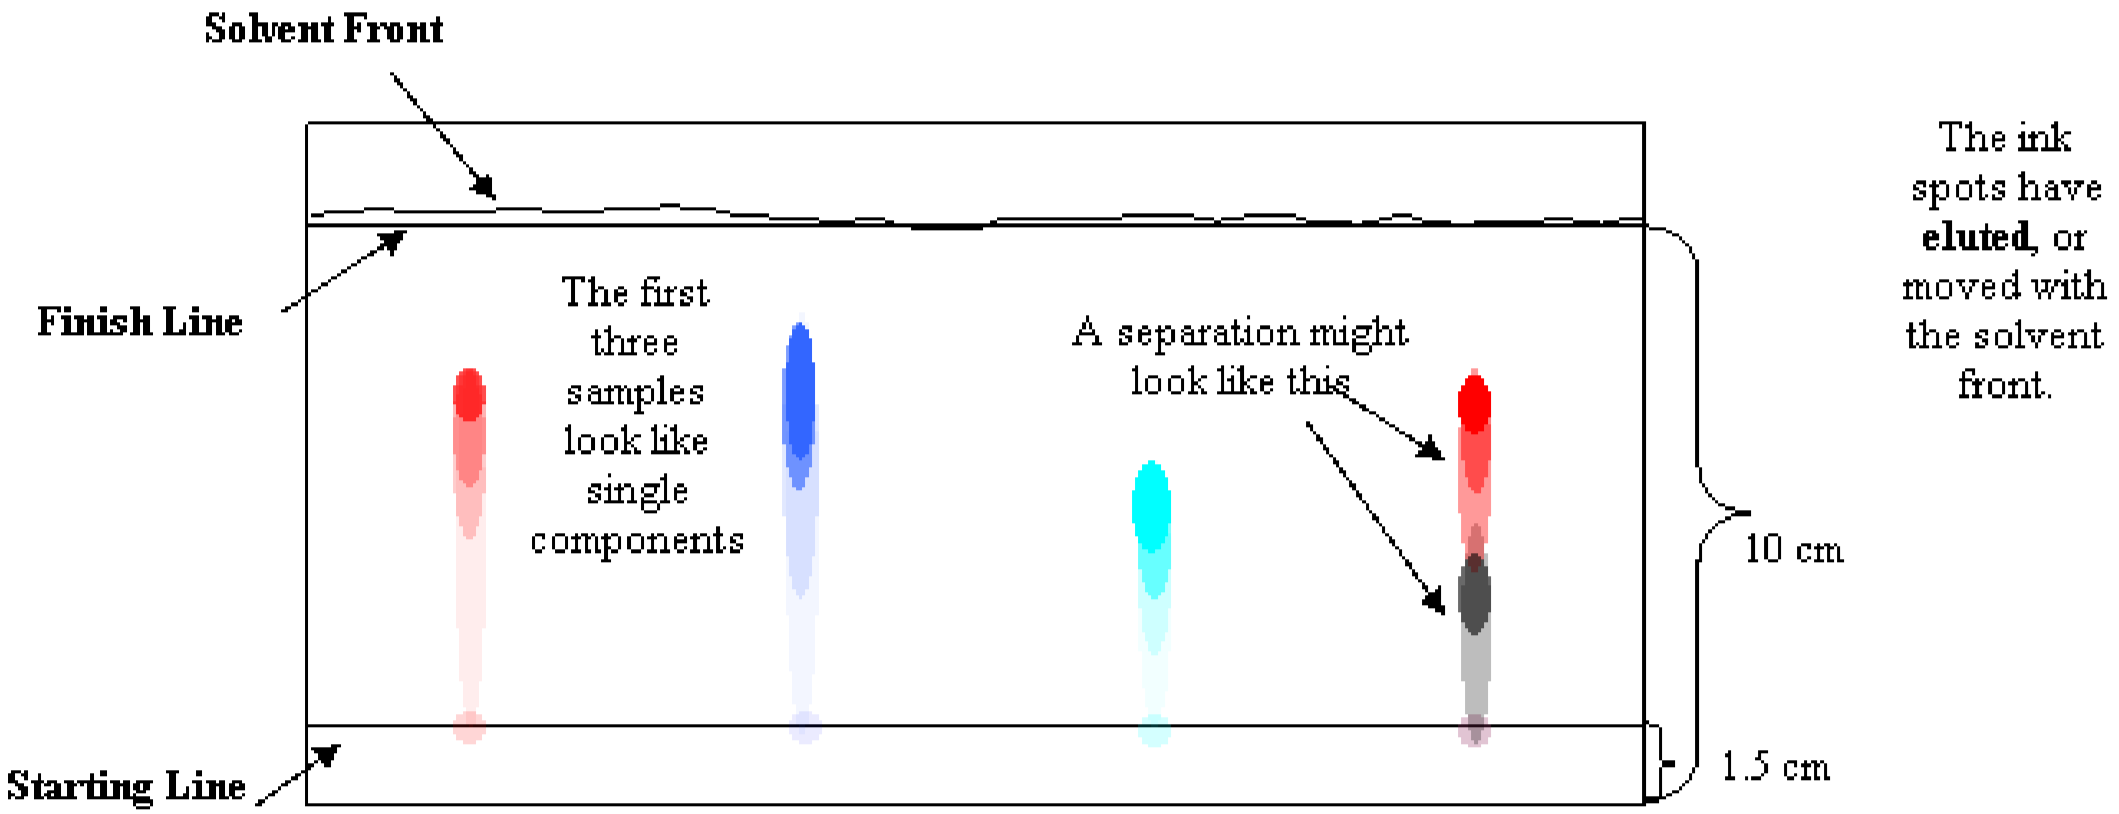
Figure 2 shows a typical paper chromatogram. There are a few difficulties commonly encountered in the elution process. One problem is that spots tend the spread out as they elute, and can bleed into each other as they proceed up the paper. This can be confusing when interpreting the chromatogram. To avoid this problem, space the spots of sample far apart and make repeated, tiny applications of sample to prevent spreading. Another problem is an uneven solvent front. This can happen if the beaker is nudged – if the mobile phase sloshes inside, the elution trails may travel diagonally, which makes interpretation very difficult. This can also happen if the two edges of the chromatogram are allowed to touch when they are stapled or taped together to form a cylinder.
A component with a given solubility travels along with the mobile phase at one rate, regardless of what other components are present in the sample. If the red part of purple ink travels at the same rate as pure red ink, and both stop in the same place, the two should be the same red ink. The two red spots should have the same Retention Factor, Rf. The Rf is the distance, \(D\), traveled by the spot divided by the distance traveled by the eluting solution, or Solvent Front, \(F\).
\[R_f=\frac{D}{F} \label{1}\]
Comparing the Rf values allows the confirmation of a component in multiple samples because unique components have unique Rf values.
Procedure
Materials and Equipment
Materials: chromatography paper, gel pens, and eluting solution.
Equipment: 600-mL beaker, pencil, ruler, plastic wrap, tape and paper towels.
Wear safety goggles at all times. Use eluting solution only in the hood. Do not breathe fumes from the eluting solution. Be sure to handle only the dry part or the chromatogram when removing it from the beaker. Wash hands thoroughly if the eluting solution touches your skin. Personal protective equipment (PPE) required: lab coat, safety goggles, closed-toe shoes, gloves
Part A: Preparation of Chromatography Paper
- Wash your hands thoroughly to remove excess oils from your skin. Obtain a ruler and a piece of chromatography paper from your instructor. Handle the paper only on the edges to avoid leaving fingerprints, as these may hinder the elution process.
- Place the chromatography paper on a sheet of clean notebook paper or paper towel to avoid picking up dirt or contaminants from the bench top. Orient the paper into a “landscape” position and write your name on the top edge of the paper in one corner. Using a pencil and ruler to measure accurately, draw a straight line across the paper, about 1.5 cm above the bottom edge. This is the starting line. Draw another line about 10 cm above the bottom edge. This is the finish line.
- On the starting line, measure in from one side about 2.5 cm and lightly draw a small “X” centered on the starting line. Draw seven more, 1.5 cm apart.
- In the center of each X, make a small spot of ink color in this order:
black, burgundy, red, pink, violet, turquoise, green, blue
When you have finished, you should have something that looks like Figure 3.

Figure 3: Prepared Chromatography Paper
- Go back over each ink spot a second time to ensure there is enough ink in the spot.
- Obtain a small piece of tape and gently curl the paper into a cylinder, with the spots on the outside. Tape the ends together near the top and bottom, taking care that the two edges of the paper do not touch. If they do touch, the eluent will creep on a diagonal, and the spots will run together, or not in straight lines.
Part B: Acquisition of Chromatogram
- Take a 500-mL beaker and pour about 25-mL of eluting solution into the beaker. Obtain a piece of plastic wrap to cover the top.
- Gently place the paper cylinder into the beaker and cover the top with the plastic wrap. Remember that the spots must be above the liquid level for the experiment to work. Watch the eluent creep up the paper until it begins to move some of the ink. It will take about 45-90 minutes for the solvent front to reach the finish line.
- When the solvent front reaches the finish line, remove the paper from the beaker, being careful to touch only the top. Let excess eluent drip into the beaker. Gently remove the tape and lay the chromatogram on a piece of paper towel in the hood. Leave the paper in the fume hood, where it will dry completely. If needed, use a heat lamp (in the fume hood) to dry the chromatogram; if using the heat lamp, allow 5-10 minutes to dry.
Part C: Interpretation of Chromatogram
- Write the names of the original ink colors beneath each “X” mark (from the order you added the colors). Each ink sample should no longer be on the “X” mark, and have travelled up the paper, becoming one or more separate color spots between the starting and finish lines. Circle around each color spot.
- Use a ruler and draw a plus sign in the center of each spot. Measure the distance from the starting line to each plus sign. Record this distance for each spot on your lab report. These are the \(D\) values, in cm.
- Measure the distance between the starting line and the finish line or, the farthest up that the solvent front reached. Record this distance. This is the \(F\) value, in cm.
- Calculate the retention factor (Rf) for each spot and record the values in your lab report.
- You and your lab partner will hand in your lab reports at the same time, with the paper chromatogram stapled to the lab reports.
Lab Report: Paper Chromatography of Gel Ink Pens
Part C: Interpretation of Chromatogram
Experimental Data
\(F\) value (the distance traveled by the eluting solution):
Record \(D\) values for each eluted spot to the nearest 0.1 cm. Draw an X through any unused boxes.
|
Ink Color |
Distance(s) Traveled by Eluted Spot(s), \(D\) |
||
|---|---|---|---|
Calculate and record the Rf value for each eluted spot, using Equation \ref{1}:
| Ink Color |
Rf Value for Eluted Spot |
||
|---|---|---|---|
Show calculations for Rf below for the Purple marker:
Data Analysis
- This lab employs chromatography to separate the components in ink. What other applications can we use chromatography for?
- Are any of the Rf values in the table above the same (or similar, within 0.1)? What would the same or similar Rf values indicate?
- What are the units for Rf values?
- Record ink colors in the appropriate column; for mixtures, list the colors of the components.
|
Mixtures/Component Colors |
Single-Component Colors |
|---|---|
- Which color travelled farthest with the mobile phase? What does this indicate about that component’s attraction to the mobile phase? To the stationary phase?
- Which of the materials tested (gel ink pen and colored markers) had an Rf value of zero? What does this indicate about that component’s attraction to the mobile phase? To the stationary phase?
- Why is it necessary to use a pencil to mark the lines and X’s on the paper?
- The air we breathe is a mixture of different components. What is the composition of dry air, by percentage? See Fig 1.2 in Chapter 1 of the text.