
10: Determination of the Molar Mass by Freezing Point Depression (Experiment)
- Page ID
- 94009
\( \newcommand{\vecs}[1]{\overset { \scriptstyle \rightharpoonup} {\mathbf{#1}} } \)
\( \newcommand{\vecd}[1]{\overset{-\!-\!\rightharpoonup}{\vphantom{a}\smash {#1}}} \)
\( \newcommand{\dsum}{\displaystyle\sum\limits} \)
\( \newcommand{\dint}{\displaystyle\int\limits} \)
\( \newcommand{\dlim}{\displaystyle\lim\limits} \)
\( \newcommand{\id}{\mathrm{id}}\) \( \newcommand{\Span}{\mathrm{span}}\)
( \newcommand{\kernel}{\mathrm{null}\,}\) \( \newcommand{\range}{\mathrm{range}\,}\)
\( \newcommand{\RealPart}{\mathrm{Re}}\) \( \newcommand{\ImaginaryPart}{\mathrm{Im}}\)
\( \newcommand{\Argument}{\mathrm{Arg}}\) \( \newcommand{\norm}[1]{\| #1 \|}\)
\( \newcommand{\inner}[2]{\langle #1, #2 \rangle}\)
\( \newcommand{\Span}{\mathrm{span}}\)
\( \newcommand{\id}{\mathrm{id}}\)
\( \newcommand{\Span}{\mathrm{span}}\)
\( \newcommand{\kernel}{\mathrm{null}\,}\)
\( \newcommand{\range}{\mathrm{range}\,}\)
\( \newcommand{\RealPart}{\mathrm{Re}}\)
\( \newcommand{\ImaginaryPart}{\mathrm{Im}}\)
\( \newcommand{\Argument}{\mathrm{Arg}}\)
\( \newcommand{\norm}[1]{\| #1 \|}\)
\( \newcommand{\inner}[2]{\langle #1, #2 \rangle}\)
\( \newcommand{\Span}{\mathrm{span}}\) \( \newcommand{\AA}{\unicode[.8,0]{x212B}}\)
\( \newcommand{\vectorA}[1]{\vec{#1}} % arrow\)
\( \newcommand{\vectorAt}[1]{\vec{\text{#1}}} % arrow\)
\( \newcommand{\vectorB}[1]{\overset { \scriptstyle \rightharpoonup} {\mathbf{#1}} } \)
\( \newcommand{\vectorC}[1]{\textbf{#1}} \)
\( \newcommand{\vectorD}[1]{\overrightarrow{#1}} \)
\( \newcommand{\vectorDt}[1]{\overrightarrow{\text{#1}}} \)
\( \newcommand{\vectE}[1]{\overset{-\!-\!\rightharpoonup}{\vphantom{a}\smash{\mathbf {#1}}}} \)
\( \newcommand{\vecs}[1]{\overset { \scriptstyle \rightharpoonup} {\mathbf{#1}} } \)
\(\newcommand{\longvect}{\overrightarrow}\)
\( \newcommand{\vecd}[1]{\overset{-\!-\!\rightharpoonup}{\vphantom{a}\smash {#1}}} \)
\(\newcommand{\avec}{\mathbf a}\) \(\newcommand{\bvec}{\mathbf b}\) \(\newcommand{\cvec}{\mathbf c}\) \(\newcommand{\dvec}{\mathbf d}\) \(\newcommand{\dtil}{\widetilde{\mathbf d}}\) \(\newcommand{\evec}{\mathbf e}\) \(\newcommand{\fvec}{\mathbf f}\) \(\newcommand{\nvec}{\mathbf n}\) \(\newcommand{\pvec}{\mathbf p}\) \(\newcommand{\qvec}{\mathbf q}\) \(\newcommand{\svec}{\mathbf s}\) \(\newcommand{\tvec}{\mathbf t}\) \(\newcommand{\uvec}{\mathbf u}\) \(\newcommand{\vvec}{\mathbf v}\) \(\newcommand{\wvec}{\mathbf w}\) \(\newcommand{\xvec}{\mathbf x}\) \(\newcommand{\yvec}{\mathbf y}\) \(\newcommand{\zvec}{\mathbf z}\) \(\newcommand{\rvec}{\mathbf r}\) \(\newcommand{\mvec}{\mathbf m}\) \(\newcommand{\zerovec}{\mathbf 0}\) \(\newcommand{\onevec}{\mathbf 1}\) \(\newcommand{\real}{\mathbb R}\) \(\newcommand{\twovec}[2]{\left[\begin{array}{r}#1 \\ #2 \end{array}\right]}\) \(\newcommand{\ctwovec}[2]{\left[\begin{array}{c}#1 \\ #2 \end{array}\right]}\) \(\newcommand{\threevec}[3]{\left[\begin{array}{r}#1 \\ #2 \\ #3 \end{array}\right]}\) \(\newcommand{\cthreevec}[3]{\left[\begin{array}{c}#1 \\ #2 \\ #3 \end{array}\right]}\) \(\newcommand{\fourvec}[4]{\left[\begin{array}{r}#1 \\ #2 \\ #3 \\ #4 \end{array}\right]}\) \(\newcommand{\cfourvec}[4]{\left[\begin{array}{c}#1 \\ #2 \\ #3 \\ #4 \end{array}\right]}\) \(\newcommand{\fivevec}[5]{\left[\begin{array}{r}#1 \\ #2 \\ #3 \\ #4 \\ #5 \\ \end{array}\right]}\) \(\newcommand{\cfivevec}[5]{\left[\begin{array}{c}#1 \\ #2 \\ #3 \\ #4 \\ #5 \\ \end{array}\right]}\) \(\newcommand{\mattwo}[4]{\left[\begin{array}{rr}#1 \amp #2 \\ #3 \amp #4 \\ \end{array}\right]}\) \(\newcommand{\laspan}[1]{\text{Span}\{#1\}}\) \(\newcommand{\bcal}{\cal B}\) \(\newcommand{\ccal}{\cal C}\) \(\newcommand{\scal}{\cal S}\) \(\newcommand{\wcal}{\cal W}\) \(\newcommand{\ecal}{\cal E}\) \(\newcommand{\coords}[2]{\left\{#1\right\}_{#2}}\) \(\newcommand{\gray}[1]{\color{gray}{#1}}\) \(\newcommand{\lgray}[1]{\color{lightgray}{#1}}\) \(\newcommand{\rank}{\operatorname{rank}}\) \(\newcommand{\row}{\text{Row}}\) \(\newcommand{\col}{\text{Col}}\) \(\renewcommand{\row}{\text{Row}}\) \(\newcommand{\nul}{\text{Nul}}\) \(\newcommand{\var}{\text{Var}}\) \(\newcommand{\corr}{\text{corr}}\) \(\newcommand{\len}[1]{\left|#1\right|}\) \(\newcommand{\bbar}{\overline{\bvec}}\) \(\newcommand{\bhat}{\widehat{\bvec}}\) \(\newcommand{\bperp}{\bvec^\perp}\) \(\newcommand{\xhat}{\widehat{\xvec}}\) \(\newcommand{\vhat}{\widehat{\vvec}}\) \(\newcommand{\uhat}{\widehat{\uvec}}\) \(\newcommand{\what}{\widehat{\wvec}}\) \(\newcommand{\Sighat}{\widehat{\Sigma}}\) \(\newcommand{\lt}{<}\) \(\newcommand{\gt}{>}\) \(\newcommand{\amp}{&}\) \(\definecolor{fillinmathshade}{gray}{0.9}\)- To determine the molar mass of an unknown solid using the colligative property of freezing point depression.
When a small amount of nonvolatile solute is dissolved in a volatile solvent, the vapor pressure of the solvent over the solution will be less than the vapor pressure of the pure solvent at the same temperature. Therefore, the temperature at which the equilibrium vapor pressure reaches atmospheric pressure is higher for the solution than for the pure solvent. As a result the boiling point of the solution, \(T_{b}\), is higher than the boiling point of the pure solvent, \(T^{o}_{b}\). The amount by which the boiling point of the solution exceeds the boiling point of the pure liquid, \(\Delta T_{b} = T_{b} - T^{o}_{b}\), is called the boiling point elevation. Similarly, because of the reduction in vapor pressure over the solution the freezing point of the solution, \(T_{f}\), is lower than the freezing point of the pure solvent, \(T^{o}_{f}\). The amount by which the freezing point of the solution is decreased from that of the pure liquid, \(\Delta T_{f} = T^{o}_{f} - T_{f}\), is called the freezing point depression. Figure 1 below illustrates this behavior for water.

Figure 1
The magnitude of the freezing depression produced by a solute is proportional to its colligative molality, \(m_{c}\):
\[\Delta T_{f} =T^{o}_{f} - T_{f} =K_{f} \times m_{c} \label{1}\]
\(K_{f}\) is known as the freezing point depression constant, and depends on the solvent used.
In this experiment you will determine the molar mass of an unknown solid by dissolving a pre-weighed sample in a solvent, and measuring the resulting freezing point depression of the solvent. From the measured \(\Delta T_{f}\) and the known \(K_{f}\) value of the solvent, you can then determine the value of \(m_{c}\) using the above Equation \ref{1}. The colligative molality, \(m_{c}\), is related to the molality of the solution, \(m\), by the expression:
\[m_{c} =i \times m \label{2}\]
where \(i\) is the number of solute particles produced per formula unit of dissolved solute, and \(m\) is the number of moles of solute per kilogram of solvent. Since only non-dissociating solutes will be used in this experiment, the value of \(i\) for your unknown solute can be considered to be 1. Thus, you may assume that \(m_{c} = m\). From the experimentally determined value of \(m\) and the mass of solute added, you can determine the molar mass of the unknown solute.
The solvent that will be used in this experiment is para-dichlorobenzene, shown in Figure 2 below. Para-dichlorobenzene has a \(K_{f}\) value of 7.10 °C·kg·mol-1. It also has a convenient freezing point that is just over 60 °C.
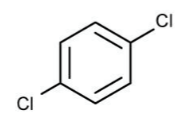
Figure 2
In order to determine the freezing point of this pure solvent you must first heat it in a test tube to over 60 °C using a hot water bath, and then measure the temperature as a function of time as the liquid cools. At first the temperature will fall quite rapidly. When the freezing point is reached, solid will begin to form, and the temperature will tend to hold steady until the sample is all solid. This behavior is shown in Figure 3 below. The freezing point of the pure liquid is the constant temperature observed while the liquid is freezing to a solid.
The cooling behavior of a solution is somewhat different from that of a pure liquid, also shown in Figure 3. As discussed earlier, the temperature at which a solution freezes is lower than that for the pure solvent. In addition, there is a slow gradual fall in temperature as freezing proceeds. The best value for the freezing point of the solution is obtained by drawing two straight lines connecting the points on the temperature-time graph. The first line connects points where the solution is all liquid. The second line connects points where solid and liquid coexist. The point where the two lines intersect is the freezing point of the solution.
Note that when the solid first appears the temperature may fall below the freezing point, but then it comes back up as more of the solid forms. This effect is called supercooling, and is a phenomenon that may occur with both the pure liquid and the solution (see Figure 3). When drawing the straight line in the solid-liquid region of the graph, ignore points where supercooling is observed. To establish the proper straight line in the solid-liquid region it is necessary to record the temperature until the trend with time is smooth and clearly established.
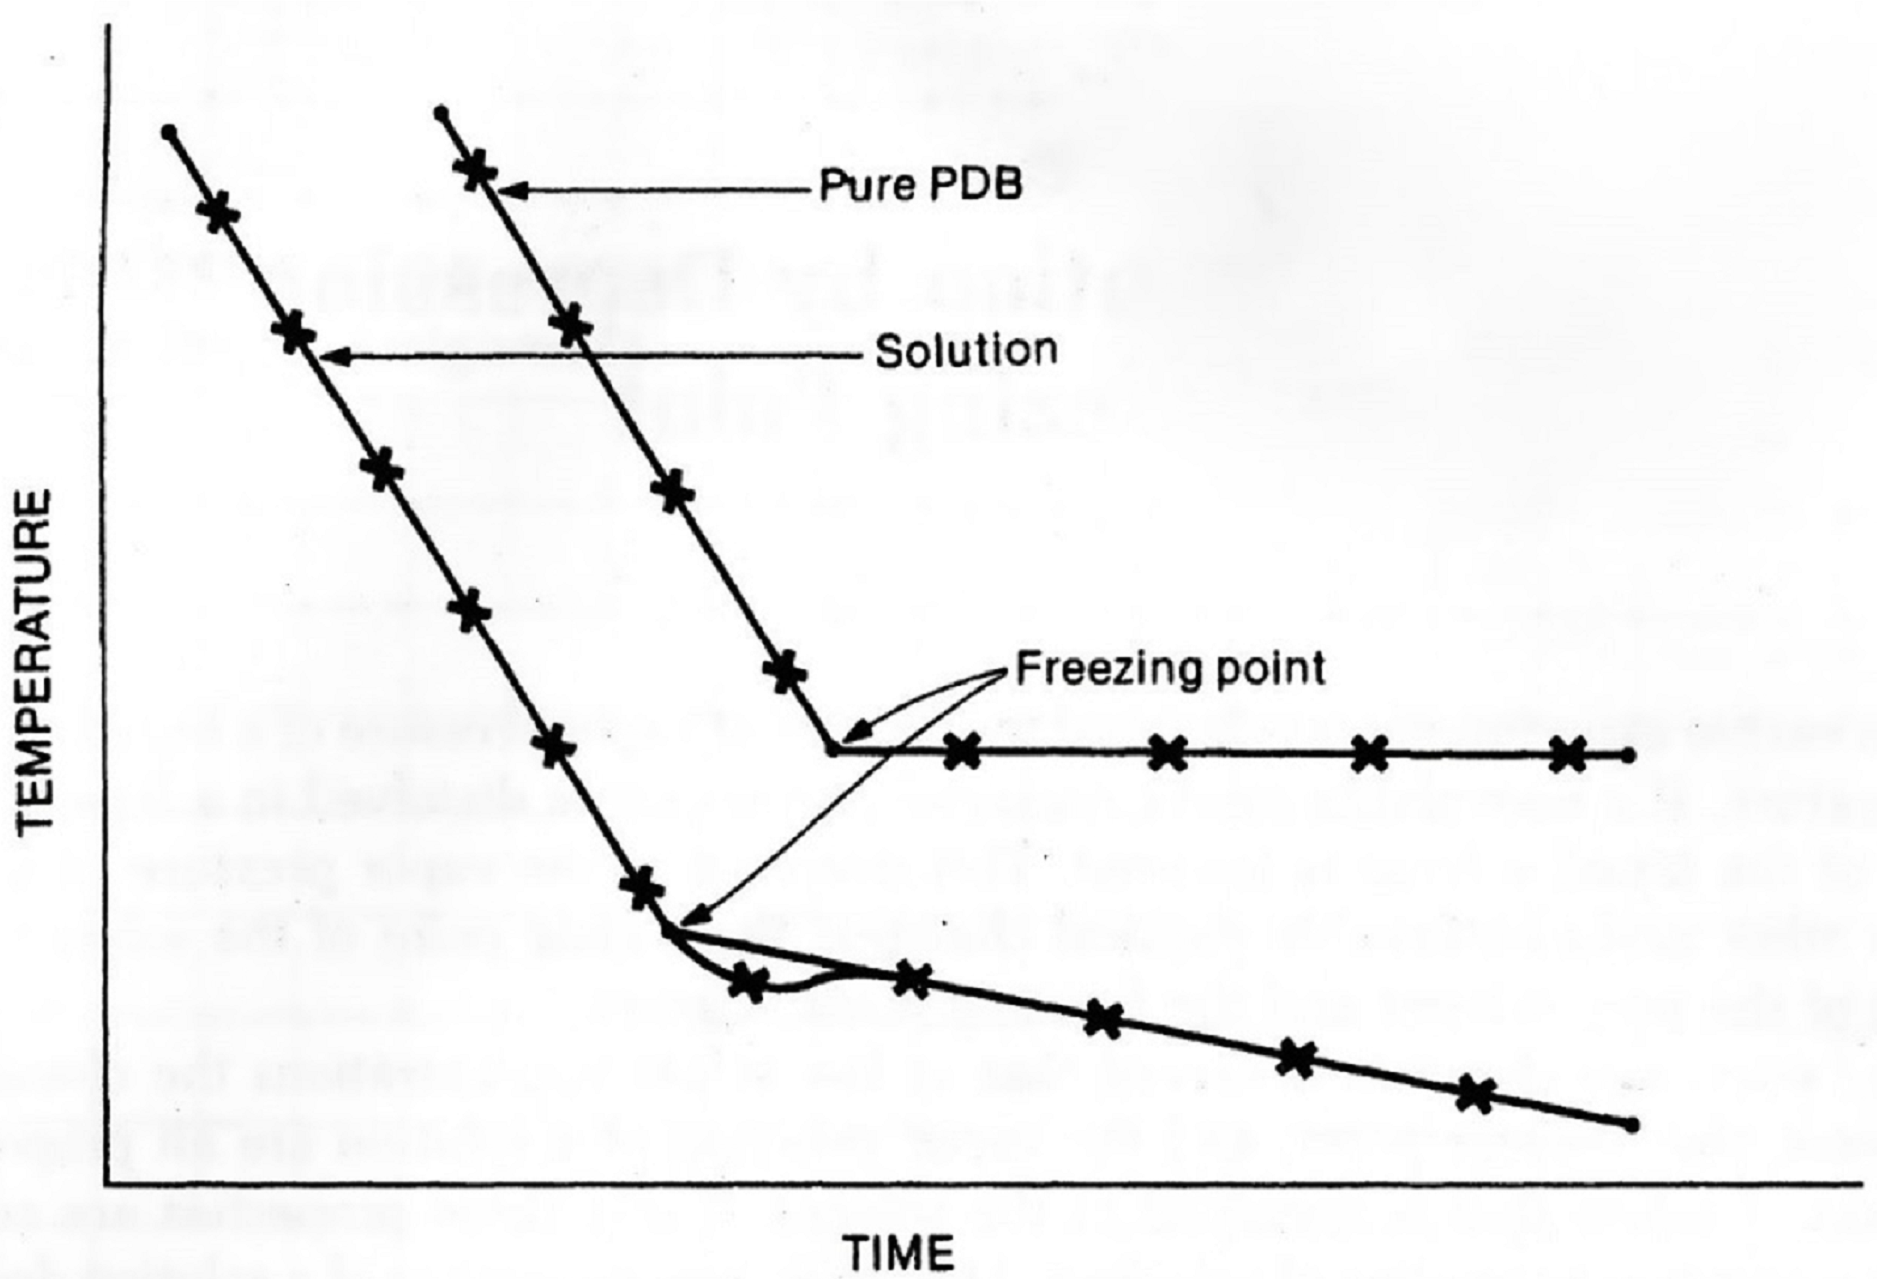
Figure 3
Procedure
Chemicals: Para-dichlorobenzene (PDB), unknown sample, acetone
Equipment: 600-mL beaker, large test tube, wire gauze, thermometer, two utility clamps, stand with ring clamp, Bunsen burner, split stopper, looped glass stirring rod, beaker tongs**
**Be certain to use beaker tongs and not crucible tongs; beaker tongs have a rubber coating on the end where they grip the beaker; crucible tongs do not.
- The PPE for this lab includes safety goggles, lab coat and nitrile gloves.
- Para-dichlorobenzene is used in mothballs and urinal cakes, and so it may have a familiar smell, however direct inhalation of its vapors may be harmful or even toxic. Students should avoid skin contact with para-dichlorobenzene and direct inhalation of its vapors. All heating of para-dichlorobenzene must be done under a fume hood.
Waste Disposal
All chemicals used must be disposed of in the proper waste container. The acetone and para-dichlorobenzene must not go down the sink!
Part 1: Determining the Freezing Point of Pure PDB
- Assemble a stand with ring clamp and a wire gauze inside one of the fume hoods. Place a Bunsen burner below the wire gauze adjusting the height so that the flame will be in direct contact with the center of the wire gauze. Fill a 600-mL beaker with tap water to just a few centimeters below the brim. Place the beaker of water onto the wire gauze. This will serve as a hot water bath for the experiment. Use a thermometer to monitor the temperature of the water bath. Begin warming the water while setting up the rest of the experiment, but do not allow the temperature to rise too much above 60 °C.
- Weigh a clean dry large test tube using an electronic balance, and record its mass. Add about 30 grams of para-dichlorobenzene (PDB) to the test tube. Reweigh and record the mass of the test tube and the PDB. Calculate the mass of PDB in the test tube by difference.
- Use your utility clamp to clamp the large test tube containing the PDB to the ring stand as shown in Figure 4 (we shall add the thermometer and stirrer presently).

Figure 4
- Insert your thermometer into the split rubber stopper by prying apart the stopper and carefully sliding it over the middle of the thermometer. You should not have to force the thermometer at any time during this process. Insert the stirring rod into the smaller hole in the stopper so that the loop at the end surrounds the thermometer as shown in Figure 4.
- Continue to heat the water bath gently, allowing the temperature to rise slowly above 60 °C. As the temperature of the water bath reaches the melting point of the PDB, it will begin to melt. After most of the solid PDB appears to have melted, insert the glass stirrer and thermometer into the PDB. Support these by clamping the split rubber stopper to the ring stand as shown in Figure 4. Adjust the bottom of the thermometer bulb so that it is about 1 cm above the bottom of the large test tube. Stir the contents of the large test tube by raising the glass loop up and down slowly to melt any remaining solid PDB.
- When the temperature of the PDB reaches about 65 °C stop heating. Turn off the Bunsen burner and carefully lower the iron ring and water bath. Using your beaker tongs, place the beaker of hot water onto the lab bench well away from the test tube. Dry off the outside of the test tube using a paper towel.
- Monitor the temperature of the PDB as it cools. Stir the liquid slowly but continuously to help minimize supercooling. When the temperature of the PDB reaches 62 °C begin recording its temperature to the nearest tenth of a degree every 30 seconds. Continue for at least 4 minutes after the first solid starts to appear, or until the liquid has solidified to a point that you are no longer able to stir it. Near the melting point you will observe crystals of PDB in the liquid, and these will increase in amount as the cooling proceeds. Note the temperature at which these crystals first start to appear.
Part 2: Determining the Freezing Point of PBD with about 2 g Unknown Solute
- Weigh your unknown sample and its container on the electronic balance and record this mass on your data sheet. Carefully transfer about 2 grams of the unknown solid into the large test tube, taking great care that none of the unknown sample is spilled during this process. If you do spill some you will need to start this step over with a fresh sample of weighed PDB. After transferring some of the unknown, reweigh the remaining unknown sample and its container. Calculate the mass of unknown sample transferred to the test tube by difference. The amount you added should be between 1 and 3 grams. If you transferred less than 1 gram of unknown, you will need to add more unknown to the large test tube and reweigh before proceeding.
- Raise the hot water bath around the large test tube and heat the PDB-unknown mixture until it is completely melted. Stir well to mix the unknown with the PDB thoroughly. When the temperature of the mixture reaches 65 °C stop heating. Remove the hot water bath as before, and dry off the outside of the test tube with a paper towel.
- Monitor the temperature of the PBD-unknown mixture as it cools. Stir the liquid slowly but continuously to help minimize supercooling. When the temperature of the mixture reaches 60 °C begin recording its temperature to the nearest tenth of a degree every 30 seconds. Continue for at least 4 minutes after the first solid starts to appear, or until the mixture has solidified to a point that you are no longer able to stir it. Note the temperature at which crystals first start to appear.
- The dependence of temperature on time for the mixture should be similar to that observed for the pure PBD, except that the first crystals should appear at a lower temperature for the mixture. There may be some supercooling, as evidenced by a rise in temperature shortly after the first appearance of crystals.
Part 3: Determining the Freezing Point of PDB with about 4 g Unknown Solute
- Weigh your unknown sample and its container on the electronic balance again, and record this mass on your data sheet. Carefully transfer another 2 grams of the unknown solid into the large test tube, taking great care that none of the unknown sample is spilled during this process. If you do spill some you will need to start this step over with a fresh sample of weighed PDB and about 4 grams of unknown. After transferring this additional unknown to the large test tube, weigh the remaining unknown sample and its container. Calculate the mass of unknown sample transferred to the test tube in this step by difference. Add this mass to the mass of unknown transferred in Step 8 to obtain the total mass of unknown added to the large test tube.
- Raise the hot water bath around the large test tube and heat the PDB-unknown mixture until both the PDB and unknown solid are completely melted. Stir well to mix the additional unknown with the PDB thoroughly. When the temperature of the mixture reaches 60 °C stop heating. Remove the hot water bath as before, and dry off the outside of the test tube using a paper towel.
- Monitor the temperature of the PDB-unknown mixture as before. When the temperature of the mixture reaches about 57 °C begin recording its temperature to the nearest tenth of a degree every 30 seconds. Continue for at least 4 minutes after the first solid starts to appear, or until the mixture has solidified to a point that you are no longer able to stir it. Note the temperature at which crystals first start to appear. Once again, some supercooling might occur.
Clean Up
- When you have completed the experiment, melt the PDB-unknown mixture as before and then pour the warm liquid quickly into the waste container. Rinse any remaining residue from the side of your test tube, thermometer, and stirrer directly into the waste container using the small squirt bottle of acetone provided. Try to use as little acetone as possible, but be certain that all of the PDB has been removed before replacing the glassware in your locker. Do not allow any of the acetone or PDB-unknown mixture or rinse to go down the sink.
- Be sure to replace your ring stand at the back of the room and return the clamps and other equipment to your locker or the stockroom as appropriate.
Lab Report: Determination of Molar Mass by Freezing Point Depression
Experimental Data
Unknown ID number: ____________________
| Part 1: Freezing Point of Pure PDB | |
|---|---|
| Mass of large empty test tube | |
| Mass of test tube & PDB | |
| Mass of PDB (by difference) | |
| Part 2: Freezing Point of PDB-Unknown Mixture (~2 g) | |
|---|---|
| Mass of vial & unknown | |
| Mass of vial & unknown minus Sample I | |
| Mass of unknown added (by difference) | |
| Part 3: Freezing Point of PDB-Unknown Mixture (~4 g) | |
|---|---|
| Mass of vial & unknown | |
| Mass of vial & unknown minus Sample II | |
| Mass of unknown added (by difference) | |
| Total mass of unknown added | |
Temperature Measurements: Record the temperature every 30 seconds as the pure solvent and two solutions are cooled. Note the temperature at which any solid first appears.
| Time Elapsed (minutes) | Temperature (°C) | ||
|---|---|---|---|
| --- | Pure Solvent (PDB only) | Solution I (PDB + Sample I) | Solution II (PDB + Sample II) |
| 0 | |||
| 0.5 | |||
| 1.5 | |||
| 2 | |||
| 2.5 | |||
| 3 | |||
| 3.5 | |||
| 4 | |||
| 4.5 | |||
| 5 | |||
| 5.5 | |||
| 6 | |||
| 6.5 | |||
| 7 | |||
| 7.5 | |||
| 8 | |||
| 8.5 | |||
| 9 | |||
| 9.5 | |||
| 10 | |||
| 10.5 | |||
| 11 | |||
| 11.5 | |||
| 12 | |||
| 12.5 | |||
| 13 | |||
| 13.5 | |||
Graphical Analysis of Data
Use Excel to create three separate graphs of “Temperature versus Time” for the pure solvent and the two solutions studied. Each graph should have an appropriate title and labeled axes with an appropriate scale. Add two trendlines to the data points of each graph. You can do this by hand with a ruler or by using Excel. The first line is applied to data points that correspond to the cooling of the liquid stat: these are the points on the steep part of the graph. The second line is applied to data points that correspond to the co-existence of both the solid and liquid (freezing): these are the points on the part of the graph where the temperature levels out. Extrapolate the two trendlines towards each other until they intersect. The temperature at the point of intersection is the solvent freezing point and should be clearly shown on each graph. Attach your three graphs to this report.
Record the freezing point temperatures obtained from the graphs below:
- Pure PDB ________________°C
- Solution I _________________°C
- Solution II ________________°C
Calculation of Molar Mass
Complete the table below with the results of your calculations. Be sure to include all units. Note that \(K_{f}\) PDB = 7.10 °C·kg·mol-1.
|
Solution I |
Solution II |
|
|---|---|---|
|
Mass of PDB added |
||
|
Total mass of unknown added |
||
|
Freezing point of pure PDB |
||
|
Freezing point of solution |
||
|
Total Freezing point depression, \(\Delta T_{f}\) |
||
|
Molality of solution |
||
|
Moles of unknown in solution |
||
|
Molar Mass of unknown |
- Unknown number ______________________ has an average molar mass of _______________________g/mol.
- On a separate sheet of paper, show the equations used and calculations performed for molality of the solutions, moles of unknown in the solutions, and molar mass of the unknown. Attach your sheet to this report.
Questions
- Look up the freezing point of para-dichlorobenzene. This may be found in the CRC Handbook of Chemistry and Physics (library) or from various online sources.
- Freezing Point of PDB =_________________________
- Reference source used:
- Using the freezing point from your reference source, determine the percentage error in your experimentally measured freezing point. Show your calculation below, and be sure to report your answer to the correct number of significant figures.
- Suppose you find out that the actual molar mass of your unknown solid is exactly three times larger than the value you determined experimentally. What could you conclude about the nature of your unknown solid and the assumptions you made in your calculations in such a case? Explain.
Pre-Laboratory Assignment: Determination of Molar Mass by Freezing Point Depression
- Camphor melts at 179.8oC and has a freezing point depression constant, \(K_{f}\) = 40 oC/molal. When 0.186 g of an unknown organic solid is dissolved in 22.01 g of liquid camphor, the freezing point of the mixture is found to be 176.7oC. What is the molar mass of the solute?
- A particular unknown solid depresses the freezing point of PDB (\(K_{f}\) = 7.1oC/molal) by 3.5oC. If you dissolve the same solid in \(\ce{H2O}\) (\(K_{f}\) = 1.86oC/molal) to the same final molality as you had it in the PDB, what would the change in freezing point be?
- You are instructed to add about 2 g of the unknown solid when determining the freezing point of the solution. Suppose you accidentally add 5 g of solid. Will the measured freezing point of the solution be higher or lower as a result of this mistake? Explain.
- Cleaning PDB from the test tube after the experiment could be a long and arduous process. Describe the procedure that you will use to clean PDB (and the unknown solid) from your test tube after your experiments are complete.