
Background
- Page ID
- 123059

\( \newcommand{\vecs}[1]{\overset { \scriptstyle \rightharpoonup} {\mathbf{#1}} } \)
\( \newcommand{\vecd}[1]{\overset{-\!-\!\rightharpoonup}{\vphantom{a}\smash {#1}}} \)
\( \newcommand{\dsum}{\displaystyle\sum\limits} \)
\( \newcommand{\dint}{\displaystyle\int\limits} \)
\( \newcommand{\dlim}{\displaystyle\lim\limits} \)
\( \newcommand{\id}{\mathrm{id}}\) \( \newcommand{\Span}{\mathrm{span}}\)
( \newcommand{\kernel}{\mathrm{null}\,}\) \( \newcommand{\range}{\mathrm{range}\,}\)
\( \newcommand{\RealPart}{\mathrm{Re}}\) \( \newcommand{\ImaginaryPart}{\mathrm{Im}}\)
\( \newcommand{\Argument}{\mathrm{Arg}}\) \( \newcommand{\norm}[1]{\| #1 \|}\)
\( \newcommand{\inner}[2]{\langle #1, #2 \rangle}\)
\( \newcommand{\Span}{\mathrm{span}}\)
\( \newcommand{\id}{\mathrm{id}}\)
\( \newcommand{\Span}{\mathrm{span}}\)
\( \newcommand{\kernel}{\mathrm{null}\,}\)
\( \newcommand{\range}{\mathrm{range}\,}\)
\( \newcommand{\RealPart}{\mathrm{Re}}\)
\( \newcommand{\ImaginaryPart}{\mathrm{Im}}\)
\( \newcommand{\Argument}{\mathrm{Arg}}\)
\( \newcommand{\norm}[1]{\| #1 \|}\)
\( \newcommand{\inner}[2]{\langle #1, #2 \rangle}\)
\( \newcommand{\Span}{\mathrm{span}}\) \( \newcommand{\AA}{\unicode[.8,0]{x212B}}\)
\( \newcommand{\vectorA}[1]{\vec{#1}} % arrow\)
\( \newcommand{\vectorAt}[1]{\vec{\text{#1}}} % arrow\)
\( \newcommand{\vectorB}[1]{\overset { \scriptstyle \rightharpoonup} {\mathbf{#1}} } \)
\( \newcommand{\vectorC}[1]{\textbf{#1}} \)
\( \newcommand{\vectorD}[1]{\overrightarrow{#1}} \)
\( \newcommand{\vectorDt}[1]{\overrightarrow{\text{#1}}} \)
\( \newcommand{\vectE}[1]{\overset{-\!-\!\rightharpoonup}{\vphantom{a}\smash{\mathbf {#1}}}} \)
\( \newcommand{\vecs}[1]{\overset { \scriptstyle \rightharpoonup} {\mathbf{#1}} } \)
\(\newcommand{\longvect}{\overrightarrow}\)
\( \newcommand{\vecd}[1]{\overset{-\!-\!\rightharpoonup}{\vphantom{a}\smash {#1}}} \)
\(\newcommand{\avec}{\mathbf a}\) \(\newcommand{\bvec}{\mathbf b}\) \(\newcommand{\cvec}{\mathbf c}\) \(\newcommand{\dvec}{\mathbf d}\) \(\newcommand{\dtil}{\widetilde{\mathbf d}}\) \(\newcommand{\evec}{\mathbf e}\) \(\newcommand{\fvec}{\mathbf f}\) \(\newcommand{\nvec}{\mathbf n}\) \(\newcommand{\pvec}{\mathbf p}\) \(\newcommand{\qvec}{\mathbf q}\) \(\newcommand{\svec}{\mathbf s}\) \(\newcommand{\tvec}{\mathbf t}\) \(\newcommand{\uvec}{\mathbf u}\) \(\newcommand{\vvec}{\mathbf v}\) \(\newcommand{\wvec}{\mathbf w}\) \(\newcommand{\xvec}{\mathbf x}\) \(\newcommand{\yvec}{\mathbf y}\) \(\newcommand{\zvec}{\mathbf z}\) \(\newcommand{\rvec}{\mathbf r}\) \(\newcommand{\mvec}{\mathbf m}\) \(\newcommand{\zerovec}{\mathbf 0}\) \(\newcommand{\onevec}{\mathbf 1}\) \(\newcommand{\real}{\mathbb R}\) \(\newcommand{\twovec}[2]{\left[\begin{array}{r}#1 \\ #2 \end{array}\right]}\) \(\newcommand{\ctwovec}[2]{\left[\begin{array}{c}#1 \\ #2 \end{array}\right]}\) \(\newcommand{\threevec}[3]{\left[\begin{array}{r}#1 \\ #2 \\ #3 \end{array}\right]}\) \(\newcommand{\cthreevec}[3]{\left[\begin{array}{c}#1 \\ #2 \\ #3 \end{array}\right]}\) \(\newcommand{\fourvec}[4]{\left[\begin{array}{r}#1 \\ #2 \\ #3 \\ #4 \end{array}\right]}\) \(\newcommand{\cfourvec}[4]{\left[\begin{array}{c}#1 \\ #2 \\ #3 \\ #4 \end{array}\right]}\) \(\newcommand{\fivevec}[5]{\left[\begin{array}{r}#1 \\ #2 \\ #3 \\ #4 \\ #5 \\ \end{array}\right]}\) \(\newcommand{\cfivevec}[5]{\left[\begin{array}{c}#1 \\ #2 \\ #3 \\ #4 \\ #5 \\ \end{array}\right]}\) \(\newcommand{\mattwo}[4]{\left[\begin{array}{rr}#1 \amp #2 \\ #3 \amp #4 \\ \end{array}\right]}\) \(\newcommand{\laspan}[1]{\text{Span}\{#1\}}\) \(\newcommand{\bcal}{\cal B}\) \(\newcommand{\ccal}{\cal C}\) \(\newcommand{\scal}{\cal S}\) \(\newcommand{\wcal}{\cal W}\) \(\newcommand{\ecal}{\cal E}\) \(\newcommand{\coords}[2]{\left\{#1\right\}_{#2}}\) \(\newcommand{\gray}[1]{\color{gray}{#1}}\) \(\newcommand{\lgray}[1]{\color{lightgray}{#1}}\) \(\newcommand{\rank}{\operatorname{rank}}\) \(\newcommand{\row}{\text{Row}}\) \(\newcommand{\col}{\text{Col}}\) \(\renewcommand{\row}{\text{Row}}\) \(\newcommand{\nul}{\text{Nul}}\) \(\newcommand{\var}{\text{Var}}\) \(\newcommand{\corr}{\text{corr}}\) \(\newcommand{\len}[1]{\left|#1\right|}\) \(\newcommand{\bbar}{\overline{\bvec}}\) \(\newcommand{\bhat}{\widehat{\bvec}}\) \(\newcommand{\bperp}{\bvec^\perp}\) \(\newcommand{\xhat}{\widehat{\xvec}}\) \(\newcommand{\vhat}{\widehat{\vvec}}\) \(\newcommand{\uhat}{\widehat{\uvec}}\) \(\newcommand{\what}{\widehat{\wvec}}\) \(\newcommand{\Sighat}{\widehat{\Sigma}}\) \(\newcommand{\lt}{<}\) \(\newcommand{\gt}{>}\) \(\newcommand{\amp}{&}\) \(\definecolor{fillinmathshade}{gray}{0.9}\)Eutrophication and Phosphorus
Why do we care about phosphorus in natural waters? Eutrophication is one of the leading problems facing the nation’s lakes. Eutrophication is an increase in the concentration of nutrients in a lake or other body of water, often caused by the runoff of nutrients in animal waste, fertilizers or sewage from the watershed. Increased nutrients lead to an increase in primary production, which is the production of organic compounds from carbon dioxide through photosynthesis. The presence of both phosphorus and nitrogen is necessary for eutrophication to occur. However, because the concentration of phosphorus is almost always lower than that of nitrogen, the growth of algae and the onset of eutrophication is usually controlled by the amount of phosphorus present in the water. If this is the case, the concentration of phosphorus is said to be ‘limiting’.
The effect of phosphorus on lake health has been well documented (Schindler, 1977; Schindler et al 2008). Eutrophic lakes frequently experience noxious algal blooms, increased aquatic plant growth, and oxygen depletion, leading to degradation of their ecological, economic, and aesthetic value by restricting use for fisheries, drinking water, industry and recreation. One of the most objectionable symptoms of eutrophication has been the appearance of floating algal blooms. In freshwaters, these surface blooms are often of nitrogen-fixing cyanobacteria, also known as blue-green algae. In addition to coating shorelines and boat hulls with foul-smelling scum, cyanobacteria produce toxins that are dangerous to other organisms, including humans. It is widely accepted that most effective method to mitigate eutrophication and to reduce harmful algal blooms is to reduce the loading of phosphorous into fresh waters.
Phosphorus in Water and Soil
Phosphorus occurs in natural waters almost solely as phosphates, a chemical form in which each phosphorus atom is surrounded by four oxygen atoms. These are classified as orthophosphates, condensed phosphates, and organically bound phosphates. Orthophosphate, the simplest phosphate, has the chemical formula PO43-. In natural waters, orthophosphate mostly exists as dihydrogen phosphate, H2PO4- and hydrogen phosphate, HPO42-. Condensed phosphates are polyphosphates such as pyrophosphate, P2O74−, and metaphosphate, (PO3−)n. Phosphates may be in solution or a component of suspended particles; however, most phosphates are bound to soil or sediment particles or tightly conserved by organisms. Phosphorus in the environment is converted between its organic and inorganic forms due to the action of bacteria and plants in much the same way nitrogen is. Orthophosphate, the form of phosphorus used by most living things, is converted to organic phosphorus by plants and microorganisms. Organic phosphorus, in turn, is converted to inorganic phosphorus by the action of bacteria on the waste products and dead bodies of plants and animals.
Phosphorus enters the biosphere by the natural weathering of rock and from a variety of human related activities. Major sources of phosphorus include human and animal wastes, soil erosion, detergents, septic systems and runoff from farmland or lawns. Phosphorus can enter a lake either externally, from run-off or groundwater, or internally, from nutrient rich sediments on the bottom of the lake. Freshwater lakes usually contain relatively low concentrations of dissolved or soluble orthophosphate since phosphate ions react by adsorbing to soil particles or by combining with elements in sediment such as calcium, aluminum, and iron to form insoluble compounds. Adsorption is the binding of molecules or particles to a solid surface. An analysis of phosphorus often includes both soluble (dissolved) reactive phosphorus (SRP) and total phosphorus (TP). Soluble reactive phosphorus dissolves in the water and its concentration varies widely in most lakes over short periods of time as plants take it up and release it. Total phosphorus includes soluble phosphorus and the phosphorus in plant and animal fragments suspended in lake water. Total phosphorus is considered a better indicator of a lake's nutrient status because its levels remain more stable than soluble reactive phosphorus.
Lake Mendota and its Watershed
The Yahara River winds through Dane County, connecting four Madison area lakes – Mendota, Monona, Waubesa and Kegonsa (Figure 1), and finally joins the Rock River in Rock County. The land area draining to the lakes, the Yahara watershed spans 359 square miles. While most of this region remains in agricultural zoning, the watershed includes all or parts of five cities, seven villages and sixteen towns and is home to about 350,000 people. Madison spans the isthmus between Lake Mendota and Monona, the two largest lakes of the Yahara River lake system. The lakes surrounding Madison are valued by visitors and residents as a great physical resource and are highlighted as one of the reasons Madison is such a great place to live or visit.
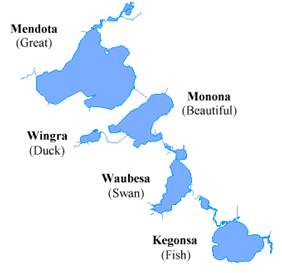
Figure 1: The Yahara River lake system includes four large lakes connected via the Yahara River.
The Yahara lakes are classified as eutrophic. Lakes are classified as oligotrophic, mesotrophic or eutrophic based on their trophic state, where trophic state is defined as the total weight of biomass in the water body. Carlson’s trophic index, which uses algal biomass as an objective classifier of a lake's trophic status, is the most commonly used trophic index (Carlson, 1977). Chlorophyll pigments, total phosphorus and Secchi depth are used to calculate the Carlson Index.
|
Table 1: Trophic classification based on chlorophyll, water clarity measurements, and total phosphorus values. (Carlson and Simpson, 1996) |
|||
|
Trophic class |
Total Phosphorus (μg/L) |
Chlorophyll (μg/L) |
Secchi Depth (m) |
|
Oligotrophic |
< 12 |
< 2.6 |
> 4 |
|
Mesotrophic |
12-24 |
2.6-7.3 |
2-4 |
|
Eutrophic |
> 24 |
> 7.3 |
< 2 |
Chlorophyll is a measure of the amount of algae present. Sechi depth, determined by slowly lowering a Secchi disk into the water until the pattern on the disk is no longer visible, is related to water turbidity. Chlorophyll, total phosphorus and Secchi depth for Lake Mendota, Lake Monona and Lake Wingra are given in Table 2. Low levels of phosphorus are associated with low levels of algae (chlorophyll), which are associated with high Secchi disk readings.
|
Table 2: Madison Lake Characteristics |
|||
|
Characteristic |
Lake Mendota |
Lake Wingra |
Lake Monona |
|
Area (ha) |
3938 |
140 |
1324 |
|
Mean Depth (m) |
12.8 |
2.7 |
8.2 |
|
Maximum Depth (m) |
25.3 |
6.7 |
22.5 |
|
Shoreline Length (km) |
33.8 |
5.9 |
20.9 |
|
Duration of ice cover (days) |
119 |
120 |
107 |
|
Water Temperature (°C) |
22.4 |
23.9 |
23.3 |
|
pH |
8.4 |
8.5 |
8.5 |
|
Total P (µg/L) |
109.5 |
40.3 |
73.5 |
|
Total N (µg/L) |
860 |
933 |
845 |
|
Secchi Depth (m) |
3.0 |
0.7 |
2.4 |
|
Chlorophyll (µg/L) |
4.8 |
10.5 |
8.1 |
|
Water temperature (0 – 2 m) and secchi from June 1 – August 31. pH and conductivity from the average of spring and fall mixis sampling. Total P and total N from spring mixis sampling. Chlorophyll (surface) from open water season. (http://lter.limnology.wisc.edu/about/lakes ) |
|||
Oligotrophic lakes have low primary productivity and often have very clear waters with good water quality. The bottom waters of oligotrophic lakes typically have ample oxygen. These lakes often support many fish species, such as lake trout, that require cold, well-oxygenated waters. Mesotrophic lakes are lakes with an intermediate level of productivity. Eutrophic lakes have high primary productivity due to high concentrations of nutrients and are subject to algal blooms resulting in poor water quality. The bottom waters of such eutrophic lakes are commonly deficient in oxygen, ranging from hypoxic (inadequate oxygen) to anoxic (no oxygen).
Lake Mendota is one of the most studied lakes in the world (Lathrop, 2007). Blue-green algal blooms have commonly occurred during the summer in Lake Mendota since the late 1880s (Birge, 1898; Lathrop, 2007); however, algal blooms did not become a concern until the mid 1940s, when sewage effluents from upstream communities increased and farmers began using larger quantities of commercial fertilizers. Water quality problems in Lake Mendota became severe in the 1960s as the amount of treated wastewater and agricultural and urban nonpoint pollution increased. In 1971, wastewater effluents from upstream communities were finally connected to the Madison Metropolitan Sewage District treatment plant, (Sonzogni and Lee, 1974); however, water quality did not substantially improve. Agricultural and urban nonpoint source pollution continues to be a problem in Lake Mendota today (Lathrop et al., 1998).
Lake Mendota’s watershed remains largely agricultural, although urban development is expanding rapidly. As in many watersheds, agricultural activities, including application of excess fertilizer and manure to crop fields, are a major source of nonpoint phosphorus input to lakes. A phosphorus budget for the Lake Mendota watershed (Bennett et al., 1999) estimated total phosphorus input to be 1,307,000 kg P yr-1 and total output to be 732,000 kg P yr-1. Out of the net 575,000 kg P yr-1 that is being added to the watershed yearly, 34,000 kg P yr-1 is washing into Lake Mendota. Efforts have been made by the Dane County Board and various environmental groups to reduce phosphorus runoff and to regulate the application of fertilizers in the Yahara watershed region.
Surface water concentrations of total phosphorus have been shown to be highly variable in Lake Mendota during the summer months, with concentrations ranging from 15 to 120 μg/L. Since most of this phosphorus is in the particulate phase, the total phosphorus concentrations are highly correlated to algal biomass (Lathrop, 2007). The average total phosphorus concentration in Wisconsin lakes is 25 μg/L (Lillie et al., 1983). Most harmful algal blooms occur in warm, slow moving, eutrophic waters in mid June through late September and are formed by photosynthetic cyanobacteria. Figure 2 shows concentrations of cyanobacteria in Lake Mendota in the summer of 2008.
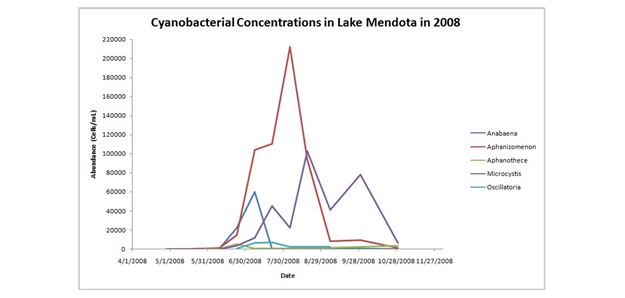
Figure 2: Concentration of Cyanobacteria in Lake Mendota in 2008 (http://blooms.uwcfl.org/mendota/). Anabaena, Aphanizomenon, Aphanothece, Microcystis, and Oscillatoria are genera of cyanobacteria that are capable of producing toxins.
Lake Mendota is the largest and deepest lake of the Yahara lakes. With a maximum depth of approximately 25 meters, Lake Mendota stratifies during the summer and mixes in the spring and fall. Thermal stratification occurs in lakes due to the large differences in density of warm and cold water. As the sun warms the lake surface in spring and early summer, the temperature difference between surface and deeper waters increases. If the lake is deep enough, the temperature difference creates a physical force strong enough to resist the wind’s mixing forces, and the lake stratifies into three layers. The warm, well-mixed upper layer is the epilimnion. The middle layer, a transitional zone that is resistant to wind mixing, where temperatures rapidly change, is called the metalimnion. The bottom layer is the colder, and relatively undisturbed hypolimnion. Summer stratification continues until fall, when surface waters begin to cool and sink. When the whole lake reaches a similar temperature, wind forces mix the lake from top to bottom in a process called fall turnover. As the surface water cools even more, it becomes less dense and floats on the top of the lake, forming ice. In spring, the ice melts and the surface water warms. The higher density of the warming water, along with wind action, causes the surface water to sink and mix with the deeper water in a process called spring turnover.
The hypolimnion is well-oxygenated after spring turnover. However, once summer stratification is established, the hypolimnion is cut off from oxygen exchange with the atmosphere and it is often too dark for algae and plants to grow and produce oxygen by photosynthesis. As the summer progresses, oxygen is consumed by bacteria and other bottom-dwelling organisms and the hypolimnion of eutrophic lakes becomes anoxic. Under anoxic conditions, phosphate, iron, manganese and sulfur become increasingly soluble and are released from bottom sediments into the hypolimnion. Sonzogni (1974) has shown that dissolved phosphorus builds up in the hypolimnion of Lake Mendota during summer stratification and is transferred and diluted throughout the entire lake at fall turnover.
Factors Controlling Phosphorus Concentrations in the Water Column
The release of phosphorus from lake sediments into the water column increases with warmer water temperature, lowered dissolved oxygen, and either higher or lower pH. When water temperatures increase during the summer, microbial activity increases decomposition at the sediment water interface, which releases organic bound phosphorus (Holdren and Armstrong, 1980). Fluctuations in oxygen concentrations and pH may occur diurnally (within a daily cycle) and seasonally. Oxygen from the water column is consumed through microbial activity and organic decomposition. Algae are net producers of oxygen via photosynthesis during daylight hours but net consumers of oxygen through respiration during darkness. The oxygen concentration in the water is therefore very high during the day and low at night. This daily cycle can also be observed in the pH of the water body which also varies widely. This variation is due to the fact that algae consume acidic carbon dioxide gas during the day and release it at night.
Phosphate forms insoluble precipitates with calcium, iron, and aluminum. In hard water areas of Wisconsin, where limestone is dissolved in the water, marl (calcium carbonate) precipitates and falls to the bottom. Marl formations adsorb phosphate, reducing its overall concentration as well as algae growth. Aquatic plants with roots in the marl bottom still can get phosphorus from sediments. Hard water lakes often have clear water, but may be weedy. In the sediment, the CaCO3 may also act as a barrier to diffusive transport of phosphorus and reduce release rates from the sediment. The coprecipitation or adsorption of phosphorus on calcium carbonate is favored by an increase in pH (Otsuki and Wetzel, 1972; House, 1990).
Studies have shown that if sediments contain iron, large amounts of phosphorus trapped in the bottom sediments may be released when the overlying water becomes anoxic (Mortimer, 1971). This process is called internal nutrient loading or recycling. Phosphorus is released from the sediments under anoxic conditions that occur when a lake stratifies and oxygen is depleted from the lower layer. Even when external sources of phosphorus have been curtailed, this internal cycling of phosphorus can continue to support explosive algal growth. In stratified lakes with an anoxic hypolimnion, phosphorus release can become an extremely large source of internal phosphorus for a lake (Nurnberg, 1984). Under oxic conditions, iron is in the Fe(III) state. The current thinking is that Fe(III) occludes phosphorus indirectly, so what forms in the lake is not ferric phosphate, but a mix of ferric oxides and hydroxides that the phosphate adsorbs onto. In the hypolimnion of an oxic lake, a layer of these ferric precipitates forms at the top of the sediment and acts as a barrier that retains any phosphorus released from the underlying anoxic sediments. When the hypolimnion becomes anoxic, the iron is reduced to Fe(II) and dissolves, releasing the previously retained phosphorus into the water column. Sediments that contain iron have also been shown to release phosphorus as pH increases. This is attributed to desorption of phosphate from iron(III) hydroxide by the replacement of phosphate with hydroxide (Jensen and Andersen, 1992; Boers, 1991).
The amount of iron that might react with phosphorus varies widely in Wisconsin lakes. Lakes in the southern part of the state are often low in iron due to a higher pH and more sulfur, both of which limit iron solubility. This in turn affects whether phosphorus mixed into lakes during fall turnover precipitates or stays in solution during the winter. Lakes with low iron and insufficient calcium to form marl are most likely to retain phosphorus in solution once it is released from sediments or brought in from external sources. These lakes are the most vulnerable to naturally occurring phosphorus or to phosphorus loading from human activities because the phosphorus remains dissolved in the water and is not pulled down into the sediments.
Phosphorus control has been attempted in some lakes by using alum (aluminum sulfate) to precipitate phosphate (Wisconsin DNR, 2003). This is the same process used by sewage treatment plants to remove phosphorus. On contact with water, alum forms a fluffy aluminum hydroxide precipitate called floc. The aluminum hydroxide binds with phosphate to form an aluminum phosphate compound, which is insoluble in water under most conditions. As the floc settles, it also carries suspended particles in the water down to the lake bottom leaving the lake noticeably clearer. On the bottom of the lake, the floc forms a layer that acts as a barrier. As phosphate is released from anoxic sediments, the phosphate binds to the floc. Aluminum phosphate, unlike iron phosphate, is not redissolved when oxygen is depleted.
Quantification of Phosphorus
Quantification of phosphorus requires the conversion of phosphorus to dissolved orthophosphate followed by colorimetric determination of the dissolved orthophosphate. The analysis of different forms of phosphorus is obtained by various pretreatment steps. “Total phosphorus” is the total amount of phosphorus contained, regardless of its form. Filtration through a 0.45 μm pore diameter membrane separates total phosphorus (TP) into “soluble phosphorus” and “particulate phosphorus”. Analyses are usually conducted on the unfiltered and filtered samples, and particulate fractions are determined by difference.
Each of these fractions, soluble and particulate phosphorus, may be divided analytically into “reactive phosphorus”, “acid-hydrolyzable phosphorus” and “total phosphorus”. The “reactive phosphorus” fraction contains phosphates that respond to colorimetric tests without hydrolysis or oxidative digestion. Reactive phosphorus is largely a measure of orthophosphate. Acid hydrolysis converts soluble and particulate condensed phosphates to dissolved orthophosphate. The “acid-hydrolyzable” fraction contains orthophosphates and condensed phosphates. In order to measure the amount of organically bound phosphorus, the sample must be oxidized (digested) to convert organic phosphorus to orthophosphate. Organic phosphorus can be digested using perchloric acid, nitric acid-sulfuric acid, or persulfate. The perchloric acid method, which was designed for sample matrixes difficult to digest such as soil and sediments, is very time-consuming and requires special facilities and safety precautions. The acid-sulfuric acid method is widely recommended for most sample matrixes; however, the persulfate oxidation method is by far the safest and least time consuming. The “total phosphorus” fraction contains orthophosphates, condensed phosphates, and organic phosphorus. Figure 3 shows the analytical scheme for the differentiation of different phosphorus forms. In the first two parts of the project, you will be measuring total phosphorus (TP).
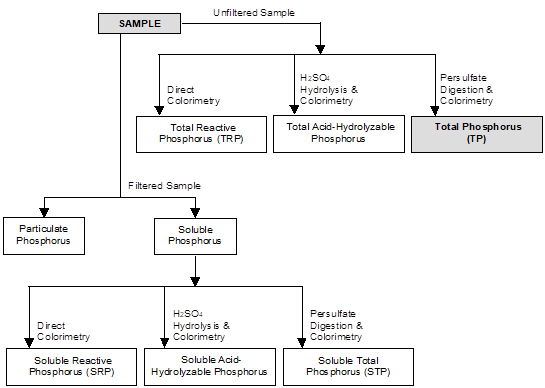
Figure 3: Analytical scheme for the differentiation of phosphorus forms.
Three techniques for the colorimetric analysis of phosphorus are described in Standard Methods for the Examination of Water and Wastewater: the vanadomolybdophosphoric method, the stannous chloride method, and the ascorbic acid method (Eaton et al., 2005). The technique most commonly used is the ascorbic acid method. In this method, ammonium molybdate (NH4)6Mo7O24\(\,\cdot\,\)4H2O) and antimony potassium tartrate (K(SbO)C4H4O6\(\,\cdot\,\)½H2O) react in an acid medium with dilute solutions of orthophosphate to form an intensely colored antimony-phospho-molybdate complex. This complex is reduced to an intensely blue-colored complex by ascorbic acid (Murphy and Riley, 1977). The complex is not stable and thus analysis must be performed within 30 minutes of adding the combined reagents to the sample.
Another spectrophotometric method of analysis has been by developed by Van Veldhoven and Mannaerts (1986) in which molybdophosphate is reacted with the dye malachite green to produce a colored complex. The malachite green method is reported to have better sensitivity, better color development, and to be less sensitive to changes in heating, reagent addition or reaction time than the widely used ascorbic acid method (Rao et al., 1997). Since both methods are based on the production of a molybdophosphoric acid, they both measure a similar fraction of dissolved reactive phosphorus.
Sampling and Storage Methods for Water and Sediments
Phosphorus analysis methods are highly sensitive to trace amounts of contamination commonly present in tap water, distilled water, on fingers, in soap and some detergents, in buffer solutions and other reagents. Contaminants from containers may leach into samples. Similarly, sample analytes may adsorb onto the walls of containers. All glassware and sample bottle used should be rinsed with warm, dilute 1 M HCl, then rinsed several times with Milli-Q water (highly purified and deionized water). In the lab, gently heat 1 M HCl on a hot plate until it is warm. Rinse all of the glassware and plastic bottles you use in your experiments with several small aliquots of warm 1 M HCl followed by three rinses with Milli-Q water. Likewise, when you prepare your solutions, make sure that you use the Milli-Q water provided in the lab.
Grab samples are single samples collected at a specific spot at a site over a short period of time that represent a "snapshot" in both space and time. When collecting a grab sample from the lake, avoid surface scum. Rinse your sample bottles out three times with the water being collected, fill the bottles completely, and cap tightly. Once you have collected your Lake Mendota water samples, bring them back to the lab and digest them the same day. Once the samples are digested, they should be stored in the refrigerator until you are ready to analyze them for total phosphorus.
If you need a Lake Mendota sediment sample for the third part of the project, you can collect a sediment grab sample from one of the piers using an Ekman dredge. An Ekman dredge is a hinged bucket that closes when it is raised. The Ekman dredge is set with the jaws cocked open and lowered over the dock until it is resting on the sediment. At this point, slackening of the line activates the mechanism and the jaws are released. The dredge should be pulled up slowly to allow time for the jaws to close and to minimize turbulence that will result in the loss of surface sediments. Once the sampler is back on the dock, a shallow pan is placed beneath it and the sediment is released and transferred into a sample container.
Method Detection Limit
The method detection limit (MDL) is the minimum concentration of an analyte that can be measured and reported with a 99 percent confidence that the analyte concentration is greater than zero. The method must be well-defined and the method detection limit depends on the instrument, the sample matrix and the analyst. The MDL is based on the variability or precision between seven or more replicate samples run at identical concentrations. MDLs are typically calculated using reagent water spiked with the analyte of interest. The concentration of the spike should be close to detection limit, or about 1 to 5 times the MDL. Hence, one needs to somehow estimate the detection limit before it is actually measured. The spiked samples must be prepared and processed exactly as a sample would be in the analytical method, including any extractions or digestions.
When calculating the MDL, the same calibration curve that would be used for a typical analysis must be used, with the lowest calibration standard approximately equal to the limit of quantitation (LOQ). The LOQ is defined as equal to 10 times the standard deviation of the results for the series of replicates that were used to determine the detection limit.