Chemistry LibreTexts

11.12: Spectroscopy of Alcohols and Phenols

  • Page ID
    227140
  • \( \newcommand{\vecs}[1]{\overset { \scriptstyle \rightharpoonup} {\mathbf{#1}} } \)

    \( \newcommand{\vecd}[1]{\overset{-\!-\!\rightharpoonup}{\vphantom{a}\smash {#1}}} \)

    \( \newcommand{\id}{\mathrm{id}}\) \( \newcommand{\Span}{\mathrm{span}}\)

    ( \newcommand{\kernel}{\mathrm{null}\,}\) \( \newcommand{\range}{\mathrm{range}\,}\)

    \( \newcommand{\RealPart}{\mathrm{Re}}\) \( \newcommand{\ImaginaryPart}{\mathrm{Im}}\)

    \( \newcommand{\Argument}{\mathrm{Arg}}\) \( \newcommand{\norm}[1]{\| #1 \|}\)

    \( \newcommand{\inner}[2]{\langle #1, #2 \rangle}\)

    \( \newcommand{\Span}{\mathrm{span}}\)

    \( \newcommand{\id}{\mathrm{id}}\)

    \( \newcommand{\Span}{\mathrm{span}}\)

    \( \newcommand{\kernel}{\mathrm{null}\,}\)

    \( \newcommand{\range}{\mathrm{range}\,}\)

    \( \newcommand{\RealPart}{\mathrm{Re}}\)

    \( \newcommand{\ImaginaryPart}{\mathrm{Im}}\)

    \( \newcommand{\Argument}{\mathrm{Arg}}\)

    \( \newcommand{\norm}[1]{\| #1 \|}\)

    \( \newcommand{\inner}[2]{\langle #1, #2 \rangle}\)

    \( \newcommand{\Span}{\mathrm{span}}\) \( \newcommand{\AA}{\unicode[.8,0]{x212B}}\)

    \( \newcommand{\vectorA}[1]{\vec{#1}}      % arrow\)

    \( \newcommand{\vectorAt}[1]{\vec{\text{#1}}}      % arrow\)

    \( \newcommand{\vectorB}[1]{\overset { \scriptstyle \rightharpoonup} {\mathbf{#1}} } \)

    \( \newcommand{\vectorC}[1]{\textbf{#1}} \)

    \( \newcommand{\vectorD}[1]{\overrightarrow{#1}} \)

    \( \newcommand{\vectorDt}[1]{\overrightarrow{\text{#1}}} \)

    \( \newcommand{\vectE}[1]{\overset{-\!-\!\rightharpoonup}{\vphantom{a}\smash{\mathbf {#1}}}} \)

    \( \newcommand{\vecs}[1]{\overset { \scriptstyle \rightharpoonup} {\mathbf{#1}} } \)

    \( \newcommand{\vecd}[1]{\overset{-\!-\!\rightharpoonup}{\vphantom{a}\smash {#1}}} \)

    \(\newcommand{\avec}{\mathbf a}\) \(\newcommand{\bvec}{\mathbf b}\) \(\newcommand{\cvec}{\mathbf c}\) \(\newcommand{\dvec}{\mathbf d}\) \(\newcommand{\dtil}{\widetilde{\mathbf d}}\) \(\newcommand{\evec}{\mathbf e}\) \(\newcommand{\fvec}{\mathbf f}\) \(\newcommand{\nvec}{\mathbf n}\) \(\newcommand{\pvec}{\mathbf p}\) \(\newcommand{\qvec}{\mathbf q}\) \(\newcommand{\svec}{\mathbf s}\) \(\newcommand{\tvec}{\mathbf t}\) \(\newcommand{\uvec}{\mathbf u}\) \(\newcommand{\vvec}{\mathbf v}\) \(\newcommand{\wvec}{\mathbf w}\) \(\newcommand{\xvec}{\mathbf x}\) \(\newcommand{\yvec}{\mathbf y}\) \(\newcommand{\zvec}{\mathbf z}\) \(\newcommand{\rvec}{\mathbf r}\) \(\newcommand{\mvec}{\mathbf m}\) \(\newcommand{\zerovec}{\mathbf 0}\) \(\newcommand{\onevec}{\mathbf 1}\) \(\newcommand{\real}{\mathbb R}\) \(\newcommand{\twovec}[2]{\left[\begin{array}{r}#1 \\ #2 \end{array}\right]}\) \(\newcommand{\ctwovec}[2]{\left[\begin{array}{c}#1 \\ #2 \end{array}\right]}\) \(\newcommand{\threevec}[3]{\left[\begin{array}{r}#1 \\ #2 \\ #3 \end{array}\right]}\) \(\newcommand{\cthreevec}[3]{\left[\begin{array}{c}#1 \\ #2 \\ #3 \end{array}\right]}\) \(\newcommand{\fourvec}[4]{\left[\begin{array}{r}#1 \\ #2 \\ #3 \\ #4 \end{array}\right]}\) \(\newcommand{\cfourvec}[4]{\left[\begin{array}{c}#1 \\ #2 \\ #3 \\ #4 \end{array}\right]}\) \(\newcommand{\fivevec}[5]{\left[\begin{array}{r}#1 \\ #2 \\ #3 \\ #4 \\ #5 \\ \end{array}\right]}\) \(\newcommand{\cfivevec}[5]{\left[\begin{array}{c}#1 \\ #2 \\ #3 \\ #4 \\ #5 \\ \end{array}\right]}\) \(\newcommand{\mattwo}[4]{\left[\begin{array}{rr}#1 \amp #2 \\ #3 \amp #4 \\ \end{array}\right]}\) \(\newcommand{\laspan}[1]{\text{Span}\{#1\}}\) \(\newcommand{\bcal}{\cal B}\) \(\newcommand{\ccal}{\cal C}\) \(\newcommand{\scal}{\cal S}\) \(\newcommand{\wcal}{\cal W}\) \(\newcommand{\ecal}{\cal E}\) \(\newcommand{\coords}[2]{\left\{#1\right\}_{#2}}\) \(\newcommand{\gray}[1]{\color{gray}{#1}}\) \(\newcommand{\lgray}[1]{\color{lightgray}{#1}}\) \(\newcommand{\rank}{\operatorname{rank}}\) \(\newcommand{\row}{\text{Row}}\) \(\newcommand{\col}{\text{Col}}\) \(\renewcommand{\row}{\text{Row}}\) \(\newcommand{\nul}{\text{Nul}}\) \(\newcommand{\var}{\text{Var}}\) \(\newcommand{\corr}{\text{corr}}\) \(\newcommand{\len}[1]{\left|#1\right|}\) \(\newcommand{\bbar}{\overline{\bvec}}\) \(\newcommand{\bhat}{\widehat{\bvec}}\) \(\newcommand{\bperp}{\bvec^\perp}\) \(\newcommand{\xhat}{\widehat{\xvec}}\) \(\newcommand{\vhat}{\widehat{\vvec}}\) \(\newcommand{\uhat}{\widehat{\uvec}}\) \(\newcommand{\what}{\widehat{\wvec}}\) \(\newcommand{\Sighat}{\widehat{\Sigma}}\) \(\newcommand{\lt}{<}\) \(\newcommand{\gt}{>}\) \(\newcommand{\amp}{&}\) \(\definecolor{fillinmathshade}{gray}{0.9}\)
    Objectives

    After completing this section, you should be able to

    1. identify the two most prominent absorptions seen in the infrared spectra of alcohols and phenols.
    2. describe the characteristic feature of the proton NMR spectra of alcohols and phenols.
      1. explain how deuterium oxide (D2O) can be used to assist in the identification of the signal caused by the presence of the O-H proton in the 1H NMR spectrum of an alcohol.
      2. predict the general form (i.e., number of peaks, approximate chemical shifts, and splitting pattern) of the proton NMR of a given alcohol or phenol.
    3. describe the two most common initial fragmentations in the mass spectra of alcohols.
    4. use spectral data (infrared, NMR, mass spectroscopy) to assist in the identification of an unknown alcohol or phenols. You may use tables of characteristic absorptions as an aid to accomplishing this objective.
    Key Terms

    Make certain that you can define, and use in context, the key terms below.

    • alpha cleavage
    • dehydration
    Study Notes

    The 1H NMR chemical shifts for phenols are not particularly distinctive. However, one expects the \(\ce{-OH}\) signal to be in the 4–7 ppm range, while the aromatic protons (see Section 15.7) are expected to be found at 7–8 ppm.

    In a mass spectrometer, alcohols fragment in two characteristic ways: alpha cleavage and dehydration. From the equation showing H-Y elimination, you can see that the dehydration of an alcohol in a mass spectrometer is essentially the same as the dehydration of an alcohol in a normal chemical reaction. “Alpha cleavage” refers to the breaking of the bond between the oxygen-bearing carbon atom and one of the neighboring carbons.

    Infrared Spectroscopy

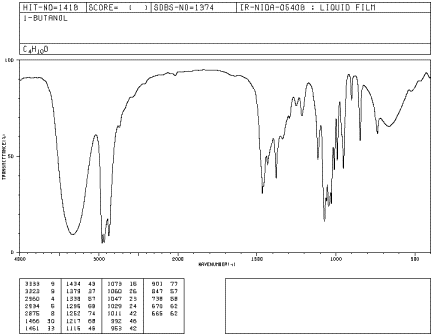
    The IR spectrum of aliphatic alcohols have a distinctive O-H stretch in the range of 3300 to 3400 cm-1. This peak tends to be very strong and very broad. This exact position of the peak is dependent on the amount of hydrogen bonding in the alcohol. In addition alcohol have a strong C-O stretch near 1000 cm-1. In the IR spectra of 1-butanol, show below, the O-H stretch appears at 3300 cm-1 and the C-O stretch appears at 1073 cm-1.

    IRFig8.gif

    Figure IR8. IR spectrum of 1-butanol. Source: SDBSWeb : http://riodb01.ibase.aist.go.jp/sdbs/ (National Institute of Advanced Industrial Science and Technology of Japan, 14 July 2008)

    Peak shapes are sometimes very useful in recognizing what kind of bond is present. The rounded shape of most O-H stretching modes occurs because of hydrogen bonding between different hydroxy groups. Because protons are shared to varying extent with neighboring oxygens, the covalent O-H bonds in a sample of alcohol all vibrate at slightly different frequencies and show up at slightly different positions in the IR spectrum. Instead of seeing one sharp peak, you see a broad set of multiple overlapping peaks. The broadness of the O-H peak makes it very easy to distinguish in an IR spectrum.

    The IR spectrum of phenols the O-H stretch appears at roughly 3500 cm-1. In addition, the IR spectra will show the bands typical for aromatic compounds in the region of 1500-1600 cm-1.

    The IR Spectrum of Phenol

    Exercise \(\PageIndex{1}\)

    Assume that you have just converted cyclohexanol into cyclohexanone. How would you use IR spectroscopy to tell if the conversion was successful? What changes would you expect to see between the starting material and the product?

    Exercise 1.svg

    Answer

    The cyclohexanol starting material would have a distinctive O-H stretch between 3300 and 3400 cm-1. If the conversion were successful this peak would not be present in the product. Also, the IR spectrum of the product would have a strong C=O stretch between 1700 and 1800 cm-1.

    1H Nuclear Magnetic Resonance Spectroscopy

    Alcohols

    • Protons on carbon adjacent to the alcohol oxygen show up in the region of 3.4-4.5 ppm. The electronegativity of the alcohol oxygen de-shields these protons causing them to appear downfield when compared to alkane protons.
    • Protons directly attached to the alcohol oxygen often appear in the region of 2.0 to 2.5 ppm. These peaks tend to appear as short, broad singlets. The position of the -OH peak can vary depending on the conditions, such as the NMR solvent used, the concentration of the alcohol, the purity of the alcohol, temperature, and if any water is present in the sample.

    Notice that the alcohol proton is not involved in spin-spin splitting. This is usually true unless the alcohol is exceptionally pure. Most samples of alcohols contain minute amounts of acidic impurities which catalyze the exchange of protons causing the splitting effects to be removed. This is why alcohol protons typically appears as a singlet in NMR spectrum. The 1H NMR spectrum of propanol shows the -CH2- attached to the alcohol as a triplet at 3.58 ppm. This shows that the signal is being split by the adjacent -CH2- group and not the alcohol -OH. The signal for the proton attached to the oxygen appears as a singlet at 2.26 ppm. If this signal was involved in spin-spin splitting with the adjacent -CH2- group it would appear as a triplet.

    Propanol 1H NMR.svg

    Source: SDBSWeb : http://sdbs.db.aist.go.jp (National Institute of Advanced Industrial Science and Technology, 28 June 2017

    Phenol

    • Protons attached to the aromatic ring in phenols show up near the aromatic region of an NMR spectrum (7-8 ppm). These peaks will have splitting typical for aromatic protons.
    • The protons directly attached to the alcohol oxygen of phenols appear in the region of 3 to 8 ppm. These peaks tend to appear as short, broad singlets similarly to other alcohols.

    Phenol 1H NMR.svg

    Determining the Position of an -OH Peak in 1H NMR

    The position of the -OH absorption for alcohols and phenols can be easily determined through the addition a few drops of deuterium oxide, D2O to the NMR sample tube.

    After addition, the OH proton will be rapidly exchanged for a deuterium. Because deuterium atoms do not produce peaks in a typical NMR spectrum the original -OH peak will disappear. This technique is sometimes called a "D2O shake" due to the mixing required after D2O has been added to the NMR sample tube.

    D2O.svg

    13C Nuclear Magnetic Resonance Spectroscopy

    Alcohols

    • Carbons adjacent to the alcohol oxygen show up in the distinctive region of 50-65 ppm in 13C NMR spectrum.

    propanol13C NMR.svg

    Phenols

    • Due to the electronegative oxygen, the aromatic carbon attached to the -OH group is shifted downfield to 155 ppm.
    • The other carbons in the phenol ring appear in the region typical for aromatic carbons of 125-150 ppm.

    Phenol 13C NMR.svg

    Mass Spectra

    Alcohols

    An alcohol's molecular ion is small or non-existent. Alpha-cleavage of the C-C bond next to the oxygen usually occurs. A loss of H2O may occur as in the spectra below.

    3-Pentanol (C5H12O) with MW = 88.15

    3-Pentanol shows three significant fragment ions. Alpha-fragmentation (loss of an ethyl radical) forms the m/z=59 base peak. Loss of water from this gives a m/z=41 fragment, and loss of ethene from m/z=59 gives a m/z=31 fragment.

    Phenol

    Phenol (C6H6O) with MW = 94.11

    Phenol exhibit a strong molecular ion peak. The presence of an aromatic ring and an OH gives phenol a unique fragmentation pattern. In particular loss of CO (M – 28) and loss of a formyl radical (HCO·, M – 29) are common observed.

    From an outside source

    Exercise \(\PageIndex{1}\)

    1) From mass spectroscopy analysis it was determined that a compound has the general formula C5H12O. Given the following 1H NMR spectrum, draw the structure. The integration values of each group of signals is given on the spectrum.

    2) How would you expect the NMR spectrum show in question one to change if D2O was added to the NMR sample tube.

    3) From mass spectroscopy analysis it was determined that a compound has the general formula C3H8O. Given the following 1H NMR spectrum, draw the structure. The integration values of each group of signals is given on the spectrum.

    Answer

    1) 3-Pentanol

    17_11_1_answer.svg

    Exercise \(\PageIndex{2}\)

    How would you expect the NMR spectrum shown in Exercise 1 to change if D2O was added to the NMR sample tube.

    Answer

    The -OH peak at 4.5 ppm would dissappear due to dueterium exchange.

    Exercise \(\PageIndex{3}\)

    From mass spectroscopy analysis it was determined that a compound has the general formula C3H8O. Given the following 1H NMR spectrum, draw the structure. The integration values of each group of signals is given on the spectrum.

    Answer

    1-Propanol

    17_11_2_answer.svg

    Contributors and Attributions


    11.12: Spectroscopy of Alcohols and Phenols is shared under a not declared license and was authored, remixed, and/or curated by LibreTexts.

    • Was this article helpful?