
7.3: Implementing the Sampling Plan
- Page ID
- 5569

\( \newcommand{\vecs}[1]{\overset { \scriptstyle \rightharpoonup} {\mathbf{#1}} } \)
\( \newcommand{\vecd}[1]{\overset{-\!-\!\rightharpoonup}{\vphantom{a}\smash {#1}}} \)
\( \newcommand{\id}{\mathrm{id}}\) \( \newcommand{\Span}{\mathrm{span}}\)
( \newcommand{\kernel}{\mathrm{null}\,}\) \( \newcommand{\range}{\mathrm{range}\,}\)
\( \newcommand{\RealPart}{\mathrm{Re}}\) \( \newcommand{\ImaginaryPart}{\mathrm{Im}}\)
\( \newcommand{\Argument}{\mathrm{Arg}}\) \( \newcommand{\norm}[1]{\| #1 \|}\)
\( \newcommand{\inner}[2]{\langle #1, #2 \rangle}\)
\( \newcommand{\Span}{\mathrm{span}}\)
\( \newcommand{\id}{\mathrm{id}}\)
\( \newcommand{\Span}{\mathrm{span}}\)
\( \newcommand{\kernel}{\mathrm{null}\,}\)
\( \newcommand{\range}{\mathrm{range}\,}\)
\( \newcommand{\RealPart}{\mathrm{Re}}\)
\( \newcommand{\ImaginaryPart}{\mathrm{Im}}\)
\( \newcommand{\Argument}{\mathrm{Arg}}\)
\( \newcommand{\norm}[1]{\| #1 \|}\)
\( \newcommand{\inner}[2]{\langle #1, #2 \rangle}\)
\( \newcommand{\Span}{\mathrm{span}}\) \( \newcommand{\AA}{\unicode[.8,0]{x212B}}\)
\( \newcommand{\vectorA}[1]{\vec{#1}} % arrow\)
\( \newcommand{\vectorAt}[1]{\vec{\text{#1}}} % arrow\)
\( \newcommand{\vectorB}[1]{\overset { \scriptstyle \rightharpoonup} {\mathbf{#1}} } \)
\( \newcommand{\vectorC}[1]{\textbf{#1}} \)
\( \newcommand{\vectorD}[1]{\overrightarrow{#1}} \)
\( \newcommand{\vectorDt}[1]{\overrightarrow{\text{#1}}} \)
\( \newcommand{\vectE}[1]{\overset{-\!-\!\rightharpoonup}{\vphantom{a}\smash{\mathbf {#1}}}} \)
\( \newcommand{\vecs}[1]{\overset { \scriptstyle \rightharpoonup} {\mathbf{#1}} } \)
\( \newcommand{\vecd}[1]{\overset{-\!-\!\rightharpoonup}{\vphantom{a}\smash {#1}}} \)
\(\newcommand{\avec}{\mathbf a}\) \(\newcommand{\bvec}{\mathbf b}\) \(\newcommand{\cvec}{\mathbf c}\) \(\newcommand{\dvec}{\mathbf d}\) \(\newcommand{\dtil}{\widetilde{\mathbf d}}\) \(\newcommand{\evec}{\mathbf e}\) \(\newcommand{\fvec}{\mathbf f}\) \(\newcommand{\nvec}{\mathbf n}\) \(\newcommand{\pvec}{\mathbf p}\) \(\newcommand{\qvec}{\mathbf q}\) \(\newcommand{\svec}{\mathbf s}\) \(\newcommand{\tvec}{\mathbf t}\) \(\newcommand{\uvec}{\mathbf u}\) \(\newcommand{\vvec}{\mathbf v}\) \(\newcommand{\wvec}{\mathbf w}\) \(\newcommand{\xvec}{\mathbf x}\) \(\newcommand{\yvec}{\mathbf y}\) \(\newcommand{\zvec}{\mathbf z}\) \(\newcommand{\rvec}{\mathbf r}\) \(\newcommand{\mvec}{\mathbf m}\) \(\newcommand{\zerovec}{\mathbf 0}\) \(\newcommand{\onevec}{\mathbf 1}\) \(\newcommand{\real}{\mathbb R}\) \(\newcommand{\twovec}[2]{\left[\begin{array}{r}#1 \\ #2 \end{array}\right]}\) \(\newcommand{\ctwovec}[2]{\left[\begin{array}{c}#1 \\ #2 \end{array}\right]}\) \(\newcommand{\threevec}[3]{\left[\begin{array}{r}#1 \\ #2 \\ #3 \end{array}\right]}\) \(\newcommand{\cthreevec}[3]{\left[\begin{array}{c}#1 \\ #2 \\ #3 \end{array}\right]}\) \(\newcommand{\fourvec}[4]{\left[\begin{array}{r}#1 \\ #2 \\ #3 \\ #4 \end{array}\right]}\) \(\newcommand{\cfourvec}[4]{\left[\begin{array}{c}#1 \\ #2 \\ #3 \\ #4 \end{array}\right]}\) \(\newcommand{\fivevec}[5]{\left[\begin{array}{r}#1 \\ #2 \\ #3 \\ #4 \\ #5 \\ \end{array}\right]}\) \(\newcommand{\cfivevec}[5]{\left[\begin{array}{c}#1 \\ #2 \\ #3 \\ #4 \\ #5 \\ \end{array}\right]}\) \(\newcommand{\mattwo}[4]{\left[\begin{array}{rr}#1 \amp #2 \\ #3 \amp #4 \\ \end{array}\right]}\) \(\newcommand{\laspan}[1]{\text{Span}\{#1\}}\) \(\newcommand{\bcal}{\cal B}\) \(\newcommand{\ccal}{\cal C}\) \(\newcommand{\scal}{\cal S}\) \(\newcommand{\wcal}{\cal W}\) \(\newcommand{\ecal}{\cal E}\) \(\newcommand{\coords}[2]{\left\{#1\right\}_{#2}}\) \(\newcommand{\gray}[1]{\color{gray}{#1}}\) \(\newcommand{\lgray}[1]{\color{lightgray}{#1}}\) \(\newcommand{\rank}{\operatorname{rank}}\) \(\newcommand{\row}{\text{Row}}\) \(\newcommand{\col}{\text{Col}}\) \(\renewcommand{\row}{\text{Row}}\) \(\newcommand{\nul}{\text{Nul}}\) \(\newcommand{\var}{\text{Var}}\) \(\newcommand{\corr}{\text{corr}}\) \(\newcommand{\len}[1]{\left|#1\right|}\) \(\newcommand{\bbar}{\overline{\bvec}}\) \(\newcommand{\bhat}{\widehat{\bvec}}\) \(\newcommand{\bperp}{\bvec^\perp}\) \(\newcommand{\xhat}{\widehat{\xvec}}\) \(\newcommand{\vhat}{\widehat{\vvec}}\) \(\newcommand{\uhat}{\widehat{\uvec}}\) \(\newcommand{\what}{\widehat{\wvec}}\) \(\newcommand{\Sighat}{\widehat{\Sigma}}\) \(\newcommand{\lt}{<}\) \(\newcommand{\gt}{>}\) \(\newcommand{\amp}{&}\) \(\definecolor{fillinmathshade}{gray}{0.9}\)Implementing a sampling plan normally involves three steps: physically removing the sample from its target population, preserving the sample, and preparing the sample for analysis. Except for in situ sampling, we analyze a sample after removing it from its target population. Because sampling exposes the target population to potential contamination, the sampling device must be inert and clean.
After removing a sample from its target population, there is a danger that it will undergo a chemical or physical change before we can complete its analysis. This is a serious problem because the sample’s properties no longer are representative of the target population. To prevent this problem, we often preserve samples before transporting them to the laboratory for analysis. Even when analyzing samples in the field, preservation may still be necessary.
The initial sample is called the primary or gross sample, and may be a single increment drawn from the target population, or a composite of several increments. In many cases we cannot analyze the gross sample without first reducing the sample’s particle size, converting the sample into a more readily analyzable form, or improving its homogeneity.
7.3.1 Solutions
Typical examples of solution samples include those drawn from containers of commercial solvents; beverages, such as milk or fruit juice; natural waters, including lakes, streams, seawater and rain; bodily fluids, such as blood and urine; and, suspensions; such as those found in many oral medications. Let’s use the sampling of natural waters and wastewaters as a case study in how to sample solutions.
Note
Although you may never work with the specific samples highlighted in this section, the case studies presented here may help you in envisioning potential problems associated with your samples.
Sample Collection
The chemical composition of a surface water—such as a stream, river, lake, estuary, or ocean—is influenced by flow rate and depth. Rapidly flowing shallow streams and rivers, and shallow (<5 m) lakes are usually well mixed, and show little stratification with depth. To collect a grab sample we submerge a capped bottle below the surface, remove the cap and allow the bottle to fill completely, and replace the cap. Collecting a sample this way avoids the air–water interface, which may be enriched with heavy metals or contaminated with oil.10
Slowly moving streams and rivers, lakes deeper than five meters, estuaries, and oceans may show substantial stratification. Grab samples from near the surface are collected as described earlier, and samples at greater depths are collected using a sample bottle lowered to the desired depth (Figure 7.6).
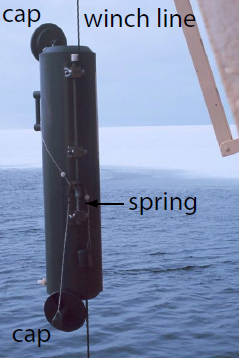
Figure 7.6 A Niskin sampling bottle for collecting water samples from lakes and oceans. After lowering the bottle to the desired depth, a weight is sent down the winch line, tripping a spring that closes the bottle. Source: NOAA (photolib.noaa.gov).
Wells for sampling groundwater are purged before collecting samples because the chemical composition of water in the well-casing may be significantly different from that of the groundwater. These differences may result from contaminants introduced while drilling the well, or by a change in the groundwater’s redox potential following its exposure to atmospheric oxygen. In general, a well is purged by pumping out a volume of water equivalent to several well-casing volumes, or until the water’s temperature, pH, or specific conductance is constant. A municipal water supply, such as a residence or a business, is purged before sampling because the chemical composition of water standing in a pipe may differ significantly from the treated water supply. Samples are collected at faucets after flushing the pipes for 2-3 minutes.
Samples from municipal wastewater treatment plants and industrial discharges often are collected as a 24-hour composite. An automatic sampler periodically removes an individual grab sample, adding it to those collected previously. The volume of each sample and the frequency of sampling may be constant, or may vary in response to changes in flow rate.
Sample containers for collecting natural waters and wastewaters are made from glass or plastic. Kimax and Pyrex brand borosilicate glass have the advantage of being easy to sterilize, easy to clean, and inert to all solutions except those that are strongly alkaline. The disadvantages of glass containers are cost, weight, and the ease of breakage. Plastic containers are made from a variety of polymers, including polyethylene, polypropylene, polycarbonate, polyvinyl chloride, and Teflon. Plastic containers are lightweight, durable, and, except for those manufactured from Teflon, inexpensive. In most cases glass or plastic bottles may be used interchangeably, although polyethylene bottles are generally preferred because of their lower cost. Glass containers are always used when collecting samples for the analysis of pesticides, oil and grease, and organics because these species often interact with plastic surfaces. Because glass surfaces easily adsorb metal ions, plastic bottles are preferred when collecting samples for the analysis of trace metals.
|
Analyte |
Preservation Method |
Maximum Holding Time |
|---|---|---|
|
ammonia |
cool to 4oC; add H2SO4 to pH<2 |
28 days |
|
chloride |
none required |
28 days |
|
metals—Cr(VI) |
cool to 4oC |
24 hours |
|
metals—Hg |
HNO3 to pH<2 |
28 days |
|
metals—all others |
HNO3 to pH<2 |
6 months |
|
nitrate |
none required |
48 hours |
|
organochlorine pesticides |
1 mL of 10 mg/mL HgCl2 or immediate extraction with a suitable non-aqueous solvent |
7 days without extraction |
|
pH |
none required |
analyze immediately |
In most cases the sample bottle has a wide mouth, making it easy to fill and remove the sample. A narrow-mouth sample bottle is used if exposing the sample to the container’s cap or to the outside environment is a problem. Unless exposure to plastic is a problem, caps for sample bottles are manufactured from polyethylene. When polyethylene must be avoided, the container cap includes an inert interior liner of neoprene or Teflon.
Sample Preservation and Preparation
After removing a sample from its target population, its chemical composition may change as a result of chemical, biological, or physical processes. To prevent a change in composition, samples are preserved by controlling the solution’s pH and temperature, by limiting its exposure to light or to the atmosphere, or by adding a chemical preservative. After preserving a sample, it may be safely stored for later analysis. The maximum holding time between preservation and analysis depends on the analyte’s stability and the effectiveness of sample preservation. Table 7.1 provides a list of representative methods for preserving samples and maximum holding times for several analytes of importance in the analysis of natural waters and wastewaters.
Most solution samples do not need additional preparation before analysis. This is the case for samples of natural waters and wastewaters. Solution samples with particularly complex matricies—blood and milk are two examples—may need additional processing to separate the analytes from interferents, a topic covered later in this chapter.
Note
Here our concern is only with the need to prepare the gross sample by converting it into a form suitable for analysis. Analytical methods may include additional sample preparation steps, such as concentrating or diluting the analyte, or adjusting the analyte’s chemical form. We will consider these forms of sample preparation in later chapters focusing on specific analytical methods.
7.3.2 Gases
Typical examples of gaseous samples include automobile exhaust, emissions from industrial smokestacks, atmospheric gases, and compressed gases. Also included in this category are aerosol particulates—the fine solid particles and liquid droplets that form smoke and smog. Let’s use the sampling of urban air as a case study in how to sample gases.
Sample Collection
One approach for collecting a sample of urban air is to fill a stainless steel canister or a Tedlar/Teflon bag. A pump pulls the air into the container and, after purging, the container is sealed. This method has the advantage of simplicity and of collecting a representative sample. Disadvantages include the tendency for some analytes to adsorb to the container’s walls, the presence of analytes at concentrations too low to detect with accuracy and precision, and the presence of reactive analytes, such as ozone and nitrogen oxides, that may react with the container or that may otherwise alter the sample’s chemical composition during storage. When using a stainless steel canister, cryogenic cooling, which changes the sample from a gaseous state to a liquid state, may limit some of these disadvantages.
Most urban air samples are collected using a trap containing a solid sorbent or by filtering. Solid sorbents are used for volatile gases (vapor pressures more than 10–6 atm) and semi-volatile gases (vapor pressures between 10–6 atm and 10–12 atm). Filtration is used to collect aerosol particulates. Trapping and filtering allows for sampling larger volumes of gas—an important concern for an analyte with a small concentration—and stabilizes the sample between its collection and its analysis.
In solid sorbent sampling, a pump pulls the urban air through a canister packed with sorbent particles. Typically 2–100 L of air are sampled when collecting volatile compounds, and 2–500 m3 when collecting semi-volatile gases. (1 m3 is equivalent to 103 L.) A variety of inorganic, organic polymer, and carbon sorbents have been used. Inorganic sorbents, such as silica gel, alumina, magnesium aluminum silicate, and molecular sieves, are efficient collectors for polar compounds. Their efficiency for collecting water, however, limits their sorption capacity for many organic compounds.
Organic polymeric sorbents include polymeric resins of 2,4-diphenyl-p-phenylene oxide or styrene-divinylbenzene for volatile compounds, and polyurethane foam for semi-volatile compounds. These materials have a low affinity for water, and are efficient collectors for all but the most highly volatile organic compounds, and some lower molecular weight alcohols and ketones. The adsorbing ability of carbon sorbents is superior to that of organic polymer resins, which makes them useful for highly volatile organic compounds that can not be collected by polymeric resins. The adsorbing ability of carbon sorbents may be a disadvantage, however, since the sorbed compounds may be difficult to desorb.
Non-volatile compounds are normally present either as solid particulates, or are bound to solid particulates. Samples are collected by pulling large volumes of urban air through a filtering unit, collecting the particulates on glass fiber filters.
The short term exposure of humans, animals, and plants to atmospheric pollutants is more severe than that for pollutants in other matrices. Because the composition of atmospheric gases can vary significantly over a time, the continuous monitoring of atmospheric gases such as O3, CO, SO2, NH3, H2O2, and NO2 by in situ sampling is important.11
Sample Preservation and Preparation
After collecting a gross sample of urban air, there is generally little need for sample preservation or preparation. The chemical composition of a gas sample is usually stable when it is collected using a solid sorbent, a filter, or by cryogenic cooling. When using a solid sorbent, gaseous compounds are released for analysis by thermal desorption or by extracting with a suitable solvent. If the sorbent is selective for a single analyte, the increase in the sorbent’s mass can be used to determine the amount of analyte in the sample.
7.3.3 Solids
Typical examples of solid samples include large particulates, such as those found in ores; smaller particulates, such as soils and sediments; tablets, pellets, and capsules used for dispensing pharmaceutical products and animal feeds; sheet materials, such as polymers and rolled metals; and tissue samples from biological specimens. Solids are usually heterogeneous and samples must be collected carefully if they are to be representative of the target population. Let’s use the sampling of sediments, soils, and ores as a case study in how to sample solids.
Sample Collection
Sediments from the bottom of streams, rivers, lakes, estuaries, and oceans are collected with a bottom grab sampler, or with a corer. A bottom grab sampler (Figure 7.7) is equipped with a pair of jaws that close when they contact the sediment, scooping up sediment in the process. Its principal advantages are ease of use and the ability to collect a large sample. Disadvantages include the tendency to lose finer grain sediment particles as water flows out of the sampler, and the loss of spatial information—both laterally and with depth—due to mixing of the sample.

Figure 7.7 Bottom grab sampler being prepared for deployment. Source: NOAA (photolib.noaa.gov).
An alternative method for collecting sediments is a cylindrical coring device (Figure 7.8). The corer is dropped into the sediment, collecting a column of sediment and the water in contact with the sediment. With the possible exception of sediment at the surface, which may experience mixing, samples collected with a corer maintain their vertical profile, preserving information about how the sediment’s composition changes with depth.
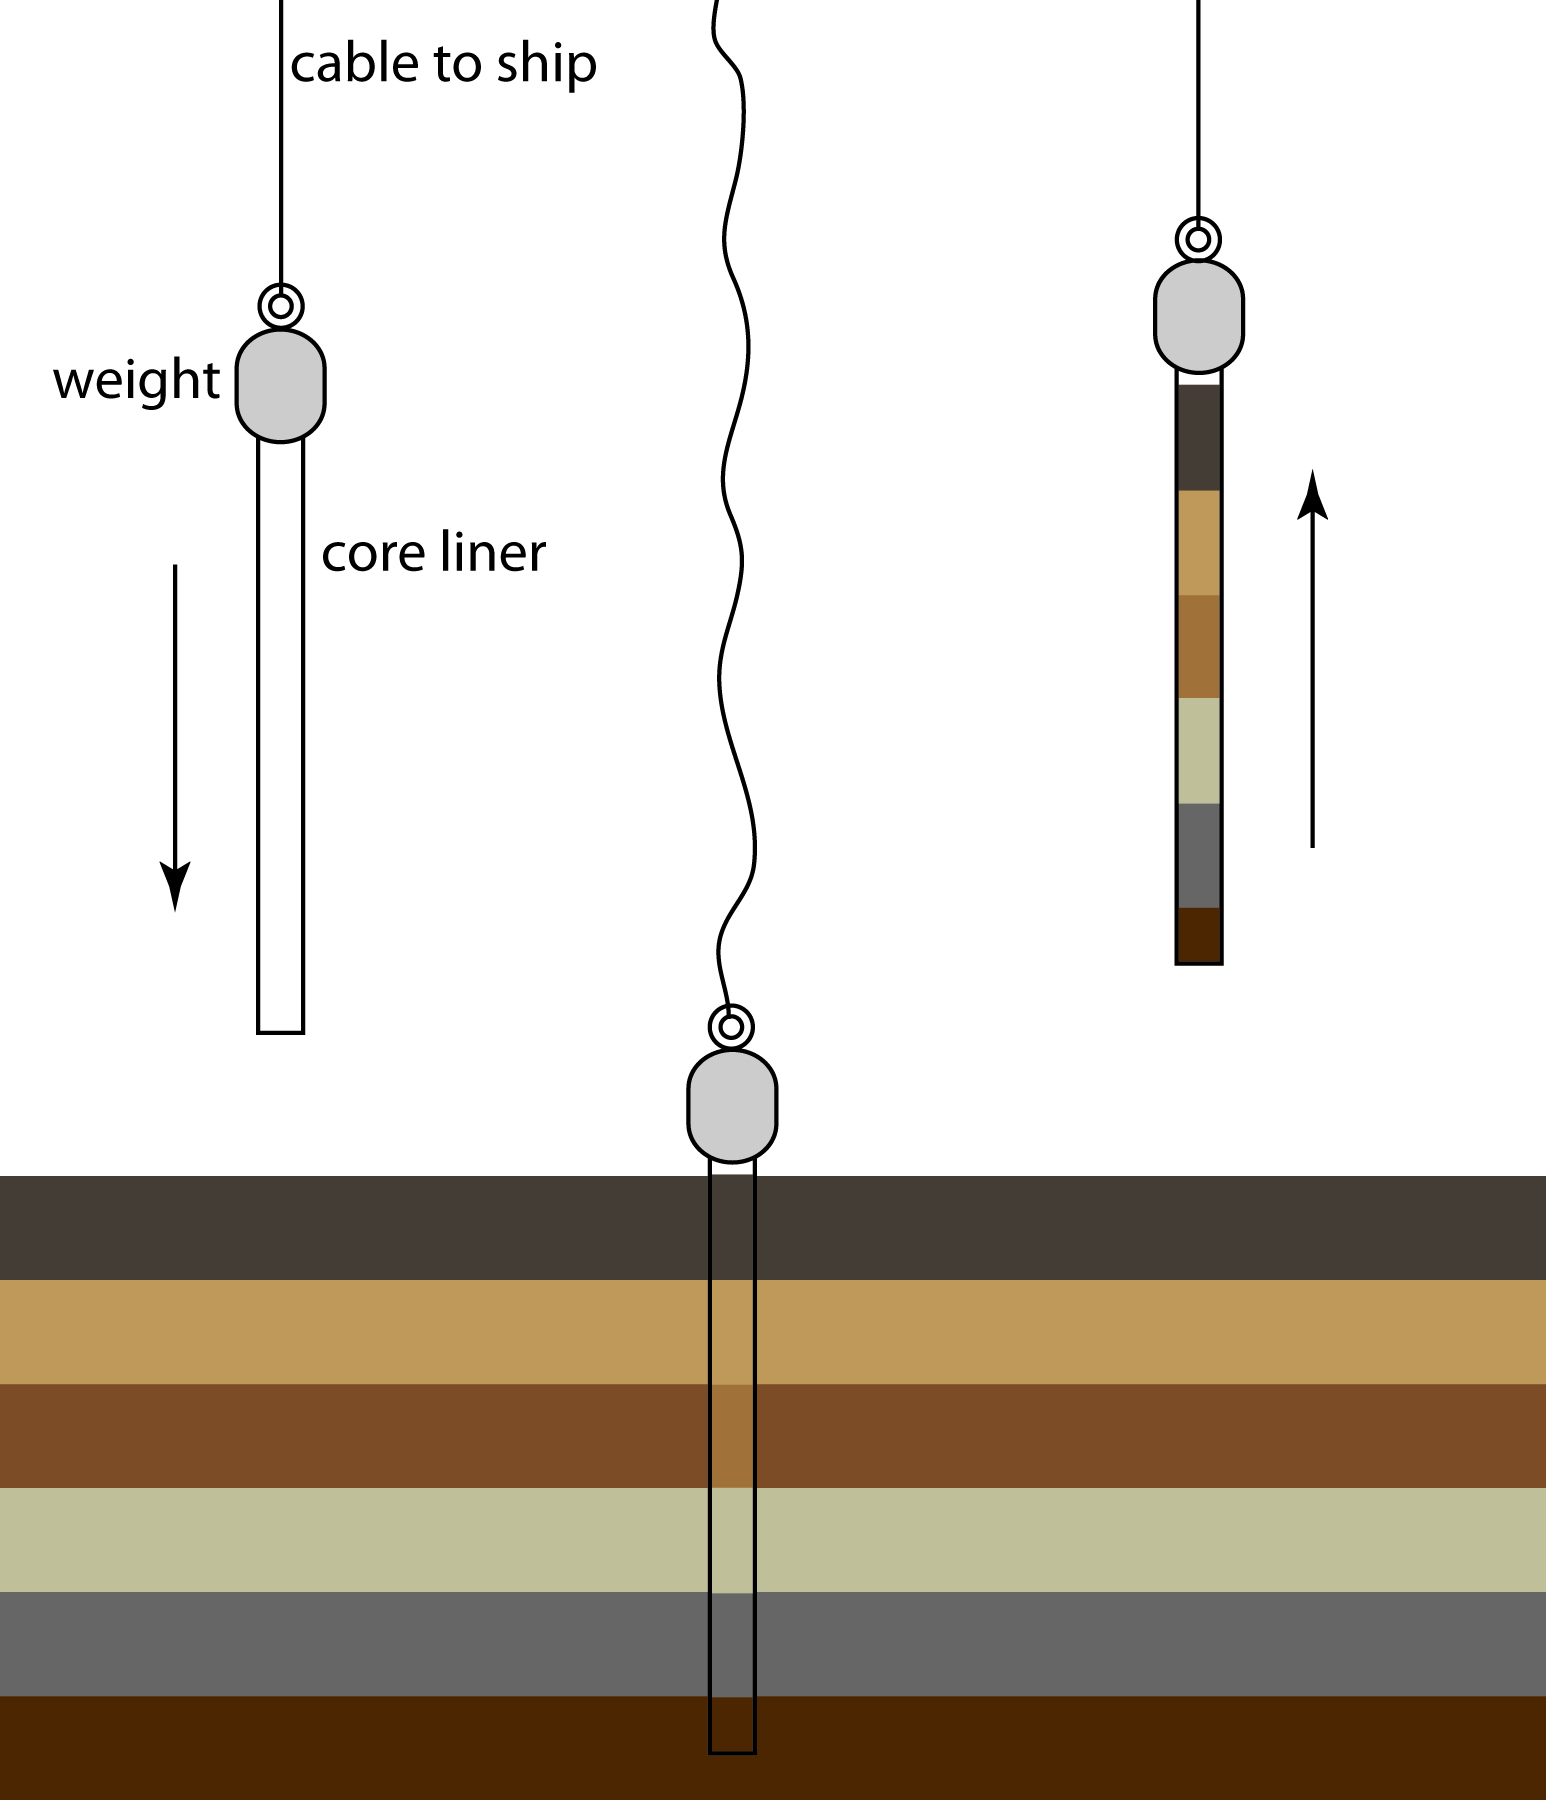
Figure 7.8 Schematic diagram of a gravity corer in operation. The corer’s weight is sufficient to penetrate into the sediment to a depth of approximately 2 m. Flexible metal leaves on the bottom of the corer are pushed aside by the sediment, allowing it to enter the corer. The leaves bend back and hold the core sample in place as it is hauled back to the surface.
Collecting soil samples at depths of up to 30 cm is easily accomplished with a scoop or shovel, although the sampling variance is generally high. A better tool for collecting soil samples near the surface is a soil punch, which is a thin-walled steel tube that retains a core sample after it is pushed into the soil and removed. Soil samples from depths greater than 30 cm are collected by digging a trench and collecting lateral samples with a soil punch. Alternatively, an auger may be used to drill a hole to the desired depth and the sample collected with a soil punch.
For particulate materials, particle size often determines the sampling method. Larger particulate solids, such as ores, are sampled using a riffle (Figure 7.9), which is a trough containing an even number of compartments. Because adjoining compartments empty onto opposite sides of the riffle, dumping a gross sample into the riffle divides it in half. By repeatedly passing half of the separated material back through the riffle, a sample of any desired size may be collected.
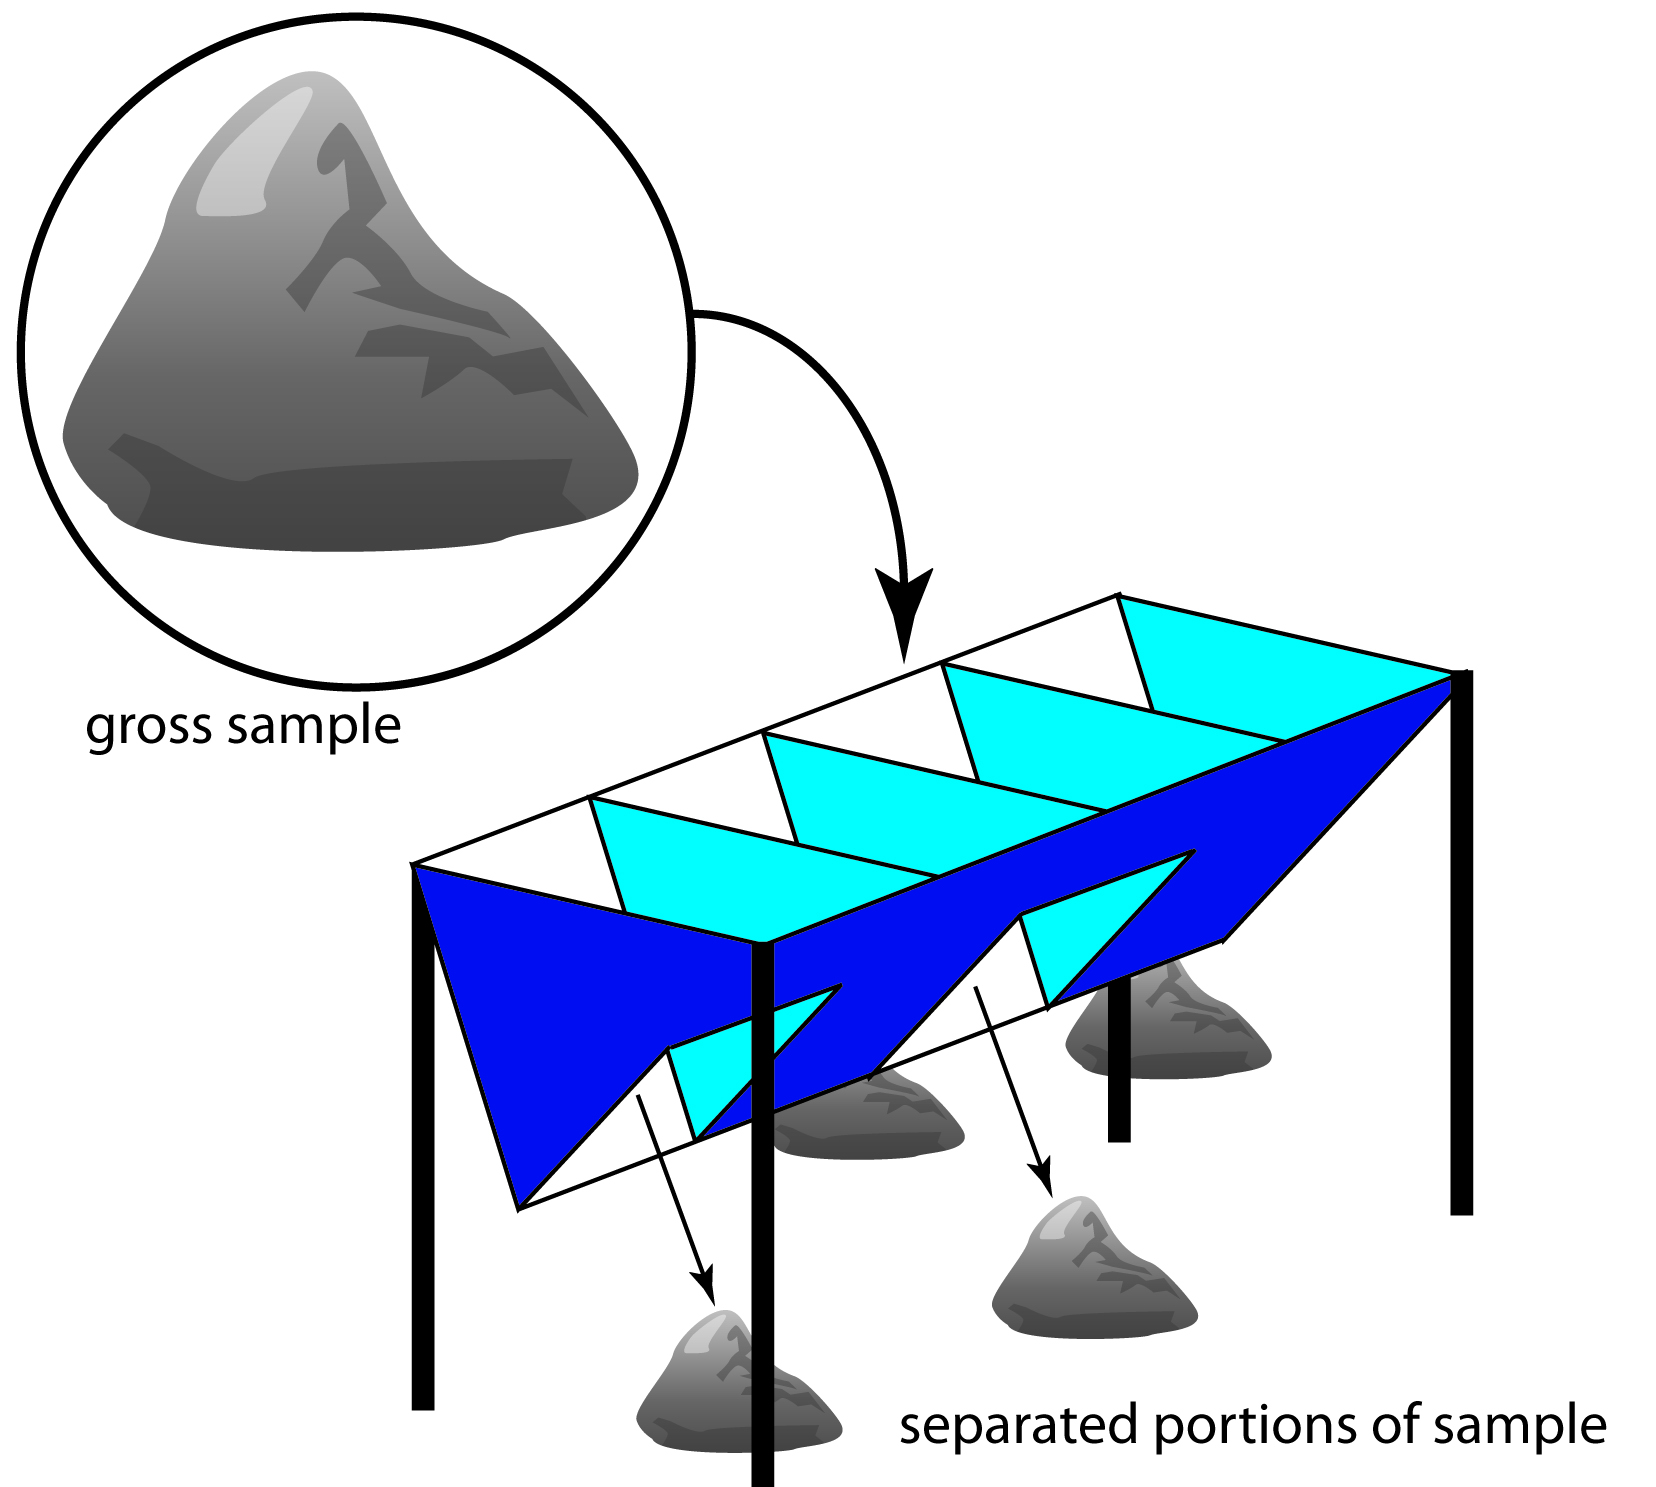
Figure 7.9 Example of a four-unit riffle. Passing the gross sample, shown within the circle, through the riffle divides it into four piles, two on each side. Combining the piles from one side of the riffle provides a new sample, which may be passed through the riffle again or kept as the final sample. The piles from the other side of the riffle are discarded.
A sample thief (Figure 7.10) is used for sampling smaller particulate materials, such as powders. A typical sample thief consists of two tubes that are nestled together. Each tube has one or more slots aligned down the sample thief’s length. Before inserting the sample thief into the material being sampled, the slots are closed by rotating the inner tube. When the sample thief is in place, rotating the inner tube opens the slots, which fill with individual samples. The inner tube is then rotated to the closed position and the sample thief withdrawn.
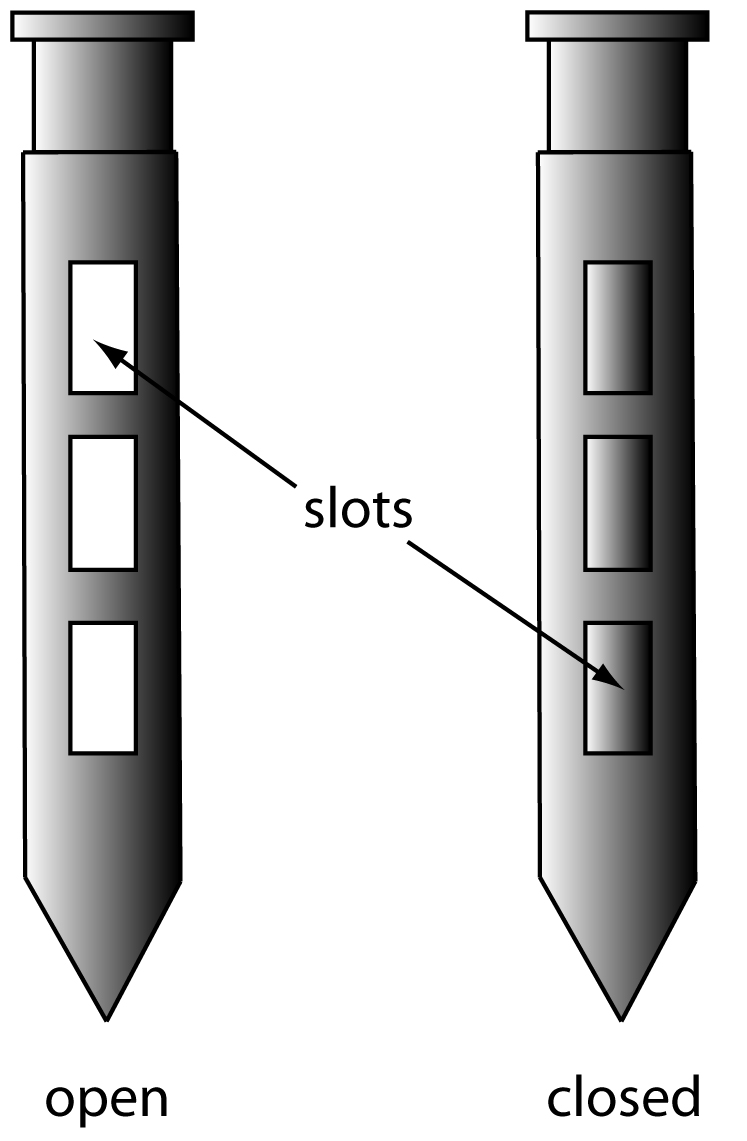
Figure 7.10 Sample thief showing its open and closed positions.
Sample Preservation
Without preservation, a solid sample may undergo a change in composition due to the loss of volatile material, biodegradation, and chemical reactivity (particularly redox reactions). Storing samples at lower temperatures makes them less prone to biodegradation and to the loss of volatile material, but fracturing of solids and phase separations may present problems. To minimize the loss of volatiles, the sample container is filled completely, eliminating a headspace where gases collect. Samples that have not been exposed to O2 are particularly susceptible to oxidation reactions. For example, the contact of air with anaerobic sediments must be prevented.
Sample Preparation
Unlike gases and liquids, which generally require little sample preparation, a solid sample usually needs some processing before analysis. There are two reasons for this. First, as discussed in section 7.2.3, the standard deviation for sampling, ssamp, is a function of the number of particles in the sample, not the combined mass of the particles. For a heterogeneous material consisting of large particulates, the gross sample may be too large to analyze. For example, a Ni-bearing ore with an average particle size of 5 mm may require a sample weighing one ton to obtain a reasonable ssamp. Reducing the sample’s average particle size allows us to collect the same number of particles with a smaller, more manageable mass. Second, many analytical techniques require that the analyte be in solution.
Reducing Particle Size
A reduction in particle size is accomplished by a combination of crushing and grinding the gross sample. The resulting particulates are then thoroughly mixed and divided into subsamples of smaller mass. This process seldom occurs in a single step. Instead, subsamples are cycled through the process several times until a final laboratory sample is obtained.
Crushing and grinding uses mechanical force to break larger particles into smaller particles. A variety of tools are used depending on the particle’s size and hardness. Large particles are crushed using jaw crushers capable of reducing particles to diameters of a few millimeters. Ball mills, disk mills, and mortars and pestles are used to further reduce particle size.
A significant change in the gross sample’s composition may occur during crushing and grinding. Decreasing particle size increases the available surface area, which increases the risk of losing volatile components. This problem is made worse by the frictional heat that accompanies crushing and grinding. Increasing the surface area also exposes interior portions of the sample to the atmosphere where oxidation may alter the gross sample’s composition. Other problems include contamination from the materials used to crush and grind the sample, and differences in the ease with which particles are reduced in size. For example, softer particles are easier to reduce in size and may be lost as dust before the remaining sample is processed. This is a particular problem if the analyte’s distribution between different types of particles is not uniform.
The gross sample is reduced to a uniform particle size by intermittently passing it through a sieve. Those particles not passing through the sieve receive additional processing until the entire sample is of uniform size. The resulting material is mixed thoroughly to ensure homogeneity and a subsample obtained with a riffle, or by coning and quartering. As shown in Figure 7.11, the gross sample is piled into a cone, flattened, and divided into four quarters. After discarding two diagonally opposed quarters, the remaining material is cycled through the process of coning and quartering until a suitable laboratory sample remains.

Figure 7.11 Illustration showing the method of coning and quartering for reducing sample size. After gathering the gross sample into a cone, the cone is flattened, divided in half, and then divided into quarters. Two opposing quarters are combined to form the laboratory sample, or the subsample is sent back through another cycle. The two remaining quarters are discarded.
Bringing Solid Samples Into Solution
If you are fortunate, your sample will easily dissolve in a suitable solvent, requiring no more effort than gently swirling and heating. Distilled water is usually the solvent of choice for inorganic salts, but organic solvents, such as methanol, chloroform, and toluene are useful for organic materials.
When a sample is difficult to dissolve, the next step is to try digesting it with an acid or a base. Table 7.2 lists several common acids and bases, and summarizes their use. Digestions are carried out in an open container, usually a beaker, using a hot-plate as a source of heat. The main advantage of an open-vessel digestion is cost because it requires no special equipment. Volatile reaction products, however, are lost, resulting in a determinate error if they include the analyte.
| Solution | Uses and Properties |
|---|---|
| HCl (37% w/w) |
|
| HNO3 (70% w/w) |
|
| H2SO4 (98% w/w) |
|
| HF (50% w/w) |
|
| HClO4 (70% w/w) |
|
| HCl:HNO3 (3:1 v/v) |
|
| NaOH |
|
Many digestions are now carried out in a closed container using microwave radiation as the source of energy. Vessels for microwave digestion are manufactured using Teflon (or some other fluoropolymer) or fused silica. Both materials are thermally stable, chemically resistant, transparent to microwave radiation, and capable of withstanding elevated pressures. A typical microwave digestion vessel, as shown in Figure 7.12, consists of an insulated vessel body and a cap with a pressure relief valve. The vessels are placed in a microwave oven (typically 6–14 vessels can be accommodated) and microwave energy is controlled by monitoring the temperature or pressure within one of the vessels.

Figure 7.12 Microwave digestion unit. (a) View of the unit’s interior showing the carousel holding the digestion vessels. (b) Close-up of a Teflon digestion vessel, which is encased in a thermal sleeve. The pressure relief value, which is part of the vessel’s cap, contains a membrane that ruptures if the internal pressure becomes too high.
A microwave digestion has several important advantages over an open-vessel digestion, including higher temperatures (200–300oC) and pressures (40–100 bar). As a result, digestions requiring several hours in an open-vessel may need no more than 30 minutes when using a microwave digestion. In addition, a closed container prevents the loss of volatile gases. Disadvantages include the inability to add reagents during the digestion, limitations on the sample’s size (typically < 1 g), and safety concerns due to the high pressures and corrosive reagents.
Inorganic samples that resist decomposition by digesting with acids or bases often can be brought into solution by fusing with a large excess of an alkali metal salt, called a flux. After mixing the sample and the flux in a crucible, they are heated to a molten state and allowed to cool slowly to room temperature. The melt usually dissolves readily in distilled water or dilute acid. Table 7.3 summarizes several common fluxes and their uses. Fusion works when other methods of decomposition do not because of the high temperature and the flux’s high concentration in the molten liquid. Disadvantages include contamination from the flux and the crucible, and the loss of volatile materials.
| Flux |
Melting |
Crucible | Typical Samples |
|---|---|---|---|
| Na2CO3 | 851 | Pt | silicates, oxides, phosphates, sulfides |
| Li2B4O7 | 930 | Pt, graphite | aluminosilicates, carbonates |
| LiBO2 | 845 | Pt, graphite | aluminosilicates, carbonates |
| NaOH | 318 | Au, Ag | silicates, silicon carbide |
| KOH | 380 | Au, Ag | silicates, silicon carbide |
| Na2O2 | — | Ni | silicates, chromium steels, Pt alloys |
| K2S2O7 | 300 | Ni, porcelain | oxides |
| B2O3 | 577 | Pt | silicates, oxides |
Finally, we can decompose organic materials by dry ashing. In this method the sample is placed in a suitable crucible and heated over a flame or in a furnace. The carbon present in the sample oxidizes to CO2, and hydrogen, sulfur, and nitrogen leave as H2O, SO2, and N2. These gases can be trapped and weighed to determine their concentration in the organic material. Often the goal of dry ashing is to remove the organic material, leaving behind an inorganic residue, or ash, that can be further analyzed.