
1.3: Real Gases (Deviations From Ideal Behavior)
- Page ID
- 72664
\( \newcommand{\vecs}[1]{\overset { \scriptstyle \rightharpoonup} {\mathbf{#1}} } \)
\( \newcommand{\vecd}[1]{\overset{-\!-\!\rightharpoonup}{\vphantom{a}\smash {#1}}} \)
\( \newcommand{\id}{\mathrm{id}}\) \( \newcommand{\Span}{\mathrm{span}}\)
( \newcommand{\kernel}{\mathrm{null}\,}\) \( \newcommand{\range}{\mathrm{range}\,}\)
\( \newcommand{\RealPart}{\mathrm{Re}}\) \( \newcommand{\ImaginaryPart}{\mathrm{Im}}\)
\( \newcommand{\Argument}{\mathrm{Arg}}\) \( \newcommand{\norm}[1]{\| #1 \|}\)
\( \newcommand{\inner}[2]{\langle #1, #2 \rangle}\)
\( \newcommand{\Span}{\mathrm{span}}\)
\( \newcommand{\id}{\mathrm{id}}\)
\( \newcommand{\Span}{\mathrm{span}}\)
\( \newcommand{\kernel}{\mathrm{null}\,}\)
\( \newcommand{\range}{\mathrm{range}\,}\)
\( \newcommand{\RealPart}{\mathrm{Re}}\)
\( \newcommand{\ImaginaryPart}{\mathrm{Im}}\)
\( \newcommand{\Argument}{\mathrm{Arg}}\)
\( \newcommand{\norm}[1]{\| #1 \|}\)
\( \newcommand{\inner}[2]{\langle #1, #2 \rangle}\)
\( \newcommand{\Span}{\mathrm{span}}\) \( \newcommand{\AA}{\unicode[.8,0]{x212B}}\)
\( \newcommand{\vectorA}[1]{\vec{#1}} % arrow\)
\( \newcommand{\vectorAt}[1]{\vec{\text{#1}}} % arrow\)
\( \newcommand{\vectorB}[1]{\overset { \scriptstyle \rightharpoonup} {\mathbf{#1}} } \)
\( \newcommand{\vectorC}[1]{\textbf{#1}} \)
\( \newcommand{\vectorD}[1]{\overrightarrow{#1}} \)
\( \newcommand{\vectorDt}[1]{\overrightarrow{\text{#1}}} \)
\( \newcommand{\vectE}[1]{\overset{-\!-\!\rightharpoonup}{\vphantom{a}\smash{\mathbf {#1}}}} \)
\( \newcommand{\vecs}[1]{\overset { \scriptstyle \rightharpoonup} {\mathbf{#1}} } \)
\( \newcommand{\vecd}[1]{\overset{-\!-\!\rightharpoonup}{\vphantom{a}\smash {#1}}} \)
\(\newcommand{\avec}{\mathbf a}\) \(\newcommand{\bvec}{\mathbf b}\) \(\newcommand{\cvec}{\mathbf c}\) \(\newcommand{\dvec}{\mathbf d}\) \(\newcommand{\dtil}{\widetilde{\mathbf d}}\) \(\newcommand{\evec}{\mathbf e}\) \(\newcommand{\fvec}{\mathbf f}\) \(\newcommand{\nvec}{\mathbf n}\) \(\newcommand{\pvec}{\mathbf p}\) \(\newcommand{\qvec}{\mathbf q}\) \(\newcommand{\svec}{\mathbf s}\) \(\newcommand{\tvec}{\mathbf t}\) \(\newcommand{\uvec}{\mathbf u}\) \(\newcommand{\vvec}{\mathbf v}\) \(\newcommand{\wvec}{\mathbf w}\) \(\newcommand{\xvec}{\mathbf x}\) \(\newcommand{\yvec}{\mathbf y}\) \(\newcommand{\zvec}{\mathbf z}\) \(\newcommand{\rvec}{\mathbf r}\) \(\newcommand{\mvec}{\mathbf m}\) \(\newcommand{\zerovec}{\mathbf 0}\) \(\newcommand{\onevec}{\mathbf 1}\) \(\newcommand{\real}{\mathbb R}\) \(\newcommand{\twovec}[2]{\left[\begin{array}{r}#1 \\ #2 \end{array}\right]}\) \(\newcommand{\ctwovec}[2]{\left[\begin{array}{c}#1 \\ #2 \end{array}\right]}\) \(\newcommand{\threevec}[3]{\left[\begin{array}{r}#1 \\ #2 \\ #3 \end{array}\right]}\) \(\newcommand{\cthreevec}[3]{\left[\begin{array}{c}#1 \\ #2 \\ #3 \end{array}\right]}\) \(\newcommand{\fourvec}[4]{\left[\begin{array}{r}#1 \\ #2 \\ #3 \\ #4 \end{array}\right]}\) \(\newcommand{\cfourvec}[4]{\left[\begin{array}{c}#1 \\ #2 \\ #3 \\ #4 \end{array}\right]}\) \(\newcommand{\fivevec}[5]{\left[\begin{array}{r}#1 \\ #2 \\ #3 \\ #4 \\ #5 \\ \end{array}\right]}\) \(\newcommand{\cfivevec}[5]{\left[\begin{array}{c}#1 \\ #2 \\ #3 \\ #4 \\ #5 \\ \end{array}\right]}\) \(\newcommand{\mattwo}[4]{\left[\begin{array}{rr}#1 \amp #2 \\ #3 \amp #4 \\ \end{array}\right]}\) \(\newcommand{\laspan}[1]{\text{Span}\{#1\}}\) \(\newcommand{\bcal}{\cal B}\) \(\newcommand{\ccal}{\cal C}\) \(\newcommand{\scal}{\cal S}\) \(\newcommand{\wcal}{\cal W}\) \(\newcommand{\ecal}{\cal E}\) \(\newcommand{\coords}[2]{\left\{#1\right\}_{#2}}\) \(\newcommand{\gray}[1]{\color{gray}{#1}}\) \(\newcommand{\lgray}[1]{\color{lightgray}{#1}}\) \(\newcommand{\rank}{\operatorname{rank}}\) \(\newcommand{\row}{\text{Row}}\) \(\newcommand{\col}{\text{Col}}\) \(\renewcommand{\row}{\text{Row}}\) \(\newcommand{\nul}{\text{Nul}}\) \(\newcommand{\var}{\text{Var}}\) \(\newcommand{\corr}{\text{corr}}\) \(\newcommand{\len}[1]{\left|#1\right|}\) \(\newcommand{\bbar}{\overline{\bvec}}\) \(\newcommand{\bhat}{\widehat{\bvec}}\) \(\newcommand{\bperp}{\bvec^\perp}\) \(\newcommand{\xhat}{\widehat{\xvec}}\) \(\newcommand{\vhat}{\widehat{\vvec}}\) \(\newcommand{\uhat}{\widehat{\uvec}}\) \(\newcommand{\what}{\widehat{\wvec}}\) \(\newcommand{\Sighat}{\widehat{\Sigma}}\) \(\newcommand{\lt}{<}\) \(\newcommand{\gt}{>}\) \(\newcommand{\amp}{&}\) \(\definecolor{fillinmathshade}{gray}{0.9}\)The postulates of the kinetic molecular theory of gases ignore both the volume occupied by the molecules of a gas and all interactions between molecules, whether attractive or repulsive. In reality, however, all gases have nonzero molecular volumes. Furthermore, the molecules of real gases interact with one another in ways that depend on the structure of the molecules and therefore differ for each gaseous substance. In this section, we consider the properties of real gases and how and why they differ from the predictions of the perfect (ideal) gas law. We also examine liquefaction, a key property of real gases that is not predicted by the kinetic molecular theory of gases.
The perfect gas law is an example of an Equation of state. One way to visualize any Equation of state is to plot the so-called isotherms, which are graphs of \(P\) vs. \(V\) at fixed values of \(T\). For the ideal-gas Equation of state \(P = nRT/V\), some of the isotherms are shown in Figure \(\PageIndex{1}\).
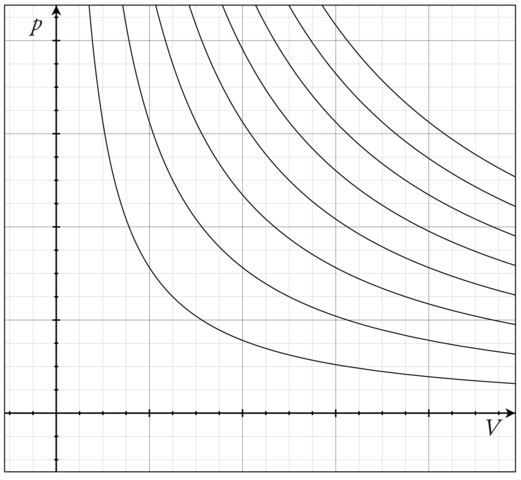
Figure \(\PageIndex{1}\): Pressure vs. volume for different temperatures (isotherms) of the ideal-gas Equation of state. Image citation: https://commons.wikimedia.org/wiki/F..._isotherms.png
What is important to note here, is that an ideal gas can exist only as a gas. It is not possible for an ideal gas to condense into some kind of “ideal liquid”. In other words, a phase transition from gas to liquid can be modeled only if interparticle interactions are properly accounted for.
The Compressibility of a Gas
Note that the ideal-gas Equation of state can be written in the form
\[\dfrac{P V}{n R T} = \dfrac{P \bar{V}}{R T} = \dfrac{P}{\rho R T} = 1 \label{1.3.1}\]
where \(\bar{V} = V/n\) is called the molar volume (and is also known as \(V_m\)). Unlike \(V\), which increases as the number of moles increases (an example of what is called an extensive quantity in thermodynamics), \(\bar{V}\) does not exhibit this dependence and, therefore, is called intensive. The quantity
\[Z = \dfrac{P V}{n R T} = \dfrac{P \bar{V}}{R T} = \dfrac{P}{\rho R T} \label{1.3.2}\]
is called the compressibility of the gas. In an ideal gas, if we “compress” the gas by increasing \(P\) , the density \(\rho\) must increase as well so as to keep \(Z =1\). For a real gas, \(Z\), therefore, gives us a measure of how much the gas deviates from ideal-gas behavior.
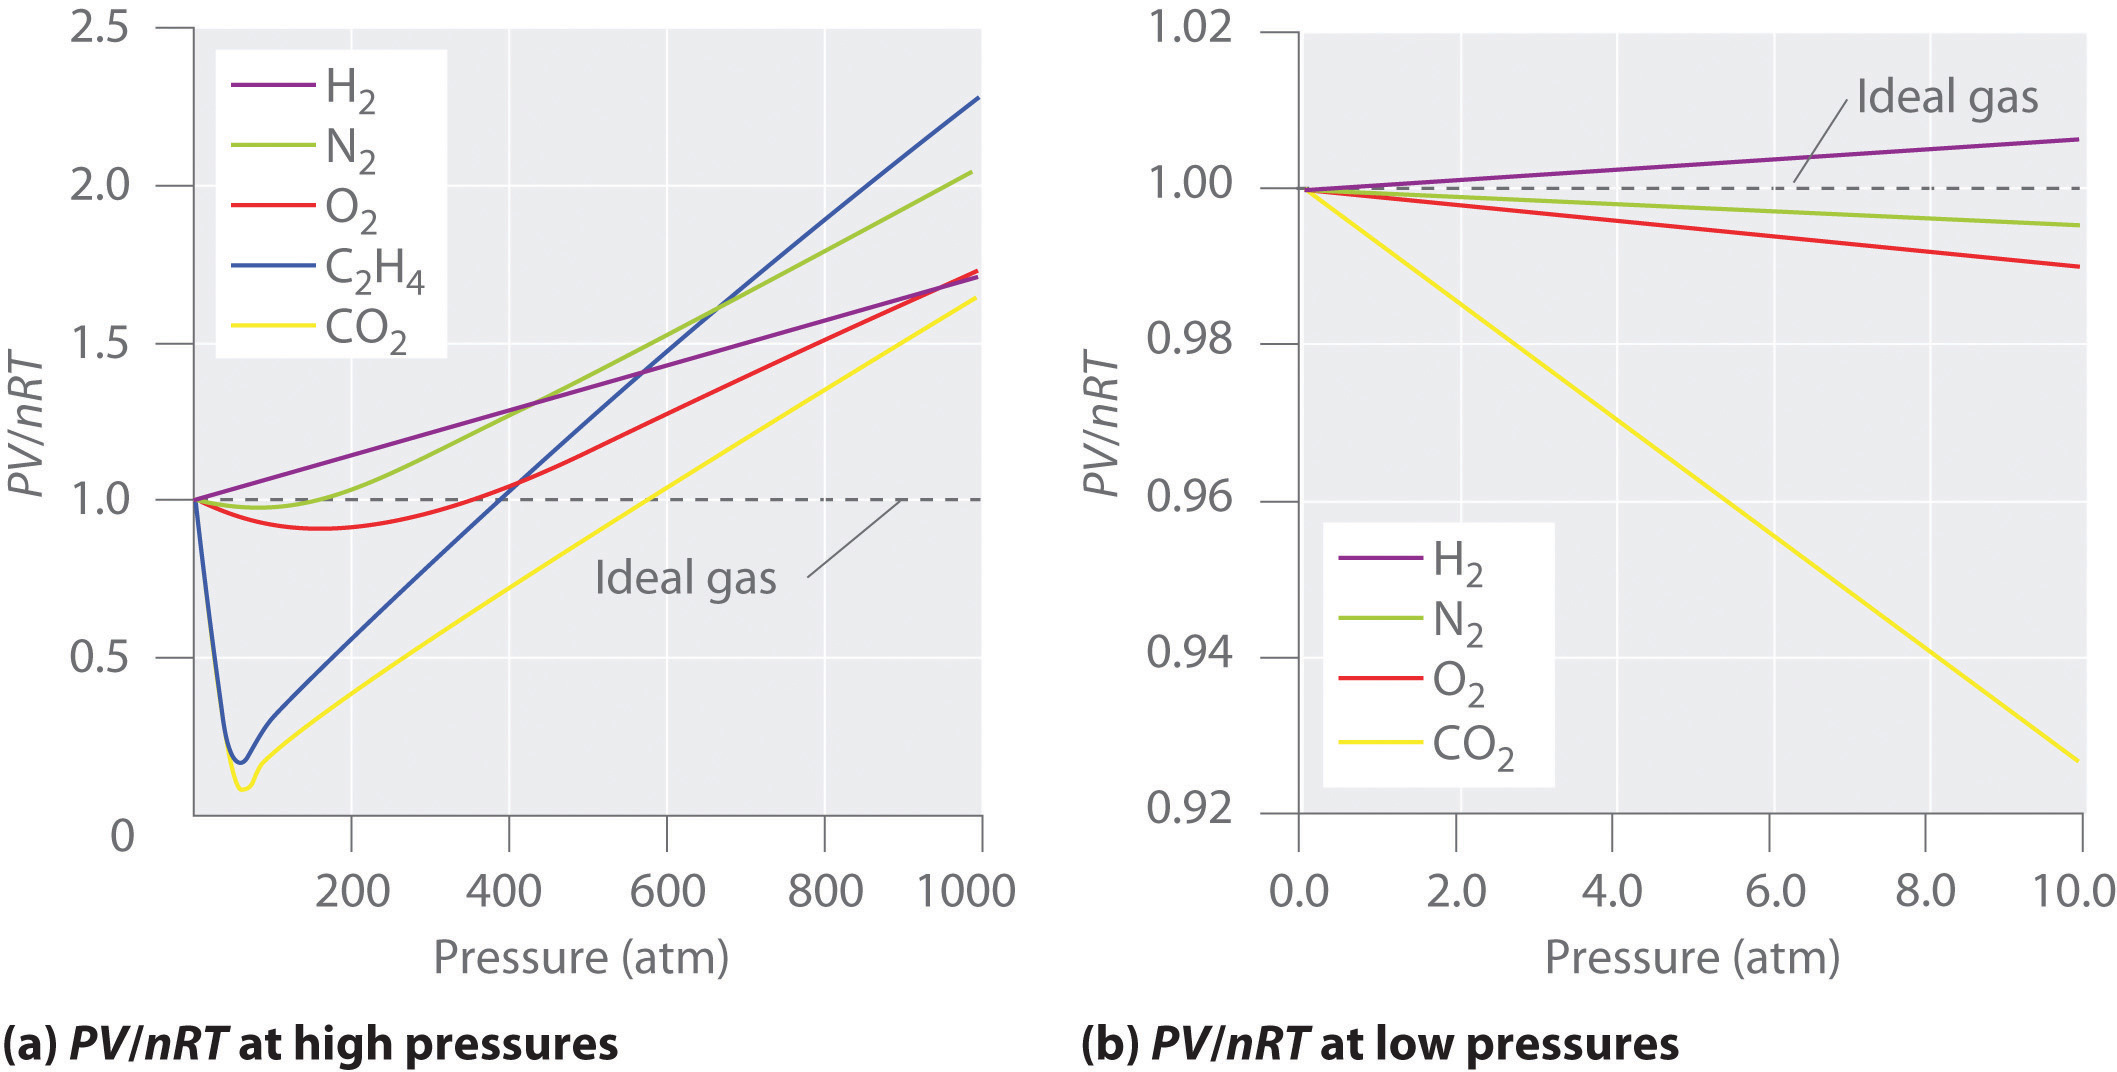
Figure \(\PageIndex{2}\): Two graphs of the compressibility factor (Z) vs. pressure at 273 K. The graph on the left shows real gases at high pressure. The graph on the right shows real gases at low pressure.
Figure \(\PageIndex{2}\) shows a plot of \(Z\) vs. \(P\) for several real gases and for an ideal gas. The plot on the left shows the non-ideality of real gases at high pressures. There are large negative deviations observed for C2H4 and CO2 because they liquefy at relatively low pressures. The plot on the right shows that for sufficiently low pressures (hence, low densities), each real gas approaches ideal-gas behavior, as expected.
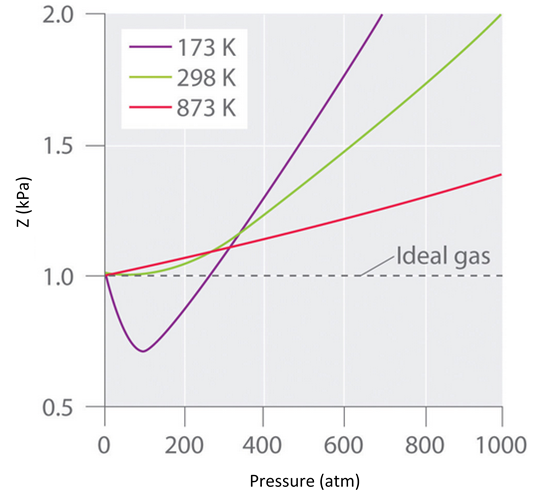
Real gases also tend to approach ideal gas behavior more closely at higher temperatures, as shown in Figure \(\PageIndex{3}\) for \(N_2\). Why do real gases behave so differently from ideal gases at high pressures and low temperatures? Under these conditions, the two basic assumptions behind the ideal gas law—namely, that gas molecules have negligible volume and that intermolecular interactions are negligible—are no longer valid.

Figure \(\PageIndex{3}\): The Effect of Temperature on the Behavior of Real Gases. A plot of \(Z\) versus \(P\) for nitrogen gas at three temperatures shows that the approximation to ideal gas behavior becomes better as the temperature increases.
Because the molecules of an ideal gas are assumed to have zero volume, the volume available to them for motion is always the same as the volume of the container. In contrast, the molecules of a real gas have small but measurable volumes. At low pressures, the gaseous molecules are relatively far apart, but as the pressure of the gas increases, the intermolecular distances become smaller and smaller (Figure \(\PageIndex{4}\)). As a result, the volume occupied by the molecules becomes significant compared with the volume of the container. Consequently, the total volume occupied by the gas is greater than the volume predicted by the ideal gas law. Thus at very high pressures, the experimentally measured value of \(Z\) is greater than the value predicted by the ideal gas law.

Figure \(\PageIndex{4}\): The Effect of Nonzero Volume of Gas Particles on the Behavior of Gases at Low and High Pressures. (a) At low pressures, the volume occupied by the molecules themselves is small compared with the volume of the container. (b) At high pressures, the molecules occupy a large portion of the volume of the container, resulting in significantly decreased space in which the molecules can move.
Moreover, all molecules are attracted to one another by a combination of forces. These forces become particularly important for gases at low temperatures and high pressures, where intermolecular distances are shorter. Attractions between molecules reduce the number of collisions with the container wall, an effect that becomes more pronounced as the number of attractive interactions increases. Because the average distance between molecules decreases, the pressure exerted by the gas on the container wall decreases, and the observed pressure is less than expected (Figure \(\PageIndex{4}\)). Thus as shown in Figure \(\PageIndex{3}\), at low temperatures, the value of \(Z\) is lower than predicted for an ideal gas, an effect that becomes particularly evident for complex gases and for simple gases at low temperatures. At very high pressures, the effect of nonzero molecular volume predominates. The competition between these effects is responsible for the minimum observed in the \(Z\) versus \(P\) plot for many gases.
Nonzero molecular volume makes the actual volume greater than predicted at high pressures; intermolecular attractions make the pressure less than predicted.
At high temperatures, the molecules have sufficient kinetic energy to overcome intermolecular attractive forces, and the effects of nonzero molecular volume predominate. Conversely, as the temperature is lowered, the kinetic energy of the gas molecules decreases. Eventually, a point is reached where the molecules can no longer overcome the intermolecular attractive forces, and the gas liquefies (condenses to a liquid). Figure \(\PageIndex{5}\) shows isotherms for isopentane, which look similar to the isotherms of a perfect gas above 215 K, because the sample remains a gas at all pressures and volumes. At temperatures below 215, the isotherms begin to show deviations from ideality. For instance, at 185 K, the sample is entirely in the gas phase when the container size is 20 mL. As the volume of the container is decreased, however, the gas eventually begins to condense; in this case at a pressure of around 32 atm and a volume of about 7 mL. The pressure remains constant as the volume is decreased, because the gas can continue to condense, but once all the gas has condensed (at a volume of about 3 mL), the pressure shoots up rapidly because the sample is entirely liquid, and cannot be compressed further.
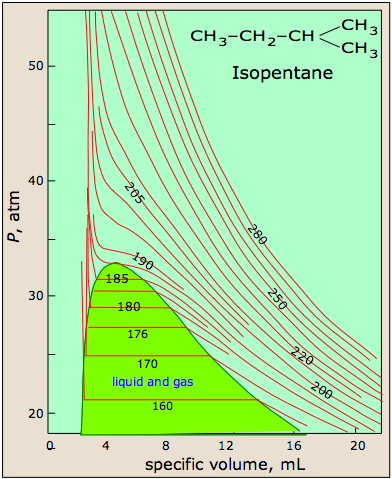
Figure \(\PageIndex{5}\): Isotherms of isopentane, a real gas. Image citation:http://www.chem1.com/acad/webtext/gas/gas_6.html
The Virial Equation of State
Because the perfect gas law is an imperfect description of a real gas, we can combine the perfect gas law and the compressibility factors of real gases to develop an equation to describe the isotherms of a real gas. This Equation is known as the Virial Equation of state, which expresses the deviation from ideality in terms of a power series in the density.
\[ \dfrac{P}{RT} = \rho + B\rho^2 + C\rho^3 + ...\label{1.3.3}\]
- \(B\) is the second virial coefficient,
- \(C\) is called the third virial coefficient, etc.
The second virial coefficient represents the initial departure from ideal-gas behavior, and describes the contribution of the pair-wise potential to the pressure of the gas. The third virial coefficient depends on interactions between three molecules. The jth virial coefficient can be calculated in terms of the interaction of j molecules in a volume \(V\). The second and third virial coefficients give most of the deviation from ideal \(\dfrac{P}{\rho R T}\) up to 100 atm. It is important to note that value of the virial coefficients are temperature dependent.
Because
\[\rho = \dfrac{n}{V} = \dfrac{1}{\bar V}\label{1.3.4}\]
and the virial Equation can be rearranged to
\[P \bar V = RT\left(1 + \dfrac{B}{\bar V} + \dfrac{C}{\bar V^2} + \cdots\right)\label{1.3.5}\]
Recall that
\[\dfrac{P \bar{V}}{R T}=Z\label{1.3.6}\]
and it is easy to see that because
\[P \bar V = ZRT\label{1.3.7}\]
then
\[Z =1 + \dfrac{B}{\bar V} + \dfrac{C}{\bar V^2} + \cdots\label{1.3.8}\]
Example \(\PageIndex{1}\): Virial Equation of state
Calculate the pressure exerted by 0.275 moles of N2 gas in a 0.500 L flask at 273 K using the first two terms of the series in Equation \(\ref{1.3.5}\). The value of \(B\) for N2 at 273 K is -10.5 \(\dfrac{cm^3}{mole}\).
Strategy:
a) Convert all terms to the correct units: V = 0.500 L = 0.500 dm3 = 5.00 x 10⁻⁴ m3
\[B = -10.5 \dfrac{cm^3}{mole} = -1.05 \times 10^{-5} \dfrac{m^3}{mole}\]
b) Calculate \(\bar V\)
\[\bar V = \dfrac{V}{n} = \dfrac{5.00 \times 10^{-4} m^3}{0.275 \,moles} = 1.82 \times 10^{-3}\dfrac{m^3}{mole}\]
c) Solve for P
\[P = \dfrac{RT}{\bar V}\left(1 + \dfrac{B}{\bar V}\right)\]
\[P =\dfrac{8.3145\dfrac{J}{mole·K}\, x \, 273 K}{1.82x10^{-3}\dfrac{m^3}{moles}}\, x \, \left(1-\dfrac{-1.05 x 10^{-5}\dfrac{m^3}{moles}}{1.82x10^{-3} \dfrac{m^3}{moles}}\right)\]
\[ P = 1240\, kPa\]
For a perfect gas, the pressure would be 1250 kPa.
Exercise \(\PageIndex{1}\)
Calculate the pressure exerted by 0.350 moles of CO2 gas in a 0.500 L flask at 273 K. The value of \(B\) for CO2 at 273 K is -149.7 \(\dfrac{cm^3}{mole}\).
Answer: 1420 kPa
The virial Equation of state is a model that attempts to describe the properties of a real gas. If it were a perfect model, the virial Equation would give results identical to those of the perfect gas law as the pressure of a gas sample approached zero. For the virial Equation to collapse to the perfect gas law, all of the virial coefficients would need to have a value of zero at the same temperature. This is an unlikely occurrence, but because the second term in the virial Equation, \(B = \dfrac{B}{\bar V}\) is the largest term in the Equation (\(\frac{1}{\bar V} \ll \frac{1}{\bar V^2} \ll \frac{1}{\bar V^3} \ll \cdots\)), we can focus on the temperature at which \(B\) is zero. This temperature is known as the Boyle temperature, TB, and it is the temperature at which the repulsive forces between the gas molecules exactly balance the attractive forces between the gas molecules.
Note
Equation \(\ref{1.3.5}\) can be rewritten as
\[P = RT\left(1 + \dfrac{B}{RT}P + \dfrac{C}{(RT)^2}P^2 + \cdots\right)\label{1.3.9}\]
in which case
\[Z = 1 + \dfrac{B}{RT}P + \dfrac{C}{(RT)^2}P^2 + \cdots\label{1.3.10}\]
Then
\[\dfrac{dZ}{dP} → \dfrac{B}{RT} \, as \, P → 0 \label{1.3.11}\]
At the Boyle temperature, B = 0, and the slope of the graph of the compression factor versus the pressure is zero at P = 0. Compared to other temperatures, the slope of the plot of Z versus P at the Boyle temperature begins to approach zero at relatively higher pressures, and so the real gas closely approximates a perfect gas over a wider range of pressures. A second look at Figure \(\PageIndex{3}\) for \(N_2\), shows us that the TB is near 298 K. (In fact it is roughly 327 K.)
As we have seen, the Boyle temperature, TB, is an intensive property of a real gas. A second defining temperature of a real gas is the critical temperature, TC, the temperature at and above which the gas phase can not be condensed into the liquid phase, no matter how great the pressure becomes. In Figure \(\PageIndex{5}\) for isopentane, the isotherm for the critical temperature of 187ºC shows that the compound is not following ideal behavior, yet it does not condense into a liquid. The critical point, defined by the critical temperature, TC, the critical pressure, PC, and the critical molar volume, VC, Is the point at which the interface defining the gas phase and the liquid phase disappears. Although the phase above the critical point is technically a gas, it has a much higher density than a typical gas, and it has much greater solvating properties than a gas. Thus, the phase beyond the critical point is usually called a supercritical fluid.
The van der Waals Equation
The Dutch physicist Johannes van der Waals (1837–1923; Nobel Prize in Physics, 1910) modified the ideal gas law to describe the behavior of real gases by explicitly including the effects of molecular size and intermolecular forces. In his description of gas behavior, the so-called van der Waals Equation,
\[ \left(P + \dfrac{an^2}{V^2}\right) (V − nb)=nRT \label{1.3.12}\]
which can also be written as
\[ \left(P + \dfrac{a}{\bar V^2}\right) (\bar V -b)=RT \label{1.3.13}\]
a and b are empirical constants that are different for each gas. The values of \(a\) and \(b\) are listed in Table \(\PageIndex{1}\) for several common gases.
| Gas | a ((L2·atm)/mol2) | b (L/mol) |
|---|---|---|
| He | 0.03410 | 0.0238 |
| Ne | 0.205 | 0.0167 |
| Ar | 1.337 | 0.032 |
| H2 | 0.2420 | 0.0265 |
| N2 | 1.352 | 0.0387 |
| O2 | 1.364 | 0.0319 |
| Cl2 | 6.260 | 0.0542 |
| NH3 | 4.170 | 0.0371 |
| CH4 | 2.273 | 0.0430 |
| CO2 | 3.610 | 0.0429 |
The pressure term in Equation \(\ref{1.3.12}\): \(P + (an^2/V^2\))—corrects for intermolecular attractive forces that tend to reduce the pressure from that predicted by the ideal gas law. Here, \(n^2/V^2\) represents the concentration of the gas (\(n/V\)) squared because it takes two particles to engage in the pairwise intermolecular interactions of the type shown in Figure \(\PageIndex{6}\). The volume term: \(V − nb\)—corrects for the volume occupied by the gaseous molecules, and thus takes into account repulsive forces among the molecules.
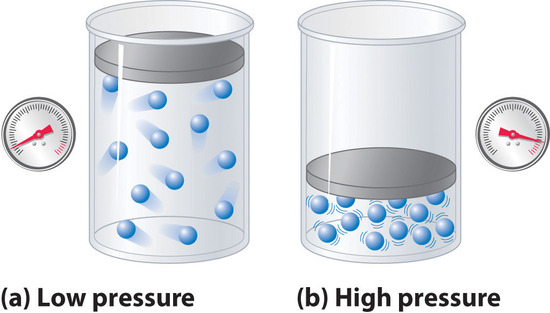
Figure \(\PageIndex{6}\): The Effect of Intermolecular Attractive Forces on the Pressure a Gas Exerts on the Container Walls. (a) At low pressures, there are relatively few attractive intermolecular interactions to lessen the impact of the molecule striking the wall of the container, and the pressure is close to that predicted by the ideal gas law. (b) At high pressures, with the average intermolecular distance relatively small, the effect of intermolecular interactions is to lessen the impact of a given molecule striking the container wall, resulting in a lower pressure than predicted by the ideal gas law.
The correction for volume is negative, but the correction for pressure is positive to reflect the effect of each factor on V and P, respectively. Because nonzero molecular volumes produce a measured volume that is larger than that predicted by the ideal gas law, we must subtract the molecular volumes to obtain the actual volume available. Conversely, attractive intermolecular forces produce a pressure that is less than that expected based on the ideal gas law, so the an2/V2 term must be added to the measured pressure to correct for these effects.
Example \(\PageIndex{2}\)
You are in charge of the manufacture of cylinders of compressed gas at a small company. Your company president would like to offer a 4.00 L cylinder containing 500 g of chlorine in the new catalog. The cylinders you have on hand have a rupture pressure of 40 atm. Use both the ideal gas law and the van der Waals Equation to calculate the pressure in a cylinder at 25°C. Is this cylinder likely to be safe against sudden rupture (which would be disastrous and certainly result in lawsuits because chlorine gas is highly toxic)?
Given: volume of cylinder, mass of compound, pressure, and temperature
Asked for: safety
Strategy:
A Use the molar mass of chlorine to calculate the amount of chlorine in the cylinder. Then calculate the pressure of the gas using the ideal gas law.
B Obtain a and b values for Cl2 from Table \(\PageIndex{1}\). Use the van der Waals relationship (Equation \(\ref{1.3.12}\)) to solve for the pressure of the gas. Based on the value obtained, predict whether the cylinder is likely to be safe against sudden rupture.
Solution:
A We begin by calculating the amount of chlorine in the cylinder using the molar mass of chlorine (70.906 g/mol):
\[n=\dfrac{m}{M}=\rm\dfrac{500\;g}{70.906\;g/mol}=7.052\;mol\]
Using the ideal gas law and the temperature in kelvins (298 K), we calculate the pressure:
\[P=\dfrac{nRT}{V}=\rm\dfrac{7.052\;mol\times0.08206\dfrac{L\cdot atm}{mol\cdot K}\times298\;K}{4.00\;L}=43.1\;atm\label{1.3.14}\]
If chlorine behaves like an ideal gas, you have a real problem!
B Now let’s use the van der Waals Equation with the a and b values for Cl2 from Table \(\PageIndex{1}\). Solving for P gives
\[\begin{split}P&=\dfrac{nRT}{V-nb}-\dfrac{an^2}{V^2}\\&=\rm\dfrac{7.052\;mol\times0.08206\dfrac{L\cdot atm}{mol\cdot K}\times298\;K}{4.00\;L-7.052\;mol\times0.0542\dfrac{L}{mol}}-\dfrac{6.260\dfrac{L^2atm}{mol^2}\times(7.052\;mol)^2}{(4.00\;L)^2}\\&=\rm28.2\;atm\end{split}\label{1.3.15}\]
This pressure is well within the safety limits of the cylinder. The ideal gas law predicts a pressure 15 atm higher than that of the van der Waals Equation.
Exercise \(\PageIndex{2}\)
A 10.0 L cylinder contains 500 g of methane. Calculate its pressure to two significant figures at 27°C using the
- ideal gas law.
- van der Waals Equation.
Answer: a. 77 atm; b. 67 atm
Three Features of the van der Waals Equation
1. Best Conditions: The van der Waals equation works best at high temperatures and large molar volumes. At high temperatures, the \(\dfrac {RT}{\bar V - b}\) term will be much greater than the \(\dfrac {a}{\bar V^2}\) term. At large molar volumes, \(\bar V - b\) will be essentially equal to \(\bar V\). Under these conditions, the van der Waals equation collapses to the perfect gas law.
2. van der Waals Loops: At temperatures below the critical temperature, oscillations in the calculated isotherms occur when both terms in the equation have similar magnitudes. This similarity in magnitudes occurs when the repulsive forces and attractive forces are similar in magnitude. These oscillations are often replaced by horizontal lines (see Figure \(\PageIndex{3}\)) in a process called the Maxwell construction, which allows us to see the conditions under which gas and liquid are in equilibrium.
3. van der Waals coefficients and Critical Constants: The critical isotherm can be used to calculate the critical constants because the critical isotherm has an inflection point with zero slope at the critical point. From the first derivative of the van der Waals equation we see that:
\[\dfrac {dP}{d\bar V} = -\dfrac {RT}{\left(\bar V - b\right)^2} + \dfrac {2a}{\bar V^3} = 0\label{1.3.16}\]
The second derivative gives us:
\[\dfrac {d^2P}{d\bar V^2} = \dfrac {2RT}{\left(\bar V - b\right)^3} - \dfrac {6a}{\bar V^4} = 0\label{1.3.17}\]
These two equations can be rearranged to
\[RT = \dfrac {2a(\bar V - b)^2}{\bar V^3}\label{1.3.18}\]
and
\[RT = \dfrac {3a(\bar V - b)^3}{\bar V^4}\label{1.3.19}\]
Setting Equations \(\ref{1.3.18}\) and \(\ref{1.3.19}\) equal to one another, and simplifying gives
\[\bar V_C = 3b\label{1.3.20}\]
Substituting this value back into Equation \(\ref{1.3.18}\) results in
\[T_C = \dfrac{8a}{27Rb}\label{1.3.21}\]
Substituting these values for \(\bar V_C\) and \(T_C\) into Equation \(\ref{1.3.13}\) allows us to determine that
\[P_C = \dfrac{a}{27b^2}\label{1.3.22}\]
With these relationships, it is possible to show that there is a critical compression factor for all gases:
\[Z_C = \dfrac{P_C \bar V_C}{RT_C} = \dfrac{3}{8}\label{1.3.23}\]
Although the value of \(Z_C\) for most gases varies from 0.375, the actual values are relatively close to this theoretical constant.
The Principle of Corresponding States
An additional assumption about real gases made by van der Waals was that all gases at corresponding states should behave similarly. The corresponding state that van der Waals choose to use is called the reduced state, which is based on the deviation of the conditions of a substance from its own critical conditions. Thus, the reduced properties for a gas are:
\[T_r = \dfrac{T}{T_C}\label{1.3.24}\]
\[P_r = \dfrac{P}{P_C}\label{1.3.25}\]
\[V_r = \dfrac{V_m}{V_C}\label{1.3.26}\]
If any substance is at its critical point, then \(T_r = P_r = V_r = 1\). van der Waals assumed that the values of these reduced properties should be the same for all real gases when existing under the same reduced conditions. In other words, all real gases at the same reduced temperature and the same reduced pressure should occupy the same reduced volume.
Example \(\PageIndex{3A}\): Reduced Properties
Calculate the reduced temperature and reduced pressure for a sample of helium at a temperature of 30.5 K and a pressure of 5.52 atm. The \(T_C\) of He is 5.2 K and the \(P_C\) of He is 2.26 atm.
Strategy:
Use Equations \(\ref{1.3.24}\), \(\ref{1.3.25}\), and \(\ref{1.3.26}\) to calculate the reduced parameters.
Solution
\[T_r = \dfrac{30.5 \,K}{5.2\, K} = 5.87\]
and
\[P_r =\dfrac{5.52 \,atm}{2.26\, atm} = 2.44\]
Example \(\PageIndex{3B}\):
Calculate the required pressure and temperature for a sample of O2 to be in a corresponding state with the He sample in Example \(\PageIndex{3A}\). The \(T_C\) of O2 is 154.8 K and the \(P_C\) of O2 is 50.14 atm.
Strategy:
Use Equations \(\ref{1.3.24}\), \(\ref{1.3.25}\), and \(\ref{1.3.26}\) to calculate the reduced parameters.
Solution
\[T = (5.87)(154.8\, K) = 909 K\]
and
\[P = (2.44)(50.14 \,atm) = 122.3 \,atm\]
Exercise \(\PageIndex{3}\)
Calculate the required pressure and temperature for a sample of CO2 to be in a corresponding state with the two samples in Example 1.3.3. The \(T_C\) of CO2 is 304.2 K and the \(P_C\) of CO2 is 72.9 atm.
Answer
\(T = 1786\, K\) and \(P = 178 \, atm\)
The basis for principle of corresponding states can be shown by substituting reduced properties into the van der Waals Equation \(\ref{1.3.13}\):
\[P_r·P_C = \dfrac{R·T_r·T_C}{V_r·V_C - b} - \dfrac{a}{V_r^2·V_C^2}\label{1.3.27}\]
We then substitute in the values of \(V_C\), \(T_C\), and \(P_C\) in terms of the constants \(a\) and \(b\) as defined in Equations \(\ref{1.3.20}\), \(\ref{1.3.21}\), and \(\ref{1.3.22}\):
\[\dfrac{aP_r}{27b^2} = \left(\dfrac{\dfrac{R8aT_r}{27Rb}}{3bV_r - b}\right) - \dfrac{a}{9b^2V_r^2}\label{1.3.28}\]
Solving for \(P_r\), we get
\[P_r = \dfrac{8T_r}{3V_r - 1} - \dfrac{3}{V_r^2}\label{1.3.29}\]
Equation \(\ref{1.3.29}\) contains no substance-dependent terms, and so theoretically describes any and all gases. In practice, the equation and the principle of corresponding states works best for non-polar, spherical molecules.
The most important aspect of the principle of corresponding states and equation \(ref{1.3.29}\) is that they enable us to compare properties of many gases on a single graph. One example is the plot of the value of the compressibility factor, \(Z_C\), versus the reduced pressure, \(P_r)\ at various reduced temperatures, with curves that are followed quite closely by many substances:
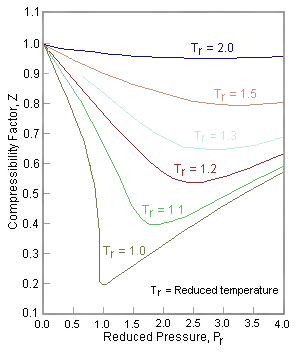
Figure \(\PageIndex{7}\): The compression factor of a typical real gas plotted using reduced variables. Many real gases, especially those with non-polar, spherical molecules are described well by these plots. (Public domain; Milton Beychok)
Summary
The van der Waals equation is one of several equations of state that describe gases more accurately than the perfect gas law, but less accurately than the virial equation. Two other common equations of state are the Berthelot equation and the Dieterici equation. The equation that you choose to describe a gas depends on the substance that your are studying and the required accuracy of your results.
Contributors and Attributions
Tom Neils (Grand Rapids Community College)