
In-Class Modular Unit
- Page ID
- 95986

\( \newcommand{\vecs}[1]{\overset { \scriptstyle \rightharpoonup} {\mathbf{#1}} } \)
\( \newcommand{\vecd}[1]{\overset{-\!-\!\rightharpoonup}{\vphantom{a}\smash {#1}}} \)
\( \newcommand{\dsum}{\displaystyle\sum\limits} \)
\( \newcommand{\dint}{\displaystyle\int\limits} \)
\( \newcommand{\dlim}{\displaystyle\lim\limits} \)
\( \newcommand{\id}{\mathrm{id}}\) \( \newcommand{\Span}{\mathrm{span}}\)
( \newcommand{\kernel}{\mathrm{null}\,}\) \( \newcommand{\range}{\mathrm{range}\,}\)
\( \newcommand{\RealPart}{\mathrm{Re}}\) \( \newcommand{\ImaginaryPart}{\mathrm{Im}}\)
\( \newcommand{\Argument}{\mathrm{Arg}}\) \( \newcommand{\norm}[1]{\| #1 \|}\)
\( \newcommand{\inner}[2]{\langle #1, #2 \rangle}\)
\( \newcommand{\Span}{\mathrm{span}}\)
\( \newcommand{\id}{\mathrm{id}}\)
\( \newcommand{\Span}{\mathrm{span}}\)
\( \newcommand{\kernel}{\mathrm{null}\,}\)
\( \newcommand{\range}{\mathrm{range}\,}\)
\( \newcommand{\RealPart}{\mathrm{Re}}\)
\( \newcommand{\ImaginaryPart}{\mathrm{Im}}\)
\( \newcommand{\Argument}{\mathrm{Arg}}\)
\( \newcommand{\norm}[1]{\| #1 \|}\)
\( \newcommand{\inner}[2]{\langle #1, #2 \rangle}\)
\( \newcommand{\Span}{\mathrm{span}}\) \( \newcommand{\AA}{\unicode[.8,0]{x212B}}\)
\( \newcommand{\vectorA}[1]{\vec{#1}} % arrow\)
\( \newcommand{\vectorAt}[1]{\vec{\text{#1}}} % arrow\)
\( \newcommand{\vectorB}[1]{\overset { \scriptstyle \rightharpoonup} {\mathbf{#1}} } \)
\( \newcommand{\vectorC}[1]{\textbf{#1}} \)
\( \newcommand{\vectorD}[1]{\overrightarrow{#1}} \)
\( \newcommand{\vectorDt}[1]{\overrightarrow{\text{#1}}} \)
\( \newcommand{\vectE}[1]{\overset{-\!-\!\rightharpoonup}{\vphantom{a}\smash{\mathbf {#1}}}} \)
\( \newcommand{\vecs}[1]{\overset { \scriptstyle \rightharpoonup} {\mathbf{#1}} } \)
\(\newcommand{\longvect}{\overrightarrow}\)
\( \newcommand{\vecd}[1]{\overset{-\!-\!\rightharpoonup}{\vphantom{a}\smash {#1}}} \)
\(\newcommand{\avec}{\mathbf a}\) \(\newcommand{\bvec}{\mathbf b}\) \(\newcommand{\cvec}{\mathbf c}\) \(\newcommand{\dvec}{\mathbf d}\) \(\newcommand{\dtil}{\widetilde{\mathbf d}}\) \(\newcommand{\evec}{\mathbf e}\) \(\newcommand{\fvec}{\mathbf f}\) \(\newcommand{\nvec}{\mathbf n}\) \(\newcommand{\pvec}{\mathbf p}\) \(\newcommand{\qvec}{\mathbf q}\) \(\newcommand{\svec}{\mathbf s}\) \(\newcommand{\tvec}{\mathbf t}\) \(\newcommand{\uvec}{\mathbf u}\) \(\newcommand{\vvec}{\mathbf v}\) \(\newcommand{\wvec}{\mathbf w}\) \(\newcommand{\xvec}{\mathbf x}\) \(\newcommand{\yvec}{\mathbf y}\) \(\newcommand{\zvec}{\mathbf z}\) \(\newcommand{\rvec}{\mathbf r}\) \(\newcommand{\mvec}{\mathbf m}\) \(\newcommand{\zerovec}{\mathbf 0}\) \(\newcommand{\onevec}{\mathbf 1}\) \(\newcommand{\real}{\mathbb R}\) \(\newcommand{\twovec}[2]{\left[\begin{array}{r}#1 \\ #2 \end{array}\right]}\) \(\newcommand{\ctwovec}[2]{\left[\begin{array}{c}#1 \\ #2 \end{array}\right]}\) \(\newcommand{\threevec}[3]{\left[\begin{array}{r}#1 \\ #2 \\ #3 \end{array}\right]}\) \(\newcommand{\cthreevec}[3]{\left[\begin{array}{c}#1 \\ #2 \\ #3 \end{array}\right]}\) \(\newcommand{\fourvec}[4]{\left[\begin{array}{r}#1 \\ #2 \\ #3 \\ #4 \end{array}\right]}\) \(\newcommand{\cfourvec}[4]{\left[\begin{array}{c}#1 \\ #2 \\ #3 \\ #4 \end{array}\right]}\) \(\newcommand{\fivevec}[5]{\left[\begin{array}{r}#1 \\ #2 \\ #3 \\ #4 \\ #5 \\ \end{array}\right]}\) \(\newcommand{\cfivevec}[5]{\left[\begin{array}{c}#1 \\ #2 \\ #3 \\ #4 \\ #5 \\ \end{array}\right]}\) \(\newcommand{\mattwo}[4]{\left[\begin{array}{rr}#1 \amp #2 \\ #3 \amp #4 \\ \end{array}\right]}\) \(\newcommand{\laspan}[1]{\text{Span}\{#1\}}\) \(\newcommand{\bcal}{\cal B}\) \(\newcommand{\ccal}{\cal C}\) \(\newcommand{\scal}{\cal S}\) \(\newcommand{\wcal}{\cal W}\) \(\newcommand{\ecal}{\cal E}\) \(\newcommand{\coords}[2]{\left\{#1\right\}_{#2}}\) \(\newcommand{\gray}[1]{\color{gray}{#1}}\) \(\newcommand{\lgray}[1]{\color{lightgray}{#1}}\) \(\newcommand{\rank}{\operatorname{rank}}\) \(\newcommand{\row}{\text{Row}}\) \(\newcommand{\col}{\text{Col}}\) \(\renewcommand{\row}{\text{Row}}\) \(\newcommand{\nul}{\text{Nul}}\) \(\newcommand{\var}{\text{Var}}\) \(\newcommand{\corr}{\text{corr}}\) \(\newcommand{\len}[1]{\left|#1\right|}\) \(\newcommand{\bbar}{\overline{\bvec}}\) \(\newcommand{\bhat}{\widehat{\bvec}}\) \(\newcommand{\bperp}{\bvec^\perp}\) \(\newcommand{\xhat}{\widehat{\xvec}}\) \(\newcommand{\vhat}{\widehat{\vvec}}\) \(\newcommand{\uhat}{\widehat{\uvec}}\) \(\newcommand{\what}{\widehat{\wvec}}\) \(\newcommand{\Sighat}{\widehat{\Sigma}}\) \(\newcommand{\lt}{<}\) \(\newcommand{\gt}{>}\) \(\newcommand{\amp}{&}\) \(\definecolor{fillinmathshade}{gray}{0.9}\)By the end of this module, students should be able to:
- Use chemical information to obtain concentration and manipulate concentration units
- Prepare standard solutions and an external calibration curve, determine R2 value and linear regression equation
- Determine the concentration of an analyte given raw data gathered by any of the following methods that incorporate:
- external standards
- internal standards
- standard additions
- Use standard addition and internal standard methods for determining concentration
Introduction
Accurately knowing the amount, in terms of concentration, of a particular substance (analyte) is important in fundamental research and also in many applied fields of study such as medicine, environmental studies, and the food industry.


In medicine, many drug dosages are effective within a narrow concentration range. If too little is administered, the benefits of the drug will not be obtained. However, if too much is administered in a particular time frame, overdose or toxicity can occur. Therefore, many patients must have their blood tested on a regular basis to determine the amount of such drugs in their system. Also, many common analytes such a metals are required by the human body at low levels, but are toxic to the cells at high levels.
In environmental studies, it is important to ensure that levels of environmental contaminants are monitored. In 2010 the BP Oil spill devastated the wildlife on the Gulf Coast of Mexico in the United States. It was one of the worst environmental accidents in the history of the United States. Years and vast amounts of money was required to clean up the spill. The Gulf waters have since been deemed safe to use; however, four years later, scientists still monitor the concentration of oil contaminants to ensure safety of Gulf water for patron use.
In the food industry, most products that are commercially available for human consumption are required to disclose the nutritional content of the product on the label (sodium, potassium, sugar, fat, etc.); most products in your kitchen cabinet will provide this information, which can be useful for health reasons. For example, individuals with hypertension need to monitor and limit the amount of sodium, present in common table salt, they consume on a daily basis. Therefore, they avoid food products that have a high sodium content.
The previous examples provide important reasons for knowing the concentration of a particular analyte in a sample (biological fluid, water, food etc.). The substance that we want to know the amount of in a sample is called the analyte. Common analytes include the pesticide alachlor in water, the antioxidant quercetin in plant foods, the carbohydrate glucose in blood, oxygen in air, and ethanol in water (rubbing alcohol). In order to determine the concentration of a particular analyte in a sample we must perform a procedure called “concentration calibration”. This module discusses the three most common types of concentration calibration procedures.
Q1. What is meant by the term “concentration” and what is the most common unit for concentration in a typical analytical measurement?
Q2. To answer this question, refer to M. Bener, M. Ozyurek, K. Guclu, R. Apak, Polyphenolic contents of natural dyes produced from industrial plants assayed by HPLC and novel spectrophotometric methods, Industrial Crops and Products, 2010, vol. 32, 499-506.
(a) find the concentration used to prepare all stock phenolic compounds in ethanol (b) Convert this unit to mM (c) Compare the numerical values in (a) and (b). What might be the advantage of reporting the value in mM?
Other common units of concentration contain prefixes to represent relatively small amounts of analyte (milli, m, 10-3; centi, c, 10-2; and micro, μ, 10-6); for example, 3 X 10⁻³ M = 3 mM. When a very small amount of analyte is present in a solution, it is convenient to represent the analyte concentration as the mass of analyte to the volume of solution (analyte mass:solution volume) in units such as parts per million (ppm, 1ppm=1mg/1L) or parts per billion (ppb, 2ppb=2mg/1L). For example, in the reference: J.A. Conquer, G. Maiani, E. Azzini, A. Raguzzini, and B.J. Holub, Supplementation with quercetin markedly increases plasma quercetin concentration without effect on selected risk factors for heart disease in healthy subjects, J. Nutr. March 1, 1998 vol. 128 no. 3, 593-597, a supplement tablet contains 250 mg quercetin along with other components.
Q3. If the supplement tablet is dissolved in 10 mL of solution (remember, 10 mL of water weighs 10 grams), what will be the concentration of quercetin in ppm?
Analytes themselves cannot be measured directly; however, specific properties of the analyte can. Many analysis techniques provide a response to a solution containing some concentration of an analyte. Two common ways to get a response for an analyte is to measured light absorbance or an electrochemical property. In some cases, a particular analyte of interest may only have one useful property available for measurement. However, some analytes have more than one property that can be measured. For example, the quercetin flavonoid molecule absorbs light and is electrochemically active. Hence, one might measure the light absorption properties or the electrochemical properties of quercetin in order to determine its concentration in a sample.
However, the absorption or electrochemical response of a sample of quercetin can rarely be used alone to determine the concentration in the sample. For example, the absorption or electrochemical measurement might be slightly different from one day to the next for the exact same sample due to a variety of uncontrollable variables including background noise from the instrument.
Q4. If an instrument response to the same concentration of an analyte varies from day-to-day, can you devise a procedure to determine the concentration of an analyte in a solution despite this issue?
General steps of a concentration calibration:
Finding suitable standard solutions
A primary standard analyte solution is a solution that contains a known amount of the analyte called the standard. The standard may be a pure analyte, a solution containing the analyte, or a solution containing the analyte along with other solutes; in either case, the analyte concentration is accurately known. The solution may be a solid, liquid, or gas phase solution and the standard analyte may exist in either of these three phases as well. Standards are referred to as Standard Reference Materials (SRM) because they have been tested by The National Institute of Standards and Technology (NIST). This agency ensures the analyte concentration in many types of samples is accurate. The picture below is a SRM for Gulf of Mexico Crude Oil, which may be used to test for crude oil contaminants, for example to monitor the safety of the gulf waters after the BP oil spill.
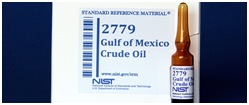
Figure taken from: http://www.nist.gov/publication-portal.cfm?defaultSearch=false&researchfield=245
Q5. What are common characteristics of a primary standard such as the one shown above?
Q6. Do you think that standards are available for all analytes? Why or why not? Elaborate.
Preparation of standard solutions
A primary standard solution is usually made into a stock solution (a solution that contains a relatively high amount of analyte). Then, the stock solution is diluted (mixed with solvent) to give a series of lower concentrations of the analyte; this is most commonly done using the serial dilution method as shown below for the dilution of quercetin with methanol in which an aliquot of the stock solution is transferred into a new volumetric flask, diluted and mixed well to produce diluted solution 1. Then, the same aliquot amount from diluted solution 1 is transferred into a new volumetric flask, diluted to the mark, and mixed well to prepare diluted solution 2. The process is repeated in this manner until a series of solutions have been prepared in which each successive solution is more dilute than the previous. The figure below illustrates preparation of three dilutions starting with a solid primary standard; It is common practice to dilute each successive solution by half of the previous solution concentration. The aliquot removed from the final solution is discarded to waste.
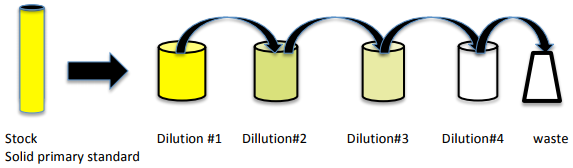
Calculations are performed using the Dilution Equation:
\[\mathrm{C_1V_1 = C_2V_2}\]
Where C is concentration, V is solution volume, and the subscripts 1 and 2 refer to the initial solution and the more dilute final solution, respectively.
Beer’s Law
Spectrophotometric measurements are one of the most frequently used methods in analytical laboratories; therefore, the Beer-Lambert Law, commonly referred to simply as Beer’s Law, is one of the most frequently utilized equations. This law shows the relationship between solution absorbance (A) and concentration of absorbing species (C) at a specific wavelength. The equation is given below:
\[\mathrm{A = εbC}\]
Where A = absorbance, ε = molar absorptivity, and C = concentration of absorbing species
In many cases, there is a proportional or linear relationship between A and C; therefore, when the concentration of the absorbing species increases, the absorbance of the solution increases and when the concentration of the absorbing species decreases, the absorbance decreases.
For example, if a solution of an analyte at 0.12 M produces an absorbance signal (corrected for blank response) of 0.50, the expected approximate absorbance of a 0.24M and 0.06M solution of the analyte would give an absorbance reading of approximately 1.0 and 0.25, respectively, assuming a linear relationship between the absorbance and concentration.
Quercetin is an antioxidant molecule that appears yellow in solution. Below are standard quercetin solutions in methanol which range in concentration from 1000 mM to 9.16X10⁻³ mM, along with a solution blank.
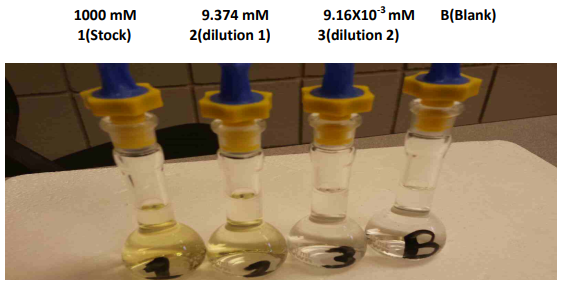
Q7. Why do you think the stock solution has a stronger yellow color than the 9.374 mM quercetin solution?
Q8. To the human eye, the 9.16X10⁻³ mM quercetin standard solution depicted above is indistinguishable from the blank solution. But in the UV-VIS absorbance spectrophotometer, the absorbance measured for this solution is significantly larger than that measured from the blank. Explain why this might be, and reference Beer’s law in your answer.
Q9. Refer to Bener et al., 2010 section 2.4. CUPRAC assay of total antioxidant capacity. The authors use a reagent blank solution in their measurements. What do you think the blank solution is composed of and why do you think there is a need for a blank solution?
Q10. Refer to reference Bener et. al., 2010. Use the phenolic acid stock solution concentration and the dilution equation to calculate the volume of the stock solution required to prepare a 1 mL solution containing .25 mM quercetin.
Q11. For the series of quercetin standard solutions below, plot the concentration values on the x-axis and the absorbance values on the y-axis using excel.
If you need a refresher on plotting graphs using Excel, visit the following website:
http://www.ncsu.edu/labwrite/res/gt/gt-reg-home.html
|
Quercetin standard concentration (mM) |
Absorbance at 270nm |
|---|---|
|
500 |
0.81 |
|
375 |
0.62 |
|
250 |
0.40 |
|
125 |
0.19 |
The resulting plot is called a calibration curve, and the method used to obtain it is called the external calibration method.
Linear Regression and the Method of Least Squares
Regression lines are a visual way to depict the relationship between independent (x) and dependent (y) variables in a graph like the one generated in question 10 . For linear regression, the equation that best represents the relationship between x and y is called the linear regression equation; it is the equation that is a best fit to a straight line, y = mx + b, where y values represent the detector responses to some physical property of the analyte at different concentrations, m is the slope of the line, x values represent the different concentrations of the standard analyte, and b is the y intercept. The linear regression equation is commonly referred to as the calibration equation. Linear regression models are often fitted using the Least Squares method. This method is used to draw the best straight line through experimental data points that have some scatter and do not lie perfectly on a straight line; some points will lie above the line and some points will lie below the line. This procedure assumes that the error in the y values are greater than the error in the x values and that the standard deviation in the y values are similar. Because the goal is to minimize the magnitude of the deviations regardless of the signs, all deviations are squared so that all numbers are positive; hence, the method is called “Method of Least Squares”. How well the resulting regression equation describes the data is expressed as a correlation coefficient, R2 (R-squared). The closer R2 is to 1.00, the better the fit because the data will more closely fit the equation for a straight line in which R2 is 1.00 .
Q12. Determine the regression equation and R2 value for the graph in Q10 .
Visit the website below for a refresher on how to determine this information.
http://www.ncsu.edu/labwrite/res/gt/gt-reg-home.html
Q13. Use the equation information generated in Q11 to calculate the concentration of quercetin that would yield an absorbance of 0.30
The general steps involved in using standard analyte concentration and detector response data to calculate an unknown analyte concentration using linear regression and the method of least squares is as follows:
1. Create a scatter plot of the data
2. Create a linear regression line (trendline)
3. Obtain a regression equation and R-squared value
4. Rearrange the regression equation to calculate the unknown analyte concentration (software can automatically perform this calculation)
Q14. Referring to the calibration curve you determined for quercetin in Q10, what could be done to obtain the concentration of quercetin in a solution that has an absorbance reading beyond the linear range of the calibration curve (for example, when a sample absorbance value is 3)?
Accounting for changes in extraction efficiency
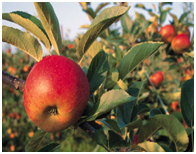
Suppose you wanted to measure the quercetin concentration in a plant food such as Prunus serotina. Before performing the measurement, you would first need to remove quercetin from the plant sample because the plant itself will not be compatible with the measurement technique. For example, most measurement techniques require the sample in liquid form. A likely procedure for removing the quercetin from the plant is to use an extraction process. A sample of the plant might be mixed with a suitable solvent in a blender, homogenized and filtered. One concern in this process is whether all of the quercetin has been extracted from the plant. If a lesser amount is extracted, the concentration of quercetin in Prunus serotina will be underestimated using an external standard curve.
Q15.Can you think of a way to determine the extraction efficiency of an analyte such as quercetin?
Internal Standard Method
An internal standard (I.S.) in analytical chemistry is a substance that is similar to the analyte that is added in a constant amount to the blank, the standards, and the samples. Internal standards should be primary standards just as external standards should. They are useful to compensate for changes in extraction efficiency, detector response due to sample loss during other sample preparation steps, fluctuations in sample analyzed, or changes in detector response due to different flow rates. Internal standards are widely used in chromatography because of differences in the reproducibility of sample injected into the chromatograph. All of these changes should affect the internal standard to the same degree as the analyte so that the ratio of the standard to analyte remains constant.
Refer to the following reference to answer Q16: J. Zhang, M.B. Satterfield, J. S. Brodbelt, S.J. Britz, B. Clevidence, J.A. Novotny, Structural characterization and detection of kale flavonoids by electrospray ionization mass spectrometry, Anal. Chem., 2003, vol.75, 6401-6407.
Q16. What internal standard did the author’s use in the paper? Based on the internal standard used, identify the characteristics of an appropriate I.S. for quercetin?
In a high performance liquid chromatography experiment, a standard solution containing 0.0750 M of quercetin, represented by X, and 0.0600M of internal standard kaempferol, represented by S, gave peak areas of Ax=300 and As=200 (areas in arbitrary units), respectively. The response factor or response ratio (F) can be calculated using the following equation and rearranging the equation to solve for F:
Standard Mixture:
\[\dfrac{Ax}{[X]}=F\left(\dfrac{As}{[S]} \right )\]
Where [X] and [S] are the concentrations of X and S in moles per liter.
The concentration of quercetin [X] in a sample extract can then be determined by spiking the extract with a known amount of the internal standard [S] kaempferol, measuring both the quercetin and kaempferol peak areas, and using the equation above and the F value obtained from the standards to calculate the concentration of quercetin [X] in the extract.
Q17. Consider the data provided above: a standard solution containing 75 ppm of quercetin and 60 ppm of internal standard kaempferol gave peak areas of 300 and 200, respectively. A plant sample is spiked such that the extract to be analyzed should have 60 ppm of kaempferol. Analysis of the sample gives a peak area for the kaempferol of 163. The quercetin peak in the same extract has an area of 407. What is the concentration of quercetin in the extract?
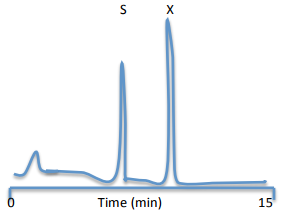
As shown in the chromatogram below, the area under each peak is proportional to the concentration of the species injected into the column. However, the detector generally has a different response to each component. For example, if both the quercetin (X) and kaempferol (S) have concentrations of 10.0 mM, the area under the analyte peak (AX) might be 2.30 times greater than the area under the standard peak (AS). We say that the detector response ratio or response factor, F, is 2.30 times greater for X than for S.
Q18. Refer to reference: M. Olszewska, Quantitative HPLC analysis of flavonoids and chlorogenic acid in the leaves and inflorescences of Prunus serotina EHRH, Acta Chromatographica no. 19 2007, 253-269. (www.us.edu.pl/uniwersytet/jednostki/wydzialy/chemia/acta/ac19/zrodla/23_AC19.pdf). What extraction efficiency (recovery) do the authors report for quercetin in the leaves of the cherry tree (Prunus serotina) sample? How do the authors determine the percent quercetin that is extracted from this sample?
Accounting for matrix effects
Another common problem that can occur in chemical analysis is known as a matrix effect. The matrix is everything else in the sample except the analyte. Components of the matrix may interact with the analyte and alter its response in the measurement technique. Matrix effects can sometimes enhance the response, whereas other times they can decrease the response. For example, interactions of metals such as aluminum in the matrix with quercetin may cause variations in the absorbance at the wavelength used for the measurement. Since the components that make up the matrix are often complex, not completely known, and possibly vary from sample to sample, an internal standard may not exhibit an identical matrix effect to that of the analyte.
Q19. Can you devise a procedure that would allow you to account for the matrix effect on the absorbance measurement of quercetin?
Standard Addition Method
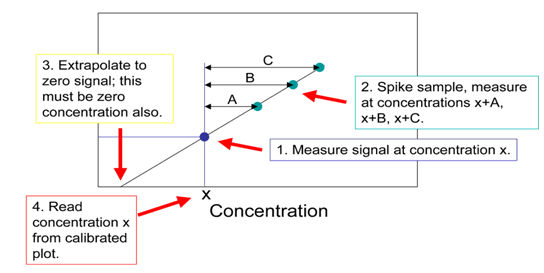
The standard addition method is similar to the external calibration method in that the concentration of an analyte is determined by comparison to a set of standard solutions of the analyte. However, in the standard addition method, increasing quantities of the standard are added to samples to correct for ‘matrix effects’ (a change in the analytical signal caused by anything in the sample other than the analyte). This is called “spiking.” The concentration of the analyte is obtained by extrapolating back to the x-intercept; the absolute value of the x-intercept is the concentration of the unknown as shown below:
Q20. Refer to reference Berner et. al., 2010. Determine the concentration of quercetin in Rubia tinctorum L. extract from figure 2.
Q21. In Q13, the sample had an absorbance value of 0.30. The same sample is now subjected to a standard addition experiment. The table below shows the concentrations of quercetin spiked into the sample and the resulting absorbances. Plot the calibration curve and determine the amount of quercetin in the original (unspiked) sample. How does the concentration of quercetin in the sample compare with the value in Q13? Did the matrix have an effect on the measurement? If so, what effect did it have?
| Quercetin Concentration (mM) | Detector Signal |
|---|---|
| 0 | 0.300 |
| 50 | 0.367 |
| 100 | 0.444 |
| 150 | 0.512 |
| 200 | 0.577 |
REFERENCES
Module questions:
M. Olszewska, Quantitative HPLC analysis of flavonoids and chlorogenic acid in the leaves and inflorescences of Prunus serotina EHRH, Acta Chromatographica no. 19 2007, 253-269. (www.us.edu.pl/uniwersytet/jednostki/wydzialy/chemia/acta/ac19/zrodla/23_AC19.pdf)
M. Bener, M. Ozyurek, K. Guclu, R. Apak, Polyphenolic contents of natural dyes produced from industrial plants assayed by HPLC and novel spectrophotometric methods, Industrial Crops and Products, 2010, vol. 32, 499-506.
J. Zhang, M.B. Satterfield, J. S. Brodbelt, S.J. Britz, B. Clevidence, J.A. Novotny, Structural characterization and detection of kale flavonoids by electrospray ionization mass spectrometry, Anal. Chem., 2003, vol.75, 6401-6407.
J.A. Conquer, G. Maiani, E. Azzini, A. Raguzzini, and B.J. Holub, Supplementation with quercetin markedly increases plasma quercetin concentration without effect on selected risk factors for heart disease in healthy subjects, J. Nutr. March 1, 1998 vol. 128 no. 3, 593-597.
Background Reading:
A.J. Larson, J.D. Symons, T. Jalili, Therapeutic potential of quercetin to decrease blood pressure:review of efficacy and mechanisms, Adv. Nutr., 2012, vol. 3, 39-46.
F. Perez-Vizcaino, J. Duarte, R. Andriantsitohaina, Endothelial function and cardiovascular disease: Effects of quercetin and wine polyphenols, Free Radical Research, October 2006, vol. 40 no. 10, 1054-1065.
Additional Resources:
High Pressure Liquid Chromatographic Determination of Nitrendipine in Human Plasma After Solid Phase Extraction, J. Liq. Chromatogr. Rel. Technol. 1999, 22 (9), 1381 – 1390.
Quantitative Determination of Deferiprone in Human Plasma by Reverse Phase High Performance Liquid Chromatography and its Application to Pharmacokinetic Study, Pak. J. Pharm. Sci. 2012, 25 (2), 343 – 348.
Determination of Biochemical Oxygen Demand of Area Waters: A Bioassay Procedure for Environmental Monitoring, J. Chem. Educ. 2012, 89, 807 – 811.
Simultaneous Determination of Methylxanthines in Coffees and Teas by UV-Vis Spectrophotometry and Partial Least Squares, Analytica Chimica Acta. 2003, 493 (1), 83 – 94.
Lab Exercises for Internal Standard Method:
Determination of the Antibiotic Oxytetracycline in Commercial Milk by Solid-Phase Extraction: A High-Performance Liquid Chromatography (HPLC) Experiment for Quantitative Instrumental Analysis, J. Chem. Educ. 2012, 89, 656 – 659.
Lab Exercise for External Calibration and Standard Addition Methods:
Undergraduate Analytical Chemistry: Method Development and Results of the Analysis of Bismuth in Pharmaceuticals, Spectr. Lett. 2010, 43, 545 – 549.
Francisco Perez-Vizcaino, Juan Duarte, and Ramaroson Andriantsitohaina, Endothelial function and cardiovascular disease: Effects of quercetin and wine polyphenols, Free Radical Research, October 2006; 40(10): 1054-1065.
The authors thank Dr. Tom Wenzel, Bates College, Dr. Sheila A. Sanders, New York University, and the ASDL group members for valuable feedback on this module.