
Atomic Spectra
- Page ID
- 392376
\( \newcommand{\vecs}[1]{\overset { \scriptstyle \rightharpoonup} {\mathbf{#1}} } \)
\( \newcommand{\vecd}[1]{\overset{-\!-\!\rightharpoonup}{\vphantom{a}\smash {#1}}} \)
\( \newcommand{\dsum}{\displaystyle\sum\limits} \)
\( \newcommand{\dint}{\displaystyle\int\limits} \)
\( \newcommand{\dlim}{\displaystyle\lim\limits} \)
\( \newcommand{\id}{\mathrm{id}}\) \( \newcommand{\Span}{\mathrm{span}}\)
( \newcommand{\kernel}{\mathrm{null}\,}\) \( \newcommand{\range}{\mathrm{range}\,}\)
\( \newcommand{\RealPart}{\mathrm{Re}}\) \( \newcommand{\ImaginaryPart}{\mathrm{Im}}\)
\( \newcommand{\Argument}{\mathrm{Arg}}\) \( \newcommand{\norm}[1]{\| #1 \|}\)
\( \newcommand{\inner}[2]{\langle #1, #2 \rangle}\)
\( \newcommand{\Span}{\mathrm{span}}\)
\( \newcommand{\id}{\mathrm{id}}\)
\( \newcommand{\Span}{\mathrm{span}}\)
\( \newcommand{\kernel}{\mathrm{null}\,}\)
\( \newcommand{\range}{\mathrm{range}\,}\)
\( \newcommand{\RealPart}{\mathrm{Re}}\)
\( \newcommand{\ImaginaryPart}{\mathrm{Im}}\)
\( \newcommand{\Argument}{\mathrm{Arg}}\)
\( \newcommand{\norm}[1]{\| #1 \|}\)
\( \newcommand{\inner}[2]{\langle #1, #2 \rangle}\)
\( \newcommand{\Span}{\mathrm{span}}\) \( \newcommand{\AA}{\unicode[.8,0]{x212B}}\)
\( \newcommand{\vectorA}[1]{\vec{#1}} % arrow\)
\( \newcommand{\vectorAt}[1]{\vec{\text{#1}}} % arrow\)
\( \newcommand{\vectorB}[1]{\overset { \scriptstyle \rightharpoonup} {\mathbf{#1}} } \)
\( \newcommand{\vectorC}[1]{\textbf{#1}} \)
\( \newcommand{\vectorD}[1]{\overrightarrow{#1}} \)
\( \newcommand{\vectorDt}[1]{\overrightarrow{\text{#1}}} \)
\( \newcommand{\vectE}[1]{\overset{-\!-\!\rightharpoonup}{\vphantom{a}\smash{\mathbf {#1}}}} \)
\( \newcommand{\vecs}[1]{\overset { \scriptstyle \rightharpoonup} {\mathbf{#1}} } \)
\(\newcommand{\longvect}{\overrightarrow}\)
\( \newcommand{\vecd}[1]{\overset{-\!-\!\rightharpoonup}{\vphantom{a}\smash {#1}}} \)
\(\newcommand{\avec}{\mathbf a}\) \(\newcommand{\bvec}{\mathbf b}\) \(\newcommand{\cvec}{\mathbf c}\) \(\newcommand{\dvec}{\mathbf d}\) \(\newcommand{\dtil}{\widetilde{\mathbf d}}\) \(\newcommand{\evec}{\mathbf e}\) \(\newcommand{\fvec}{\mathbf f}\) \(\newcommand{\nvec}{\mathbf n}\) \(\newcommand{\pvec}{\mathbf p}\) \(\newcommand{\qvec}{\mathbf q}\) \(\newcommand{\svec}{\mathbf s}\) \(\newcommand{\tvec}{\mathbf t}\) \(\newcommand{\uvec}{\mathbf u}\) \(\newcommand{\vvec}{\mathbf v}\) \(\newcommand{\wvec}{\mathbf w}\) \(\newcommand{\xvec}{\mathbf x}\) \(\newcommand{\yvec}{\mathbf y}\) \(\newcommand{\zvec}{\mathbf z}\) \(\newcommand{\rvec}{\mathbf r}\) \(\newcommand{\mvec}{\mathbf m}\) \(\newcommand{\zerovec}{\mathbf 0}\) \(\newcommand{\onevec}{\mathbf 1}\) \(\newcommand{\real}{\mathbb R}\) \(\newcommand{\twovec}[2]{\left[\begin{array}{r}#1 \\ #2 \end{array}\right]}\) \(\newcommand{\ctwovec}[2]{\left[\begin{array}{c}#1 \\ #2 \end{array}\right]}\) \(\newcommand{\threevec}[3]{\left[\begin{array}{r}#1 \\ #2 \\ #3 \end{array}\right]}\) \(\newcommand{\cthreevec}[3]{\left[\begin{array}{c}#1 \\ #2 \\ #3 \end{array}\right]}\) \(\newcommand{\fourvec}[4]{\left[\begin{array}{r}#1 \\ #2 \\ #3 \\ #4 \end{array}\right]}\) \(\newcommand{\cfourvec}[4]{\left[\begin{array}{c}#1 \\ #2 \\ #3 \\ #4 \end{array}\right]}\) \(\newcommand{\fivevec}[5]{\left[\begin{array}{r}#1 \\ #2 \\ #3 \\ #4 \\ #5 \\ \end{array}\right]}\) \(\newcommand{\cfivevec}[5]{\left[\begin{array}{c}#1 \\ #2 \\ #3 \\ #4 \\ #5 \\ \end{array}\right]}\) \(\newcommand{\mattwo}[4]{\left[\begin{array}{rr}#1 \amp #2 \\ #3 \amp #4 \\ \end{array}\right]}\) \(\newcommand{\laspan}[1]{\text{Span}\{#1\}}\) \(\newcommand{\bcal}{\cal B}\) \(\newcommand{\ccal}{\cal C}\) \(\newcommand{\scal}{\cal S}\) \(\newcommand{\wcal}{\cal W}\) \(\newcommand{\ecal}{\cal E}\) \(\newcommand{\coords}[2]{\left\{#1\right\}_{#2}}\) \(\newcommand{\gray}[1]{\color{gray}{#1}}\) \(\newcommand{\lgray}[1]{\color{lightgray}{#1}}\) \(\newcommand{\rank}{\operatorname{rank}}\) \(\newcommand{\row}{\text{Row}}\) \(\newcommand{\col}{\text{Col}}\) \(\renewcommand{\row}{\text{Row}}\) \(\newcommand{\nul}{\text{Nul}}\) \(\newcommand{\var}{\text{Var}}\) \(\newcommand{\corr}{\text{corr}}\) \(\newcommand{\len}[1]{\left|#1\right|}\) \(\newcommand{\bbar}{\overline{\bvec}}\) \(\newcommand{\bhat}{\widehat{\bvec}}\) \(\newcommand{\bperp}{\bvec^\perp}\) \(\newcommand{\xhat}{\widehat{\xvec}}\) \(\newcommand{\vhat}{\widehat{\vvec}}\) \(\newcommand{\uhat}{\widehat{\uvec}}\) \(\newcommand{\what}{\widehat{\wvec}}\) \(\newcommand{\Sighat}{\widehat{\Sigma}}\) \(\newcommand{\lt}{<}\) \(\newcommand{\gt}{>}\) \(\newcommand{\amp}{&}\) \(\definecolor{fillinmathshade}{gray}{0.9}\)Please enter your observations and thoughts into this summary sheet, which you will hand in at the end of lab.
- To perform flame tests of metal cations in order to observe their characteristic colors,
- To perform calculations to determine the frequency and energy of the emitted photons.
- To relate these results to the types of electronic transitions occurring in these elements.
- To observe and understand line emission spectra of atoms using a computer simulation and gas-discharge tubes.
Introduction
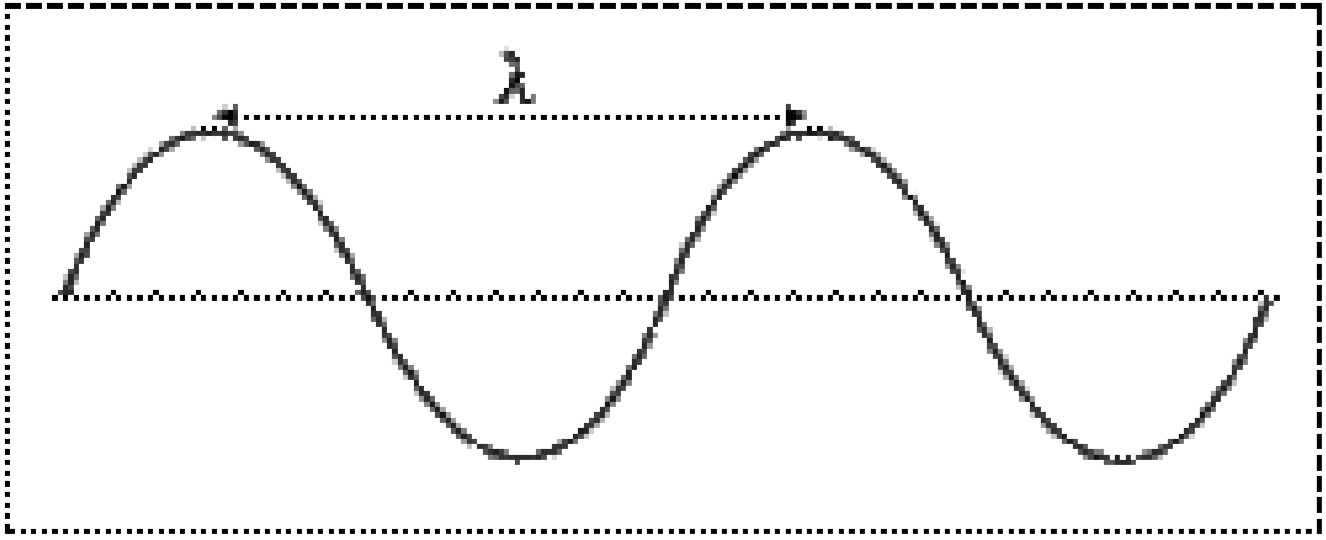
Electromagnetic radiation is energy in the form of waves. Waves are characterized by their wavelength (\(\lambda\)) and frequency (\(\nu\)). Wavelength is defined as the distance between successive crests (or troughs) on a wave, and is measured in meters. Frequency is defined as the number of waves that pass a given point every second, and is measured in 1/seconds (1/s or s-1), or Hertz (Hz).
All electromagnetic waves travel at the speed of light (\(c\)), or \(3.0 \times 10^8 m/s\). The relationship between the wavelength, frequency and speed of a wave is given by the equation:
\[c= \lambda \times \nu\]
Electromagnetic radiation also occurs as discreet “packets” called photons. The energy (\(E\)) of a photon (in Joules, J) is given by the equation:
\[E_{photon}= h \times \nu\]
Here, \(h\) is Planck’s constant, which has a value of \(6.63 \times 10^{-34} J \cdot s\).
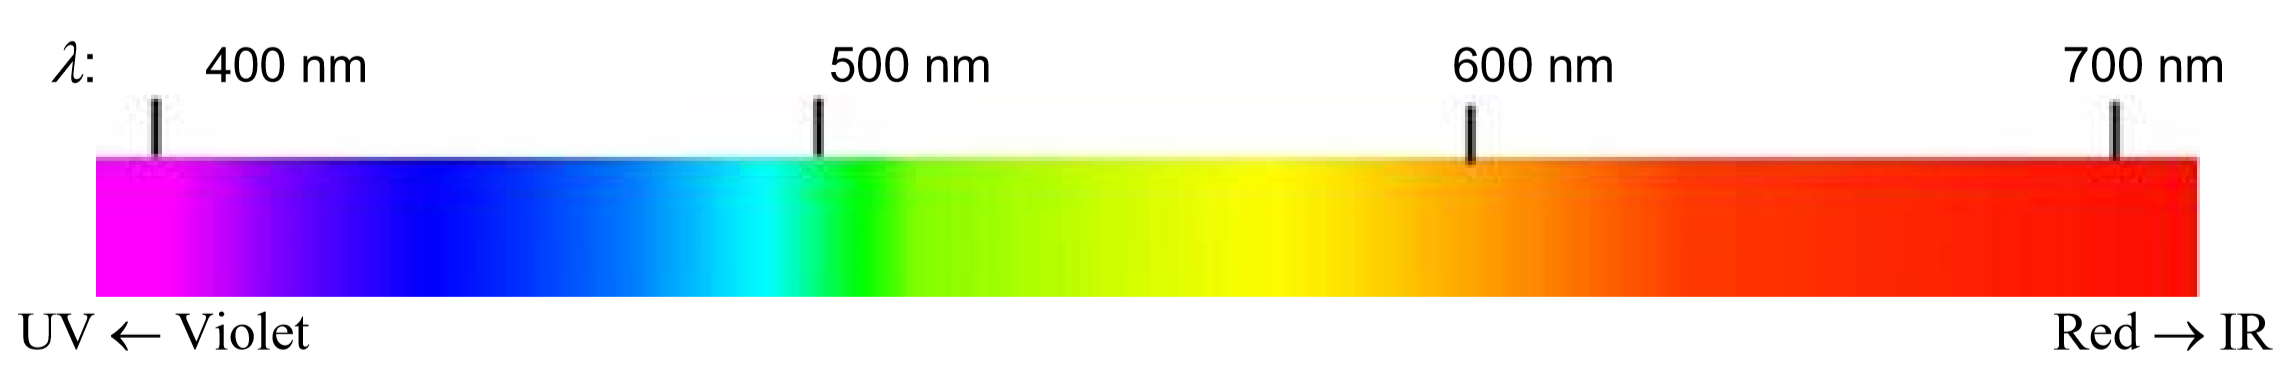
Visible light is the most familiar example of electromagnetic radiation. Differences in the wavelengths of visible light are manifested as different colors, shown in the color spectrum below (colors can be seen in the PDF document on-line). Other examples of electromagnetic radiation include X-rays, ultraviolet light, infrared light, microwaves and radio waves.
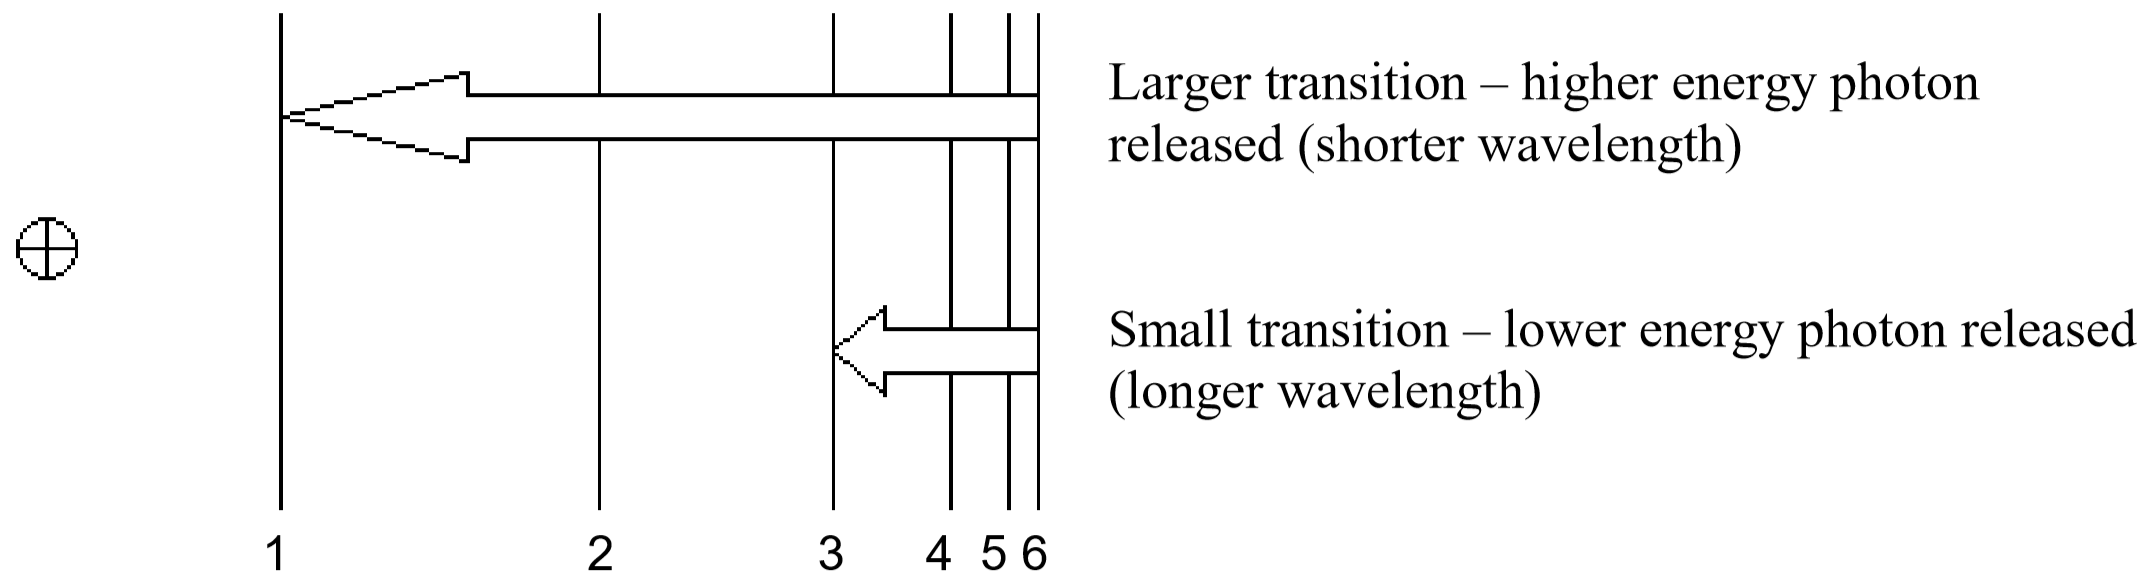
So, how does electromagnetic radiation relate to flame tests? Well, when an atom or ion absorbs energy, its electrons can make transitions from lower energy levels to higher energy levels. The energy absorbed could be in the form of heat (as in flame tests), or electrical energy, or electromagnetic radiation. However, when electrons subsequently return from higher energy levels to lower energy levels, energy is released predominantly in the form of electromagnetic radiation.
The spacing between energy levels in an atom determines the sizes of the transitions that occur, and thus the energy and wavelengths of the collection of photons emitted.
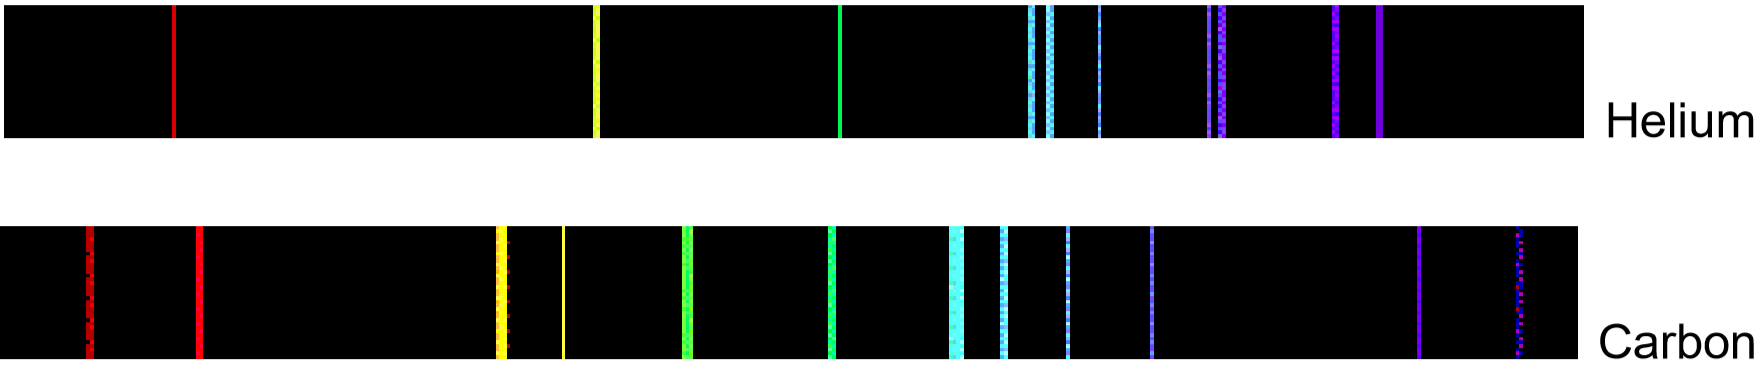
If emitted photons are in the visible region of the spectrum, they may be perceived as lines of different colors (note that photons outside the visible spectrum may also be emitted, but cannot be seen). The result is called a line emission spectrum, and can serve as a ‘fingerprint’ of the element to which the atoms belong. For example, the line spectra shown below for the elements helium and carbon are clearly quite different.
Unfortunately, techniques more sophisticated than those used in this lab are required to obtain such line spectra. To the naked eye, when an element is vaporized in a flame (or an electrical discharge)the emission spectrum will appear to be just one color. For example, helium gas when excited by an electrical discharge emits light that appears an orange- peach color. This one color results from a combination of all lines of the emission spectrum, in proportion to their intensities. As many elements will still produce distinctive colors under such conditions, simple flame tests can be used to identify these elements. In fact, flame tests were used to identify elements long before the invention of modern techniques, such as emission spectroscopy.
Procedure
Materials and Equipment
Looped platinum or nichrome wires, wash bottle with distilled water, Bunsen burner, and the following solutions: \(\ce{NaCl}\) (aq), \(\ce{KCl}\) (aq), \(\ce{CuCl2}\) (aq), and \(\ce{CaCl2}\) (aq). Gas discharge tubes for hydrogen, helium, and mercury. A handheld spectroscope.
Before lab, watch this video on how to use the spectroscope.
Safety
Exercise appropriate caution when using the Bunsen burner.
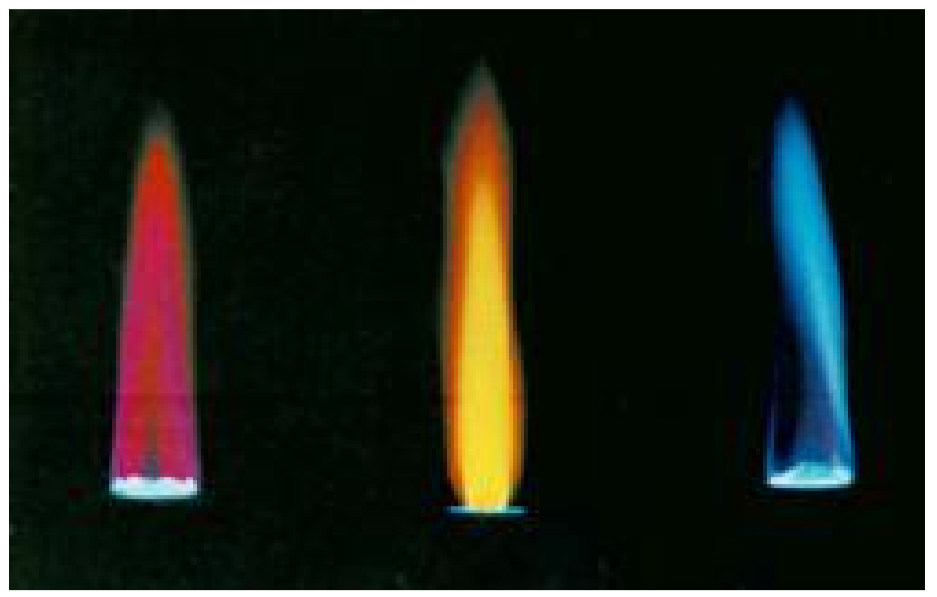
Part 1: Flame Tests of Metal Cations
Your instructor will dip a looped platinum wire into a solution containing a metal salt, and then hold it in the Bunsen burner flame. You will record your observations in your worksheet.
Part 2: Bohr Model of an Atom Simulation
- Using a computer or a mobile device, access the "Models of the Hydrogen Atom" simulation from phet.colorado.edu. Set the dial to “Prediction” and select Bohr's Atomic Model. Click the box to set the Light Control to “White”. Turn on the gun to shoot photons (“packets of light” or “energy bundles”) by clicking the red button. Each photon corresponds to that color dot with fuzzy purple dots representing UV. Check the box to show the spectrometer. Also check the box to show the electron energy level diagram. You can adjust the speed if its helpful.
- Recall that a neutral hydrogen only has one electron, which is represented by the blue dot rotating around the energy levels of the atom in this simulation. Observe what happens with the photons when the electron jumps to a higher energy level. Observe what happens when the electron relaxes back down to a lower energy level.
- Now increase the speed of the simulation in order to fill in the signal collected by the spectrometer and observe the results.
Part 3: Line Emission Spectra
- Gas-discharge tubes for hydrogen, helium and mercury are set up on the back lab bench. Go to any available station and use the hand-held spectroscope.
- Align the slit on the wider end so that you can see the light through the view window on the opposite end. It should appear as a clear, vertical line, and result in several colored lines appearing in the view. You should also be able to see the nm markings (make sure it is not upside-down) below the colored lines in the view.
- Record the spectral lines in your worksheet, indicating colors in their specific locations.