
12.8: Distribution of a Single Species between Immiscible Phases - Extraction and Separation
- Page ID
- 339034
\( \newcommand{\vecs}[1]{\overset { \scriptstyle \rightharpoonup} {\mathbf{#1}} } \)
\( \newcommand{\vecd}[1]{\overset{-\!-\!\rightharpoonup}{\vphantom{a}\smash {#1}}} \)
\( \newcommand{\id}{\mathrm{id}}\) \( \newcommand{\Span}{\mathrm{span}}\)
( \newcommand{\kernel}{\mathrm{null}\,}\) \( \newcommand{\range}{\mathrm{range}\,}\)
\( \newcommand{\RealPart}{\mathrm{Re}}\) \( \newcommand{\ImaginaryPart}{\mathrm{Im}}\)
\( \newcommand{\Argument}{\mathrm{Arg}}\) \( \newcommand{\norm}[1]{\| #1 \|}\)
\( \newcommand{\inner}[2]{\langle #1, #2 \rangle}\)
\( \newcommand{\Span}{\mathrm{span}}\)
\( \newcommand{\id}{\mathrm{id}}\)
\( \newcommand{\Span}{\mathrm{span}}\)
\( \newcommand{\kernel}{\mathrm{null}\,}\)
\( \newcommand{\range}{\mathrm{range}\,}\)
\( \newcommand{\RealPart}{\mathrm{Re}}\)
\( \newcommand{\ImaginaryPart}{\mathrm{Im}}\)
\( \newcommand{\Argument}{\mathrm{Arg}}\)
\( \newcommand{\norm}[1]{\| #1 \|}\)
\( \newcommand{\inner}[2]{\langle #1, #2 \rangle}\)
\( \newcommand{\Span}{\mathrm{span}}\) \( \newcommand{\AA}{\unicode[.8,0]{x212B}}\)
\( \newcommand{\vectorA}[1]{\vec{#1}} % arrow\)
\( \newcommand{\vectorAt}[1]{\vec{\text{#1}}} % arrow\)
\( \newcommand{\vectorB}[1]{\overset { \scriptstyle \rightharpoonup} {\mathbf{#1}} } \)
\( \newcommand{\vectorC}[1]{\textbf{#1}} \)
\( \newcommand{\vectorD}[1]{\overrightarrow{#1}} \)
\( \newcommand{\vectorDt}[1]{\overrightarrow{\text{#1}}} \)
\( \newcommand{\vectE}[1]{\overset{-\!-\!\rightharpoonup}{\vphantom{a}\smash{\mathbf {#1}}}} \)
\( \newcommand{\vecs}[1]{\overset { \scriptstyle \rightharpoonup} {\mathbf{#1}} } \)
\( \newcommand{\vecd}[1]{\overset{-\!-\!\rightharpoonup}{\vphantom{a}\smash {#1}}} \)
\(\newcommand{\avec}{\mathbf a}\) \(\newcommand{\bvec}{\mathbf b}\) \(\newcommand{\cvec}{\mathbf c}\) \(\newcommand{\dvec}{\mathbf d}\) \(\newcommand{\dtil}{\widetilde{\mathbf d}}\) \(\newcommand{\evec}{\mathbf e}\) \(\newcommand{\fvec}{\mathbf f}\) \(\newcommand{\nvec}{\mathbf n}\) \(\newcommand{\pvec}{\mathbf p}\) \(\newcommand{\qvec}{\mathbf q}\) \(\newcommand{\svec}{\mathbf s}\) \(\newcommand{\tvec}{\mathbf t}\) \(\newcommand{\uvec}{\mathbf u}\) \(\newcommand{\vvec}{\mathbf v}\) \(\newcommand{\wvec}{\mathbf w}\) \(\newcommand{\xvec}{\mathbf x}\) \(\newcommand{\yvec}{\mathbf y}\) \(\newcommand{\zvec}{\mathbf z}\) \(\newcommand{\rvec}{\mathbf r}\) \(\newcommand{\mvec}{\mathbf m}\) \(\newcommand{\zerovec}{\mathbf 0}\) \(\newcommand{\onevec}{\mathbf 1}\) \(\newcommand{\real}{\mathbb R}\) \(\newcommand{\twovec}[2]{\left[\begin{array}{r}#1 \\ #2 \end{array}\right]}\) \(\newcommand{\ctwovec}[2]{\left[\begin{array}{c}#1 \\ #2 \end{array}\right]}\) \(\newcommand{\threevec}[3]{\left[\begin{array}{r}#1 \\ #2 \\ #3 \end{array}\right]}\) \(\newcommand{\cthreevec}[3]{\left[\begin{array}{c}#1 \\ #2 \\ #3 \end{array}\right]}\) \(\newcommand{\fourvec}[4]{\left[\begin{array}{r}#1 \\ #2 \\ #3 \\ #4 \end{array}\right]}\) \(\newcommand{\cfourvec}[4]{\left[\begin{array}{c}#1 \\ #2 \\ #3 \\ #4 \end{array}\right]}\) \(\newcommand{\fivevec}[5]{\left[\begin{array}{r}#1 \\ #2 \\ #3 \\ #4 \\ #5 \\ \end{array}\right]}\) \(\newcommand{\cfivevec}[5]{\left[\begin{array}{c}#1 \\ #2 \\ #3 \\ #4 \\ #5 \\ \end{array}\right]}\) \(\newcommand{\mattwo}[4]{\left[\begin{array}{rr}#1 \amp #2 \\ #3 \amp #4 \\ \end{array}\right]}\) \(\newcommand{\laspan}[1]{\text{Span}\{#1\}}\) \(\newcommand{\bcal}{\cal B}\) \(\newcommand{\ccal}{\cal C}\) \(\newcommand{\scal}{\cal S}\) \(\newcommand{\wcal}{\cal W}\) \(\newcommand{\ecal}{\cal E}\) \(\newcommand{\coords}[2]{\left\{#1\right\}_{#2}}\) \(\newcommand{\gray}[1]{\color{gray}{#1}}\) \(\newcommand{\lgray}[1]{\color{lightgray}{#1}}\) \(\newcommand{\rank}{\operatorname{rank}}\) \(\newcommand{\row}{\text{Row}}\) \(\newcommand{\col}{\text{Col}}\) \(\renewcommand{\row}{\text{Row}}\) \(\newcommand{\nul}{\text{Nul}}\) \(\newcommand{\var}{\text{Var}}\) \(\newcommand{\corr}{\text{corr}}\) \(\newcommand{\len}[1]{\left|#1\right|}\) \(\newcommand{\bbar}{\overline{\bvec}}\) \(\newcommand{\bhat}{\widehat{\bvec}}\) \(\newcommand{\bperp}{\bvec^\perp}\) \(\newcommand{\xhat}{\widehat{\xvec}}\) \(\newcommand{\vhat}{\widehat{\vvec}}\) \(\newcommand{\uhat}{\widehat{\uvec}}\) \(\newcommand{\what}{\widehat{\wvec}}\) \(\newcommand{\Sighat}{\widehat{\Sigma}}\) \(\newcommand{\lt}{<}\) \(\newcommand{\gt}{>}\) \(\newcommand{\amp}{&}\) \(\definecolor{fillinmathshade}{gray}{0.9}\)A partitioning of a compound exist between a mixture of two immiscible phases at equilibrium, which is a measure of the difference in solubility of the compound in these two phases. If one of the solvents is a gas and the other a liquid, the "gas/liquid partition coefficient" is the same as the dimensionless form of the Henry's law constant. A solute can partition when one or both solvents is a solid (e.g., solid solution).
Liquid-Liquid Extractions
We call the process of moving a species from one phase to another phase an extraction. Simple extractions are particularly useful for separations where only one component has a favorable partition coefficient. Several important separation techniques are based on a simple extraction, including liquid–liquid, liquid–solid, solid–liquid, and gas–solid extractions. The most important group of separation techniques uses a selective partitioning of the solute between two immiscible phases. If we bring a phase containing a solute, S, into contact with a second phase, the solute partitions itself between the two phases, as shown by the following equilibrium reaction.
\[\textrm S_\textrm{phase 1}\rightleftharpoons \textrm S_\textrm{phase 2}\label{7.20}\]
The equilibrium constant for this equilbrium is
\[K_\textrm D=\mathrm{\dfrac{[S_{phase\;2}]}{[S_{phase\;1}]}}\]
is called the distribution constant or partition coefficient. If \(K_D\) is sufficiently large, then the solute moves from phase 1 to phase 2. The solute remains in phase 1 if the partition coefficient is sufficiently small. When we bring a phase containing two solutes into contact with a second phase, if KD is favorable for only one of the solutes a separation of the solutes is possible. The physical states of the phases are identified when describing the separation process, with the phase containing the sample listed first. For example, if the sample is in a liquid phase and the second phase is a solid, then the separation involves liquid–solid partitioning.
It often happens that two immiscible liquid phases are in contact, one of which contains a solute. How will the solute tend to distribute itself between the two phases? One’s first thought might be that some of the solute will migrate from one phase into the other until it is distributed equally between the two phases, since this would correspond to the maximum dispersion (randomness) of the solute. This, however, does not take into the account the differing solubilities the solute might have in the two liquids; if such a difference does exist, the solute will preferentially migrate into the phase in which it is more soluble (Figure \(\PageIndex{1}\) ).
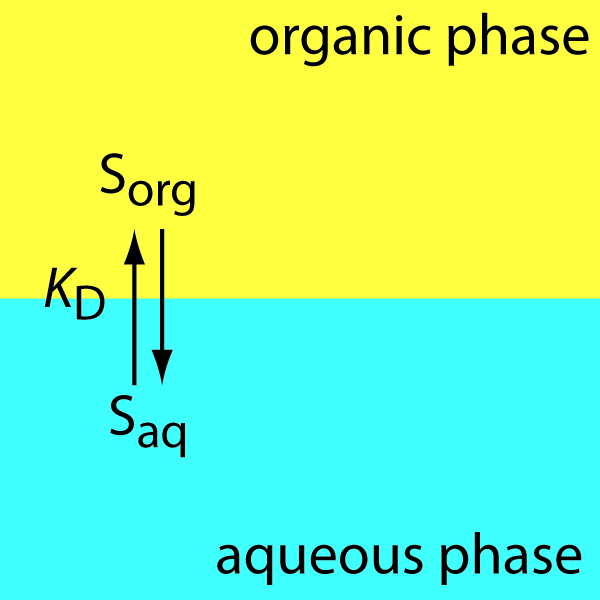
Figure \(\PageIndex{1}\): Scheme for a simple liquid–liquid extraction in which the solute’s partitioning depends only on the KD equilibrium.
The transport of substances between different phases is of immense importance in such diverse fields as pharmacology and environmental science. For example, if a drug is to pass from the aqueous phase with the stomach into the bloodstream, it must pass through the lipid (oil-like) phase of the epithelial cells that line the digestive tract. Similarly, a pollutant such as a pesticide residue that is more soluble in oil than in water will be preferentially taken up and retained by marine organism, especially fish, whose bodies contain more oil-like substances; this is basically the mechanism whereby such residues as DDT can undergo biomagnification as they become more concentrated at higher levels within the food chain. For this reason, environmental regulations now require that oil-water distribution ratios be established for any new chemical likely to find its way into natural waters. The standard “oil” phase that is almost universally used is octanol, C8H17OH.
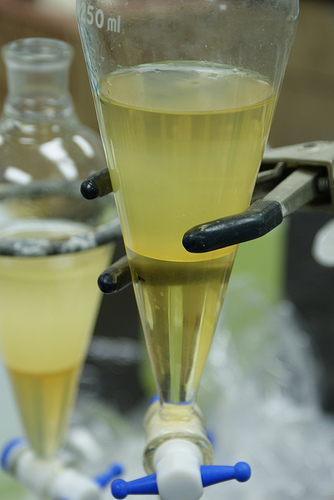
In preparative chemistry it is frequently necessary to recover a desired product present in a reaction mixture by extracting it into another liquid in which it is more soluble than the unwanted substances. On the laboratory scale this operation is carried out in a separatory funnel as shown below. The two immiscible liquids are poured into the funnel through the opening at the top. The funnel is then shaken to bring the two phases into intimate contact, and then set aside to allow the two liquids to separate into layers, which are then separated by allowing the more dense liquid to exit through the stopcock at the bottom.
If the distribution ratio is too low to achieve efficient separation in a single step, it can be repeated; there are automated devices that can carry out hundreds of successive extractions, each yielding a product of higher purity. In these applications our goal is to exploit the Le Chatelier principle by repeatedly upsetting the phase distribution equilibrium that would result if two phases were to remain in permanent contact.
The distribution ratio for iodine between water and carbon disulfide is 650. Calculate the concentration of I2 remaining in the aqueous phase after 50.0 mL of 0.10M I2 in water is shaken with 10.0 mL of CS2.
Solution
The equilibrium constant is
\[K_d = \dfrac{C_{CS_2}}{C_{H_2O}} = 650 \nonumber\]
Let m1 and m2 represent the numbers of millimoles of solute in the water and CS2 layers, respectively. Kd can then be written as (m2/10 mL) ÷ (m1/50 mL) = 650. The number of moles of solute is (50 mL) × (0.10 mmol mL–1) = 5.00 mmol, and mass conservation requires that m1 + m2 = 5.00 mmol, so m2 = (5.00 – m1) mmol and we now have only the single unknown m1. The equilibrium constant then becomes
\[ \dfrac{(5.00 – m_1)\, mmol / 10\, mL}{ m_1\, mmol / 50\, mL} = 650 \nonumber\]
Simplifying and solving for \(m_1\) yields
\[ \dfrac{(0.50 – 0.1)m_1}{0.02\, m_1} = 650 \nonumber\]
with m1 = 0.0382 mmol.
The concentration of solute in the water layer is (0.0382 mmol) / (50 mL) = 0.000763 M, showing that almost all of the iodine has moved into the CS2 layer.
Chromatographic Separations
In an extraction, the sample is one phase and we extract the analyte or the interferent into a second phase. We also can separate the analyte and interferents by continuously passing one sample-free phase, called the mobile phase, over a second sample-free phase that remains fixed or stationary. The sample is injected into the mobile phase and the sample’s components partition themselves between the mobile phase and the stationary phase. Those components with larger partition coefficients are more likely to move into the stationary phase, taking a longer time to pass through the system. This is the basis of all chromatographic separations. Chromatography provides both a separation of analytes and interferents, and a means for performing a qualitative or quantitative analysis for the analyte.
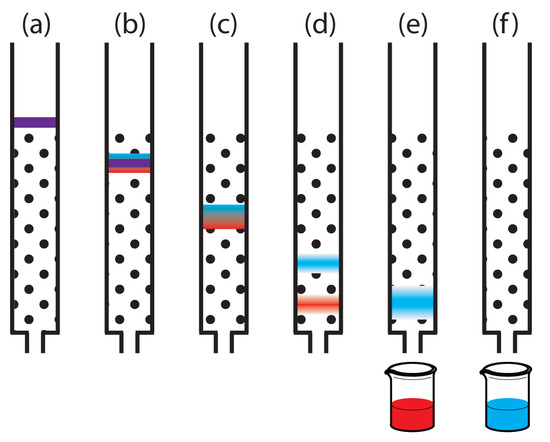
Of the two methods for bringing the stationary phase and the mobile phases into contact, the most important is column chromatography. In this section we develop a general theory that we may apply to any form of column chromatography. Figure \(\PageIndex{3}\) provides a simple view of a liquid–solid column chromatography experiment. The sample is introduced at the top of the column as a narrow band. Ideally, the solute’s initial concentration profile is rectangular (Figure \(\PageIndex{1a}\)). As the sample moves down the column the solutes begin to separate (Figures \(\PageIndex{1b,c}\)), and the individual solute bands begin to broaden and develop a Gaussian profile. If the strength of each solute’s interaction with the stationary phase is sufficiently different, then the solutes separate into individual bands (Figure \(\PageIndex{1d}\)).
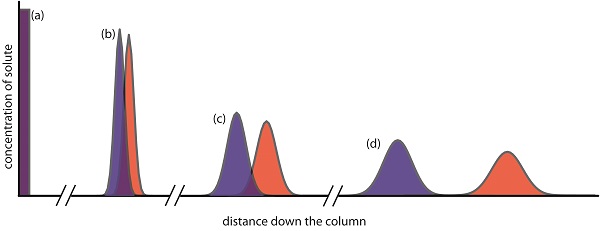
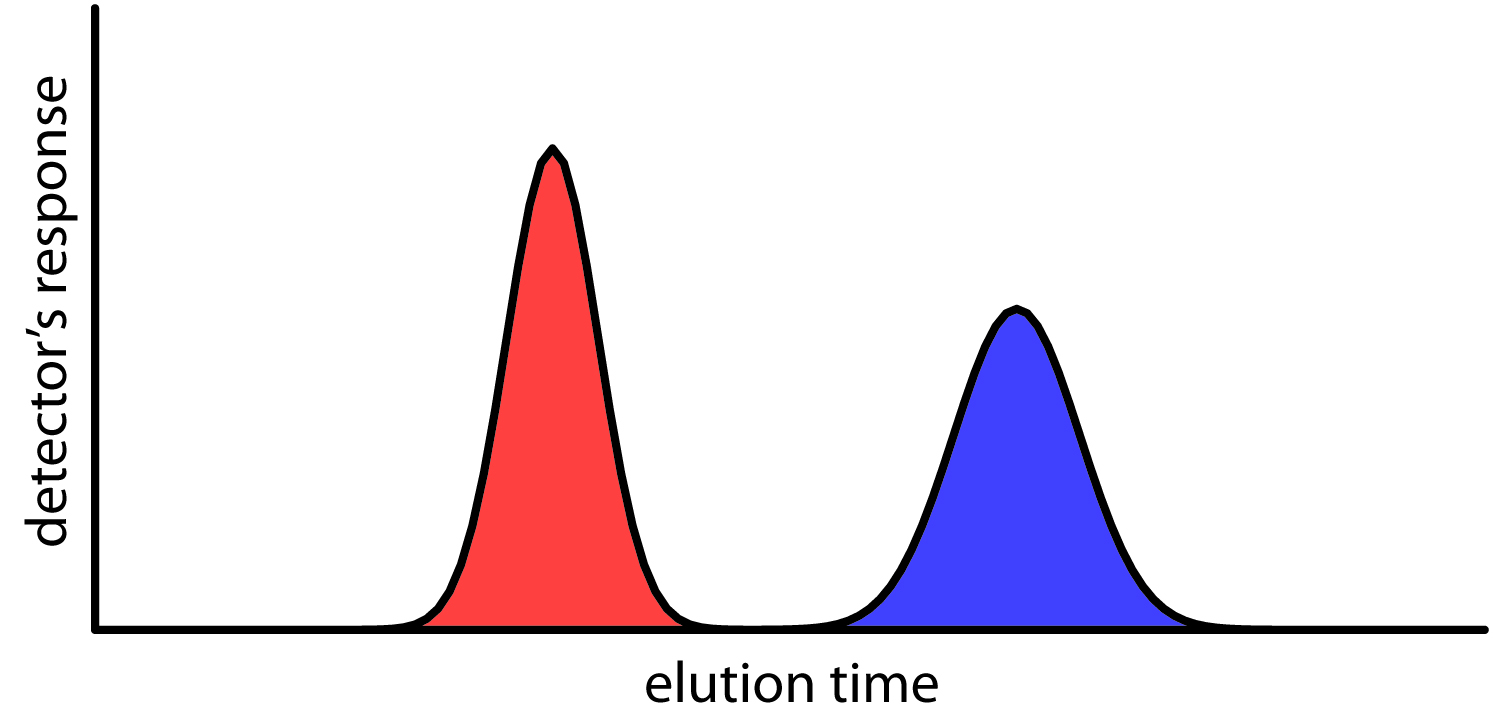
We can follow the progress of the separation either by collecting fractions as they elute from the column (Figure \(\PageIndex{4}\)), or by placing a suitable detector at the end of the column. A plot of the detector’s response as a function of elution time, or as a function of the volume of mobile phase, is known as a chromatogram (Figure \(\PageIndex{5}\)), and consists of a peak for each solute.
Contributors and Attributions
Stephen Lower, Professor Emeritus (Simon Fraser U.) Chem1 Virtual Textbook