
3: Behavior of Gasses (Experiment)
- Page ID
- 416882
\( \newcommand{\vecs}[1]{\overset { \scriptstyle \rightharpoonup} {\mathbf{#1}} } \)
\( \newcommand{\vecd}[1]{\overset{-\!-\!\rightharpoonup}{\vphantom{a}\smash {#1}}} \)
\( \newcommand{\dsum}{\displaystyle\sum\limits} \)
\( \newcommand{\dint}{\displaystyle\int\limits} \)
\( \newcommand{\dlim}{\displaystyle\lim\limits} \)
\( \newcommand{\id}{\mathrm{id}}\) \( \newcommand{\Span}{\mathrm{span}}\)
( \newcommand{\kernel}{\mathrm{null}\,}\) \( \newcommand{\range}{\mathrm{range}\,}\)
\( \newcommand{\RealPart}{\mathrm{Re}}\) \( \newcommand{\ImaginaryPart}{\mathrm{Im}}\)
\( \newcommand{\Argument}{\mathrm{Arg}}\) \( \newcommand{\norm}[1]{\| #1 \|}\)
\( \newcommand{\inner}[2]{\langle #1, #2 \rangle}\)
\( \newcommand{\Span}{\mathrm{span}}\)
\( \newcommand{\id}{\mathrm{id}}\)
\( \newcommand{\Span}{\mathrm{span}}\)
\( \newcommand{\kernel}{\mathrm{null}\,}\)
\( \newcommand{\range}{\mathrm{range}\,}\)
\( \newcommand{\RealPart}{\mathrm{Re}}\)
\( \newcommand{\ImaginaryPart}{\mathrm{Im}}\)
\( \newcommand{\Argument}{\mathrm{Arg}}\)
\( \newcommand{\norm}[1]{\| #1 \|}\)
\( \newcommand{\inner}[2]{\langle #1, #2 \rangle}\)
\( \newcommand{\Span}{\mathrm{span}}\) \( \newcommand{\AA}{\unicode[.8,0]{x212B}}\)
\( \newcommand{\vectorA}[1]{\vec{#1}} % arrow\)
\( \newcommand{\vectorAt}[1]{\vec{\text{#1}}} % arrow\)
\( \newcommand{\vectorB}[1]{\overset { \scriptstyle \rightharpoonup} {\mathbf{#1}} } \)
\( \newcommand{\vectorC}[1]{\textbf{#1}} \)
\( \newcommand{\vectorD}[1]{\overrightarrow{#1}} \)
\( \newcommand{\vectorDt}[1]{\overrightarrow{\text{#1}}} \)
\( \newcommand{\vectE}[1]{\overset{-\!-\!\rightharpoonup}{\vphantom{a}\smash{\mathbf {#1}}}} \)
\( \newcommand{\vecs}[1]{\overset { \scriptstyle \rightharpoonup} {\mathbf{#1}} } \)
\(\newcommand{\longvect}{\overrightarrow}\)
\( \newcommand{\vecd}[1]{\overset{-\!-\!\rightharpoonup}{\vphantom{a}\smash {#1}}} \)
\(\newcommand{\avec}{\mathbf a}\) \(\newcommand{\bvec}{\mathbf b}\) \(\newcommand{\cvec}{\mathbf c}\) \(\newcommand{\dvec}{\mathbf d}\) \(\newcommand{\dtil}{\widetilde{\mathbf d}}\) \(\newcommand{\evec}{\mathbf e}\) \(\newcommand{\fvec}{\mathbf f}\) \(\newcommand{\nvec}{\mathbf n}\) \(\newcommand{\pvec}{\mathbf p}\) \(\newcommand{\qvec}{\mathbf q}\) \(\newcommand{\svec}{\mathbf s}\) \(\newcommand{\tvec}{\mathbf t}\) \(\newcommand{\uvec}{\mathbf u}\) \(\newcommand{\vvec}{\mathbf v}\) \(\newcommand{\wvec}{\mathbf w}\) \(\newcommand{\xvec}{\mathbf x}\) \(\newcommand{\yvec}{\mathbf y}\) \(\newcommand{\zvec}{\mathbf z}\) \(\newcommand{\rvec}{\mathbf r}\) \(\newcommand{\mvec}{\mathbf m}\) \(\newcommand{\zerovec}{\mathbf 0}\) \(\newcommand{\onevec}{\mathbf 1}\) \(\newcommand{\real}{\mathbb R}\) \(\newcommand{\twovec}[2]{\left[\begin{array}{r}#1 \\ #2 \end{array}\right]}\) \(\newcommand{\ctwovec}[2]{\left[\begin{array}{c}#1 \\ #2 \end{array}\right]}\) \(\newcommand{\threevec}[3]{\left[\begin{array}{r}#1 \\ #2 \\ #3 \end{array}\right]}\) \(\newcommand{\cthreevec}[3]{\left[\begin{array}{c}#1 \\ #2 \\ #3 \end{array}\right]}\) \(\newcommand{\fourvec}[4]{\left[\begin{array}{r}#1 \\ #2 \\ #3 \\ #4 \end{array}\right]}\) \(\newcommand{\cfourvec}[4]{\left[\begin{array}{c}#1 \\ #2 \\ #3 \\ #4 \end{array}\right]}\) \(\newcommand{\fivevec}[5]{\left[\begin{array}{r}#1 \\ #2 \\ #3 \\ #4 \\ #5 \\ \end{array}\right]}\) \(\newcommand{\cfivevec}[5]{\left[\begin{array}{c}#1 \\ #2 \\ #3 \\ #4 \\ #5 \\ \end{array}\right]}\) \(\newcommand{\mattwo}[4]{\left[\begin{array}{rr}#1 \amp #2 \\ #3 \amp #4 \\ \end{array}\right]}\) \(\newcommand{\laspan}[1]{\text{Span}\{#1\}}\) \(\newcommand{\bcal}{\cal B}\) \(\newcommand{\ccal}{\cal C}\) \(\newcommand{\scal}{\cal S}\) \(\newcommand{\wcal}{\cal W}\) \(\newcommand{\ecal}{\cal E}\) \(\newcommand{\coords}[2]{\left\{#1\right\}_{#2}}\) \(\newcommand{\gray}[1]{\color{gray}{#1}}\) \(\newcommand{\lgray}[1]{\color{lightgray}{#1}}\) \(\newcommand{\rank}{\operatorname{rank}}\) \(\newcommand{\row}{\text{Row}}\) \(\newcommand{\col}{\text{Col}}\) \(\renewcommand{\row}{\text{Row}}\) \(\newcommand{\nul}{\text{Nul}}\) \(\newcommand{\var}{\text{Var}}\) \(\newcommand{\corr}{\text{corr}}\) \(\newcommand{\len}[1]{\left|#1\right|}\) \(\newcommand{\bbar}{\overline{\bvec}}\) \(\newcommand{\bhat}{\widehat{\bvec}}\) \(\newcommand{\bperp}{\bvec^\perp}\) \(\newcommand{\xhat}{\widehat{\xvec}}\) \(\newcommand{\vhat}{\widehat{\vvec}}\) \(\newcommand{\uhat}{\widehat{\uvec}}\) \(\newcommand{\what}{\widehat{\wvec}}\) \(\newcommand{\Sighat}{\widehat{\Sigma}}\) \(\newcommand{\lt}{<}\) \(\newcommand{\gt}{>}\) \(\newcommand{\amp}{&}\) \(\definecolor{fillinmathshade}{gray}{0.9}\)Hazard Overview
Chemical Hazards
- Acetone - flammable
- Dry ice - cryogenic
- Liquid nitrogen - cryogenic
Mechanical Hazards
- N/A
PPE
- 100% cotton lab coat
- Splash goggles
- Nitrile gloves
- Work gloves
Dispensary Provided Items
- Dewar
- Glass bulb
- Cardboard lid
- LabQuest with pressure sensor and temperature probe
- 60 mL syringe
- Plastic tubing
- Helium gas
- Liquid nitrogen
- Dry ice
- Ice
- Wooden mallet
- Disposable spatula
Introduction
The study of gases was central to the development of the atomic theory of matter. Understanding the behavior of gases is a fundamental part of modern chemistry. The ideal gas law (Equation \(\PageIndex{1}\)), relates four properties of a gas: pressure \( P \), volume \( V \), temperature \( T \), and the number of moles \( n \).
\[ PV = nRT \]
This law with the same value of the constant \( R \) (universal gas constant) holds approximately for all gases near atmospheric pressure and becomes increasingly accurate as the pressure decreases. In this experiment, you will investigate several corollaries of the ideal gas law. First, you will study how the pressure depends on the volume for a fixed amount of gas at a constant temperature. Equation \(\PageIndex{1}\) indicates that the \( {PV} \) should remain constant at constant \( n \) and \( T \), or that a graph of \( P \) versus \( {1/V} \) should be a straight line (Boyle’s law). Second, you will examine how \( P \) depends on \( T \) for a fixed amount at constant \( V \). In this case, Equation \(\PageIndex{1}\) predicts that a graph of \( P \) versus \( T \) should be a straight line (sometimes called Gay-Lussac’s law). Third, you will determine the temperature in degrees Celsius (°C) that corresponds to absolute zero (0K).
Measurement of Pressure
Mercury (\( \ce{Hg} \)) manometers are particularly important in the measurement of the pressure of gas since they can function as absolute pressure gauges, wherein the pressure is obtained directly from the measured physical characteristics of the instrument. In the case of a \( \ce{Hg} \) manometer, the characteristics are the height (or height difference) of the \( \ce{Hg} \) level(s) and the temperature of the \( \ce{Hg} \). The temperature is needed to correct for the thermal expansion of \( \ce{Hg} \) from 0°C, which is required to convert the observed reading in mm of \( \ce{Hg} \) to Torr (1 Torr = 1 mm of \( \ce{Hg} \) at 0°C and standard gravity). Near room temperature, this correction amounts to roughly 0.4%. When higher accuracy is required, smaller corrections may also be needed for the expansion of the measurement scale with temperature and local gravity. These will not be significant and thus are not required in your measurements. A variety of other types of pressure gauges are used, but these typically require calibration against an absolute pressure gauge. In this experiment, you will use an electronic pressure gauge that has been calibrated against a \( \ce{Hg} \) manometer.
The electronic pressure sensor or transducer that you will use in this experiment is based on piezo resistance, which describes the change in electrical resistance caused by an applied strain. This type of pressure sensor is widely used, for example, in the aviation (to determine altitude from barometric pressure) and automotive industries (as part of fuel injection systems), among others. A material that demonstrates piezo resistance is implanted or bonded to a thin elastic substrate, often a wafer of single-crystal silicon. The substrate flexes proportional to the differential gas pressure across its two faces, and this transfers a strain to the attached piezo resistor. One side of the substrate in this sensor is exposed to the local atmospheric pressure, while the other side is exposed to the pressure that you want to measure. The electrical resistance of the piezo resistor changes, and the device is designed to have a linear response over the pressure range of the sensor. An output voltage that is proportional to the differential pressure. The output voltage becomes positive or negative as the pressure increases or decreases, respectively, from the local atmospheric pressure. For example, an output voltage of approximately 150 mV occurs if the pressure differs from the local atmospheric pressure by 0.658 atm.
Operation of Lab Equipment
Boyle’s law
- Prepare the gas pressure sensor and an air sample for data collection by connecting them to the LabQuest Mini module. Open Logger Pro software.
- In the Experiment dropdown menu, select "Change Units" and change it to "mm Hg."
- In the Experiment dropdown menu, select "Data Collection." Change the mode to "events with entry."
- Enter the "Column Name" as "Volume" and the "Units" as "mL." Select OK.
- Press the green go arrow to begin data collection.
- To enter the volume data, click "Keep" and input the total volume in mL. Select OK to store this pressure/volume data pair.
- When you are finished collecting data, click Stop.
Experimental Procedure
Measurement of Atmospheric Pressure
Your TA will measure the atmospheric pressure with the barometer located in the room on the wall nearest the dispensary. A barometer is a closed-end \( \ce{Hg} \) manometer that is dedicated to the measurement of atmospheric pressure. It allows a more precise measurement than a simple manometer with a wooden meter stick since the scale is more precise and includes a Vernier so that the \( \ce{Hg} \) height can be measured to 0.1 mm. Your TA will provide instructions on using the barometer, but the basic steps are outlined below, and a good video tutorial can be found here.
- First, check the level of the liquid \( \ce{Hg} \) at the bottom of the barometer, and adjust the knob on the bottom so that the pyramid point is just barely touching the \( \ce{Hg} \).
- Next, use the knob on the side of the barometer to adjust the measurement tool to the height of the mercury.
- Read the height of the mercury. The markings on the side represent the height of the mercury to the nearest integer. The markers are in the middle of the vernier. Look for the line that lines up perfectly with the scale on the side of the barometer. The marker that lines up is the first digit of the decimal (the tenths digit). These 2 numbers give you your initial measurement.
- This measurement must be adjusted for the thermal expansion of the \( \ce{Hg} \). This can be done using the table that is taped to the barometer. Find the temperature and the pressure value in the tables. Subtract this number from your measured mmHg.
Record the \( \ce{Hg} \) height, temperature, and the correction.
Boyle’s Law
Goal: Determine the relationship between pressure and volume for a gas with constant number of moles and constant temperature.
The gas we use will be air, and it will be confined in a syringe connected to a Gas Pressure Sensor (see Figure \(\PageIndex{1}\)). When the volume of the syringe is changed by moving the piston, a change occurs in the pressure exerted by the confined gas. This pressure change will be monitored using a Gas Pressure Sensor and Logger Pro. Pressure and volume data pairs will be collected during this experiment and then analyzed. From the data and graph, you should be able to determine what kind of mathematical relationship exists between the pressure and volume of the confined gas. Historically, this relationship was first established by Robert Boyle in 1662 and has since been known as Boyle’s law.
The apparatus that you will use to study the dependence of the pressure of a gas on its volume is shown in Figure \(\PageIndex{2}\). Some notes before you begin:
- Minimize the contact of your hand with the body of the syringe while moving it. This experiment is sensitive to the change in temperature of the gas, and the heat from your hand is enough to change the gas temperature.
- The pressure sensor is also temperature sensitive, so avoid holding it as well.
- You will need to manually maintain the position of the syringe for most settings.
- Be sure to record the temperature of the air near the syringe in your lab notebook.
- To account for the gas that is in the system that’s not accounted for by the syringe, add 0.35 mL to your volume measurements.

The measurement for this part of the experiment is as follows:
- Set the plunger of the 60 mL syringe at about 30 mL, recording the exact volume to 0.5 mL, and then attach your pressure sensor.
- Record the volume of the syringe from the graduations, aligning the marks with the center of the seal on the plunger that is closest to the end of the syringe with the sensor.
- Record the pressure as reported on the Logger Pro software.
- DO NOT INCREASE THE VOLUME ABOVE 50 mL OR BELOW 20 mL. Doing so can damage the pressure sensor.
- Hold the syringe in one hand and the plunger in the other while adjusting the volume.
- Push the plunger in with 2.5 mL increments until you reach 20 mL. Record the pressure at each increment to the nearest 0.1 mL (30.0 mL, 27.5 mL, 35.0 mL, etc.).
- Next, pull the plunger out from 30 mL in 2.5 mL increments until you reach 50 mL. Record the pressure and volume at each increment. Altogether, you should have pressure measurements between 20-50 mL in 2.5 mL steps for a total of 13 pressure-volume pairs.
Gay-Lussac’s Law
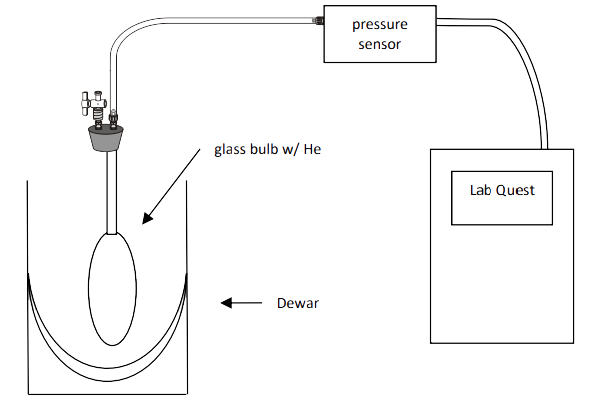
You will next examine how the pressure of a fixed amount of helium (\( \ce{He} \)) gas in a glass bulb at constant volume varies with temperature. The main reason that \( \ce{He} \) gas is used instead of air is to eliminate problems associated with water vapor. The partial pressure of water vapor in the air can be as high as 20 Torr (0.0263 atm) near room temperature, depending on the relative humidity. This water will condense at the lower temperatures that you will use. Significant deviation from the expected linearity of your Gay-Lussac’s Law graph would then occur from higher to lower temperatures since the amount of gas would not be constant. An added benefit of \( \ce{He} \) is that it behaves the most ideally among all gases.
The apparatus that you will use is shown in Figure \(\PageIndex{2}\). Have the TA flush and fill your glass bulb with helium gas. Keep the bulb stoppered with your index finger after filling and before attaching the pressure sensor, and minimize the time the bulb is open to the atmosphere while you attach the pressure sensor.
For this portion of the lab, you will perform 4 pressure and temperature measurements, which will then be used to find the relationship between temperature and pressure. For the room temperature and the ice bath only, you will use the thermometer connected to your LabQuest to record the temperature. DO NOT use the thermometer in dry ice or liquid nitrogen, as you will damage it. These temperature values are already known, and are given below.
| Temperature | Pressure | Bath |
|---|---|---|
| Room Air | ||
| Ice Bath | ||
| -78.48°C | Dry Ice + Acetone | |
| -195.8°C | Liquid Nitrogen |
Allow the apparatus to equilibrate in a room temperature bath, and then measure the temperature and the pressure reading from the sensor.
The remaining data points will be taken at reduced temperatures, corresponding to the ice point, a "dry ice" (solid \( \ce{CO2} \)) bath, and liquid nitrogen. These three temperatures are very well-defined and fixed since they result from a phase-equilibrium for a pure substance at constant pressure. The order in which these points are taken is not important. However, the glass bulb should be returned to near room temperature, and its surface dried of condensation before cooling to the next temperature.
Ice Bath
The ice point occurs at 0.00°C and is established when ice and air-saturated water are in equilibrium at atmospheric pressure, namely when both exist in a well-stirred and equilibrated system. Support the glass bulb in a beaker, and pack ice under, around, and over the large volume of the bulb. Add deionized water while replenishing the ice that melts so that the level of the packed ice remains above the water level. The final level of the water should completely cover the large volume of the bulb and roughly the bottom third of the attached capillary to achieve good thermal contact. Stir the bath by moving the bulb up and down slowly. After the output of the sensor has stabilized, record its reading. Note that this may not be at 0°C, which is ok as long as you record the actual temperature.
Dry Ice + Acetone Bath
Disconnect the temperature probe, as it will get damaged based on these parameters. Solid \( \ce{CO2} \) ("dry ice") in equilibrium with its vapor at 1 atm provides a temperature of -78.48°C. This equilibrium can be established while also obtaining good thermal contact by using a bath consisting of "dry ice" and a liquid that does not freeze at -78.5°C. The traditional choice of liquid is acetone, an organic solvent \( \ce{CH3COCH3} \).
Caution: Dry ice can cause painful low-temperature "burns" if held in the bare hand for even a few seconds. Use the spatula and gloves provided to handle the pulverized dry ice. Support the dry glass bulb in a dry Dewar flask, and fill the flask about one-half full with acetone. Slowly add tiny quantities of powdered dry ice. The dry ice will at first evaporate almost immediately, and there will be considerable foaming at the surface of the acetone. Add more dry ice only after the foaming has stopped and at a sufficiently slow rate so that the acetone does not foam out of the Dewar and onto the lab bench. Dry ice will begin to accumulate on the bottom of the Dewar only after the liquid has sufficiently cooled. At this time, the dry ice can be added at a greater rate without causing serious foaming. A temperature of -78.5°C is estimated when the bath is well stirred and a slow, steady stream of \( \ce{CO2} \) bubbles rises from solid \( \ce{CO2} \) at the bottom of the Dewar flask. Record the pressure. Dispose of dry ice and acetone solution in the proper container in the fume hood.
Liquid Nitrogen Bath
The equilibrium between a pure liquid and its vapor at the normal boiling point provides a third type of constant temperature bath. You will use liquid nitrogen, \( \ce{N2} \), which at 1.00 atm pressure boils at -195.80°C.
Caution: Liquid nitrogen can cause severe low-temperature burns. The liquid also evaporates rapidly when exposed to warm surfaces. Your TA will pour the liquid nitrogen for you. Support the dry glass bulb in a dry Dewar flask so that the top of the flask is roughly halfway up the capillary tube of the bulb. Slowly add small amounts of liquid nitrogen to the Dewar flask. The liquid will evaporate almost instantly. As the flask and the bulb cool, the evaporation rate subsidies and liquid nitrogen will accumulate in the Dewar. The Dewar flask should be filled, and the large volume of the glass bulb should be completely covered. Add the supplied cover to the top of the Dewar flask to minimize condensation from the air into the liquid nitrogen and slow evaporation. After the system has equilibrated, record the output of the pressure sensor.
Lab Report
Be sure to calculate the following for your lab report:
• Report the pressure and temperature of the room on the day of lab.
- Include a table with your Boyle’s law measurements, a plot of \( {P} \) versus \( {1/V} \), and a linear fit of the graph to a line. The slope of your line corresponds to \( {nRT} \), so you should also report the number of moles of gas in your syringe.
- Include a table with your Gay-Lussac’s law data, a plot of \( {P} \) versus \( {T} \), and a linear fit of the graph. Extrapolate the line to \( {P = 0} \) to calculate absolute zero.
- Calculate %error in your value of absolute 0 in temperature. To do this, you will need to convert the value to Celcius, and compare to the literature value of absolute zero (-273.15 K).
- Comment on your sources of error. What were some major causes of error in your experiment, and how can these sources be mitigated in the future?
Also, include the answers to the following questions in your lab report.
- The density of \( \ce{Hg} \) at 0°C is 13.5951 g/mL. Use the volume expansion coefficient of \( \ce{Hg} \), \( 3\alpha = 1.82 \times 10^{−4}{°C}^{−1} \), to estimate the density of \( \ce{Hg} \) at 20°C.
- To perform this experiment, what two experimental factors were kept constant?
- Based on the data and graph that you obtained for this experiment, express in words the relationship between pressure and temperature.
- Write Boyle’s law in terms of \( {P} \), \( {T} \), and a constant \( {k} \). One way to determine if a relationship is inversely or direct is to find the proportionality constant \( {k} \) from the data. If this relationship is direct, \( k = P/T \). If it is inverse, \( k = P \times T \). Calculate \( k \) for the ordered pairs in your data table (divide or multiply the \( {P} \) and \( {T} \) values). How constant were your values?
- According to this experiment, what should happen to the pressure of a gas if the Kelvin temperature is doubled? Check this assumption by finding the pressure at -73°C (200 K) and at 127°C (400 K) on your graph of the pressure versus temperature. How do these two pressure values compare?