
5.4: Chemical Shifts
- Page ID
- 369429
\( \newcommand{\vecs}[1]{\overset { \scriptstyle \rightharpoonup} {\mathbf{#1}} } \)
\( \newcommand{\vecd}[1]{\overset{-\!-\!\rightharpoonup}{\vphantom{a}\smash {#1}}} \)
\( \newcommand{\id}{\mathrm{id}}\) \( \newcommand{\Span}{\mathrm{span}}\)
( \newcommand{\kernel}{\mathrm{null}\,}\) \( \newcommand{\range}{\mathrm{range}\,}\)
\( \newcommand{\RealPart}{\mathrm{Re}}\) \( \newcommand{\ImaginaryPart}{\mathrm{Im}}\)
\( \newcommand{\Argument}{\mathrm{Arg}}\) \( \newcommand{\norm}[1]{\| #1 \|}\)
\( \newcommand{\inner}[2]{\langle #1, #2 \rangle}\)
\( \newcommand{\Span}{\mathrm{span}}\)
\( \newcommand{\id}{\mathrm{id}}\)
\( \newcommand{\Span}{\mathrm{span}}\)
\( \newcommand{\kernel}{\mathrm{null}\,}\)
\( \newcommand{\range}{\mathrm{range}\,}\)
\( \newcommand{\RealPart}{\mathrm{Re}}\)
\( \newcommand{\ImaginaryPart}{\mathrm{Im}}\)
\( \newcommand{\Argument}{\mathrm{Arg}}\)
\( \newcommand{\norm}[1]{\| #1 \|}\)
\( \newcommand{\inner}[2]{\langle #1, #2 \rangle}\)
\( \newcommand{\Span}{\mathrm{span}}\) \( \newcommand{\AA}{\unicode[.8,0]{x212B}}\)
\( \newcommand{\vectorA}[1]{\vec{#1}} % arrow\)
\( \newcommand{\vectorAt}[1]{\vec{\text{#1}}} % arrow\)
\( \newcommand{\vectorB}[1]{\overset { \scriptstyle \rightharpoonup} {\mathbf{#1}} } \)
\( \newcommand{\vectorC}[1]{\textbf{#1}} \)
\( \newcommand{\vectorD}[1]{\overrightarrow{#1}} \)
\( \newcommand{\vectorDt}[1]{\overrightarrow{\text{#1}}} \)
\( \newcommand{\vectE}[1]{\overset{-\!-\!\rightharpoonup}{\vphantom{a}\smash{\mathbf {#1}}}} \)
\( \newcommand{\vecs}[1]{\overset { \scriptstyle \rightharpoonup} {\mathbf{#1}} } \)
\( \newcommand{\vecd}[1]{\overset{-\!-\!\rightharpoonup}{\vphantom{a}\smash {#1}}} \)
\(\newcommand{\avec}{\mathbf a}\) \(\newcommand{\bvec}{\mathbf b}\) \(\newcommand{\cvec}{\mathbf c}\) \(\newcommand{\dvec}{\mathbf d}\) \(\newcommand{\dtil}{\widetilde{\mathbf d}}\) \(\newcommand{\evec}{\mathbf e}\) \(\newcommand{\fvec}{\mathbf f}\) \(\newcommand{\nvec}{\mathbf n}\) \(\newcommand{\pvec}{\mathbf p}\) \(\newcommand{\qvec}{\mathbf q}\) \(\newcommand{\svec}{\mathbf s}\) \(\newcommand{\tvec}{\mathbf t}\) \(\newcommand{\uvec}{\mathbf u}\) \(\newcommand{\vvec}{\mathbf v}\) \(\newcommand{\wvec}{\mathbf w}\) \(\newcommand{\xvec}{\mathbf x}\) \(\newcommand{\yvec}{\mathbf y}\) \(\newcommand{\zvec}{\mathbf z}\) \(\newcommand{\rvec}{\mathbf r}\) \(\newcommand{\mvec}{\mathbf m}\) \(\newcommand{\zerovec}{\mathbf 0}\) \(\newcommand{\onevec}{\mathbf 1}\) \(\newcommand{\real}{\mathbb R}\) \(\newcommand{\twovec}[2]{\left[\begin{array}{r}#1 \\ #2 \end{array}\right]}\) \(\newcommand{\ctwovec}[2]{\left[\begin{array}{c}#1 \\ #2 \end{array}\right]}\) \(\newcommand{\threevec}[3]{\left[\begin{array}{r}#1 \\ #2 \\ #3 \end{array}\right]}\) \(\newcommand{\cthreevec}[3]{\left[\begin{array}{c}#1 \\ #2 \\ #3 \end{array}\right]}\) \(\newcommand{\fourvec}[4]{\left[\begin{array}{r}#1 \\ #2 \\ #3 \\ #4 \end{array}\right]}\) \(\newcommand{\cfourvec}[4]{\left[\begin{array}{c}#1 \\ #2 \\ #3 \\ #4 \end{array}\right]}\) \(\newcommand{\fivevec}[5]{\left[\begin{array}{r}#1 \\ #2 \\ #3 \\ #4 \\ #5 \\ \end{array}\right]}\) \(\newcommand{\cfivevec}[5]{\left[\begin{array}{c}#1 \\ #2 \\ #3 \\ #4 \\ #5 \\ \end{array}\right]}\) \(\newcommand{\mattwo}[4]{\left[\begin{array}{rr}#1 \amp #2 \\ #3 \amp #4 \\ \end{array}\right]}\) \(\newcommand{\laspan}[1]{\text{Span}\{#1\}}\) \(\newcommand{\bcal}{\cal B}\) \(\newcommand{\ccal}{\cal C}\) \(\newcommand{\scal}{\cal S}\) \(\newcommand{\wcal}{\cal W}\) \(\newcommand{\ecal}{\cal E}\) \(\newcommand{\coords}[2]{\left\{#1\right\}_{#2}}\) \(\newcommand{\gray}[1]{\color{gray}{#1}}\) \(\newcommand{\lgray}[1]{\color{lightgray}{#1}}\) \(\newcommand{\rank}{\operatorname{rank}}\) \(\newcommand{\row}{\text{Row}}\) \(\newcommand{\col}{\text{Col}}\) \(\renewcommand{\row}{\text{Row}}\) \(\newcommand{\nul}{\text{Nul}}\) \(\newcommand{\var}{\text{Var}}\) \(\newcommand{\corr}{\text{corr}}\) \(\newcommand{\len}[1]{\left|#1\right|}\) \(\newcommand{\bbar}{\overline{\bvec}}\) \(\newcommand{\bhat}{\widehat{\bvec}}\) \(\newcommand{\bperp}{\bvec^\perp}\) \(\newcommand{\xhat}{\widehat{\xvec}}\) \(\newcommand{\vhat}{\widehat{\vvec}}\) \(\newcommand{\uhat}{\widehat{\uvec}}\) \(\newcommand{\what}{\widehat{\wvec}}\) \(\newcommand{\Sighat}{\widehat{\Sigma}}\) \(\newcommand{\lt}{<}\) \(\newcommand{\gt}{>}\) \(\newcommand{\amp}{&}\) \(\definecolor{fillinmathshade}{gray}{0.9}\)Different nuclei of the same type in different environments have different frequencies in the same magnetic field
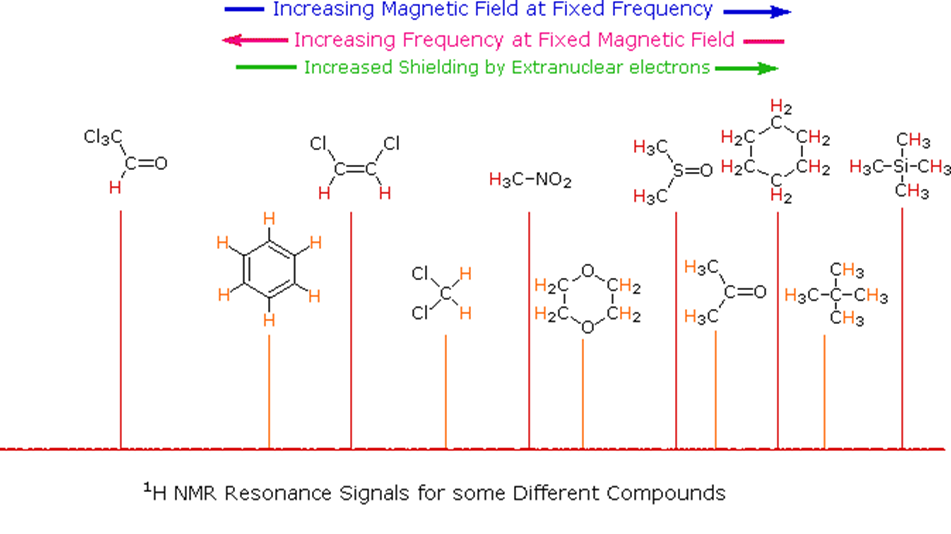
Since protons all have the same magnetic moment, we might expect all hydrogen atoms to give resonance signals at the same field / frequency values. Fortunately for chemistry applications, this is not true. By clicking the Show Different Protons button under the diagram, a number of representative proton signals will be displayed over the same magnetic field range. It is not possible, of course, to examine isolated protons in the spectrometer described above; but from independent measurement and calculation it has been determined that a naked proton would resonate at a lower field strength than the nuclei of covalently bonded hydrogens. With the exception of water, chloroform and sulfuric acid, which are examined as liquids, all the other compounds are measured as gases.
Remember when we were discussion polarizability with Raman scattering and the Zeff in X-ray spectroscopy. These were products of the material that reduce the effective electric fields. The same thing occurs with externally applied magnetic fields. The net effect can be described using a quality called the shielding constant or screening constant σ, sothe nuclear shielding resonance condition can be expressed as:
Differences in the electronic environments cause the protons to experience slightly different applied magnetic fields owing to the shielding/deshielding effects of the induced electronic magnetic fields.
The Chemical Shift
Let's make things simple for people. Unlike infrared and uv-visible spectroscopy, where absorption peaks are uniquely located by a frequency or wavelength, the location of different NMR resonance signals is dependent on both the external magnetic field strength and the RF frequency. Since no two magnets will have exactly the same field, resonance frequencies will vary accordingly and an alternative method for characterizing and specifying the location of NMR signals is needed. This problem is illustrated by the eleven different compounds shown in the following diagram. Although the eleven resonance signals are distinct and well separated, an unambiguous numerical locator cannot be directly assigned to each.
The chemical shift in absolute terms is defined by the frequency of the resonance expressed with reference to a standard compound which is defined to be at 0 ppm. The standard reference that was chosen is tetramethylsilane (TMS). This compound has four -CH3 methyl groups single bonded to a silicon atom. All of the protons on the methyl groups are in the same electronic environment. Therefore only one NMR signal will be generated. The scale is made more manageable by expressing it in parts per million (ppm) and is independent of the spectrometer frequency. The chemical shifts of other resonances are expressed as the difference in electron shielding to the reference nucleus:
\[\delta=\frac{\text { difference between a resonance frequency and that of a reference substance }}{\text { frequency of the spectroscopy }} \nonumber \]
Thus, an NMR signal at 300 Hz from TMS at an applied frequency of 300 MHz has a chemical shift of:
\[\frac{300 \mathrm{~Hz}}{300 \times 10^{6} \mathrm{~Hz}}=1 \times 10^{-6}=1 \mathrm{ppm} \nonumber \]
Although the frequency depends on the applied field the chemical shift is independent of it. On the other hand the resolution of NMR will increase with applied magnetic field resulting in ever increasing chemical shift changes.
The general distribution of proton chemical shifts associated with different functional groups is summarized in the following chart. Bear in mind that these ranges are approximate, and may not encompass all compounds of a given class. Note also that the ranges specified for OH and NH protons (colored orange) are wider than those for most CH protons. This is due to hydrogen bonding variations at different sample concentrations.
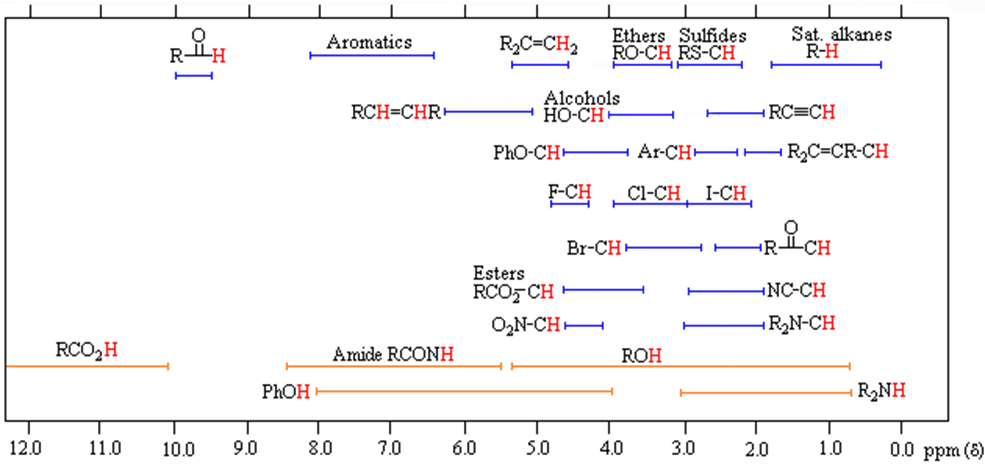
* For samples in CDCl3 solution. The δ scale is relative to TMS at δ = 0.
Chemical Shifts of other Nuclei
| Carbon-13* Environment | Chemical Shift Range (ppm) | Fluorine-19 Environment | Chemical Shift Range (ppm) |
|---|---|---|---|
| (CH3)2C*O | -12 | UF6 | -540 |
| CS2 | 0 | FNO | -269 |
| CH3C*OOH | 16 | F2 | -210 |
| C6H6 | 65 | bare nucleus | 0 |
| CHCl CHCl (cis) | 71 | C(CF3)4 | 284 |
| CH3C*N | 73 | CF3(COOH) | 297 |
| CCl4 | 97 | fluorobenzene | 333 |
| dioxane | 126 | F- | 338 |
| C*H3CN | 196 | BF3 | 345 |
| CHI3 | 332 | HF | 415 |
|
Nitrogen-14* |
Chemical Shift |
|---|---|
| NO2Na | -355 |
| NO3- (aqueous) | -115 |
| N2 (liquid) | -101 |
| pyridine | -93 |
| bare nucleus | 0 |
| CH3CN | 25 |
| CH3CONH2 (aqueous) | 152 |
| NH4+ (aqueous) | 245 |
| NH3 (liquid) | 266 |
| Phosphorous-31 Environment | Chemical Shift Range (ppm) |
|---|---|
| PBr3 | -228 |
| (C2H5O)3 P | -137 |
| PF3 | -97 |
| 85% phosphoric acid | 0 |
| PCl5 | 80 |
| PH3 | 238 |
| P4 | 450 |
These shifts are all relative to the bare nucleus.
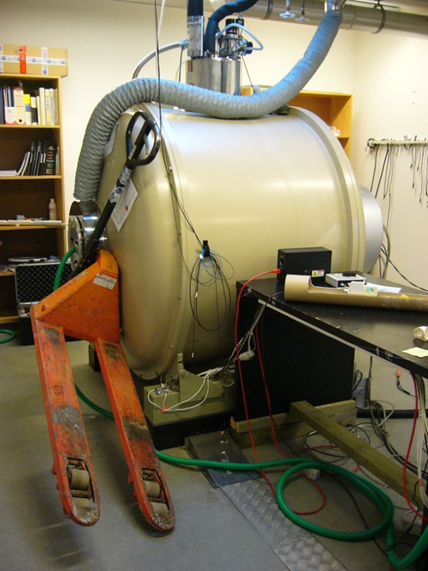
The strong magnets required for NMR/MRI can be dangerous in the wrong hands. This happened several years ago in Denmark.
Now, back to the basics....