
4.10: X-ray absorption fine structure (XAFS)
- Page ID
- 367705
\( \newcommand{\vecs}[1]{\overset { \scriptstyle \rightharpoonup} {\mathbf{#1}} } \)
\( \newcommand{\vecd}[1]{\overset{-\!-\!\rightharpoonup}{\vphantom{a}\smash {#1}}} \)
\( \newcommand{\id}{\mathrm{id}}\) \( \newcommand{\Span}{\mathrm{span}}\)
( \newcommand{\kernel}{\mathrm{null}\,}\) \( \newcommand{\range}{\mathrm{range}\,}\)
\( \newcommand{\RealPart}{\mathrm{Re}}\) \( \newcommand{\ImaginaryPart}{\mathrm{Im}}\)
\( \newcommand{\Argument}{\mathrm{Arg}}\) \( \newcommand{\norm}[1]{\| #1 \|}\)
\( \newcommand{\inner}[2]{\langle #1, #2 \rangle}\)
\( \newcommand{\Span}{\mathrm{span}}\)
\( \newcommand{\id}{\mathrm{id}}\)
\( \newcommand{\Span}{\mathrm{span}}\)
\( \newcommand{\kernel}{\mathrm{null}\,}\)
\( \newcommand{\range}{\mathrm{range}\,}\)
\( \newcommand{\RealPart}{\mathrm{Re}}\)
\( \newcommand{\ImaginaryPart}{\mathrm{Im}}\)
\( \newcommand{\Argument}{\mathrm{Arg}}\)
\( \newcommand{\norm}[1]{\| #1 \|}\)
\( \newcommand{\inner}[2]{\langle #1, #2 \rangle}\)
\( \newcommand{\Span}{\mathrm{span}}\) \( \newcommand{\AA}{\unicode[.8,0]{x212B}}\)
\( \newcommand{\vectorA}[1]{\vec{#1}} % arrow\)
\( \newcommand{\vectorAt}[1]{\vec{\text{#1}}} % arrow\)
\( \newcommand{\vectorB}[1]{\overset { \scriptstyle \rightharpoonup} {\mathbf{#1}} } \)
\( \newcommand{\vectorC}[1]{\textbf{#1}} \)
\( \newcommand{\vectorD}[1]{\overrightarrow{#1}} \)
\( \newcommand{\vectorDt}[1]{\overrightarrow{\text{#1}}} \)
\( \newcommand{\vectE}[1]{\overset{-\!-\!\rightharpoonup}{\vphantom{a}\smash{\mathbf {#1}}}} \)
\( \newcommand{\vecs}[1]{\overset { \scriptstyle \rightharpoonup} {\mathbf{#1}} } \)
\( \newcommand{\vecd}[1]{\overset{-\!-\!\rightharpoonup}{\vphantom{a}\smash {#1}}} \)
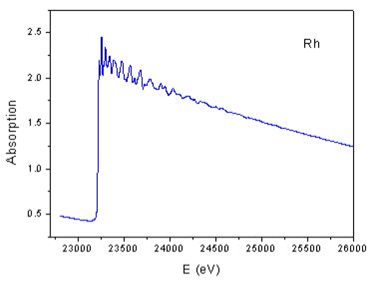
\(\newcommand{\avec}{\mathbf a}\) \(\newcommand{\bvec}{\mathbf b}\) \(\newcommand{\cvec}{\mathbf c}\) \(\newcommand{\dvec}{\mathbf d}\) \(\newcommand{\dtil}{\widetilde{\mathbf d}}\) \(\newcommand{\evec}{\mathbf e}\) \(\newcommand{\fvec}{\mathbf f}\) \(\newcommand{\nvec}{\mathbf n}\) \(\newcommand{\pvec}{\mathbf p}\) \(\newcommand{\qvec}{\mathbf q}\) \(\newcommand{\svec}{\mathbf s}\) \(\newcommand{\tvec}{\mathbf t}\) \(\newcommand{\uvec}{\mathbf u}\) \(\newcommand{\vvec}{\mathbf v}\) \(\newcommand{\wvec}{\mathbf w}\) \(\newcommand{\xvec}{\mathbf x}\) \(\newcommand{\yvec}{\mathbf y}\) \(\newcommand{\zvec}{\mathbf z}\) \(\newcommand{\rvec}{\mathbf r}\) \(\newcommand{\mvec}{\mathbf m}\) \(\newcommand{\zerovec}{\mathbf 0}\) \(\newcommand{\onevec}{\mathbf 1}\) \(\newcommand{\real}{\mathbb R}\) \(\newcommand{\twovec}[2]{\left[\begin{array}{r}#1 \\ #2 \end{array}\right]}\) \(\newcommand{\ctwovec}[2]{\left[\begin{array}{c}#1 \\ #2 \end{array}\right]}\) \(\newcommand{\threevec}[3]{\left[\begin{array}{r}#1 \\ #2 \\ #3 \end{array}\right]}\) \(\newcommand{\cthreevec}[3]{\left[\begin{array}{c}#1 \\ #2 \\ #3 \end{array}\right]}\) \(\newcommand{\fourvec}[4]{\left[\begin{array}{r}#1 \\ #2 \\ #3 \\ #4 \end{array}\right]}\) \(\newcommand{\cfourvec}[4]{\left[\begin{array}{c}#1 \\ #2 \\ #3 \\ #4 \end{array}\right]}\) \(\newcommand{\fivevec}[5]{\left[\begin{array}{r}#1 \\ #2 \\ #3 \\ #4 \\ #5 \\ \end{array}\right]}\) \(\newcommand{\cfivevec}[5]{\left[\begin{array}{c}#1 \\ #2 \\ #3 \\ #4 \\ #5 \\ \end{array}\right]}\) \(\newcommand{\mattwo}[4]{\left[\begin{array}{rr}#1 \amp #2 \\ #3 \amp #4 \\ \end{array}\right]}\) \(\newcommand{\laspan}[1]{\text{Span}\{#1\}}\) \(\newcommand{\bcal}{\cal B}\) \(\newcommand{\ccal}{\cal C}\) \(\newcommand{\scal}{\cal S}\) \(\newcommand{\wcal}{\cal W}\) \(\newcommand{\ecal}{\cal E}\) \(\newcommand{\coords}[2]{\left\{#1\right\}_{#2}}\) \(\newcommand{\gray}[1]{\color{gray}{#1}}\) \(\newcommand{\lgray}[1]{\color{lightgray}{#1}}\) \(\newcommand{\rank}{\operatorname{rank}}\) \(\newcommand{\row}{\text{Row}}\) \(\newcommand{\col}{\text{Col}}\) \(\renewcommand{\row}{\text{Row}}\) \(\newcommand{\nul}{\text{Nul}}\) \(\newcommand{\var}{\text{Var}}\) \(\newcommand{\corr}{\text{corr}}\) \(\newcommand{\len}[1]{\left|#1\right|}\) \(\newcommand{\bbar}{\overline{\bvec}}\) \(\newcommand{\bhat}{\widehat{\bvec}}\) \(\newcommand{\bperp}{\bvec^\perp}\) \(\newcommand{\xhat}{\widehat{\xvec}}\) \(\newcommand{\vhat}{\widehat{\vvec}}\) \(\newcommand{\uhat}{\widehat{\uvec}}\) \(\newcommand{\what}{\widehat{\wvec}}\) \(\newcommand{\Sighat}{\widehat{\Sigma}}\) \(\newcommand{\lt}{<}\) \(\newcommand{\gt}{>}\) \(\newcommand{\amp}{&}\) \(\definecolor{fillinmathshade}{gray}{0.9}\)X-ray absorption fine structure (XAFS) spectroscopy is one of the most powerful tools we have for mapping local structure. In this technique, we probe a sample with x-rays that are tuned to the energy of a core electron shell in the element we wish to study. We monitor how many x-rays are absorbed as a function of their energy. If taken with sufficient accuracy, the spectrum exhibits small oscillations that are the result of the local environment's influence on the target element's basic absorption probability. From the spectrum, we can extract the distances between the absorber and its near-neighbor atoms, the number and type of those atoms, and the oxidation state of the absorbing element-all parameters that determine local structure. By selecting a different x-ray energy, we can obtain this information for any element in the sample.
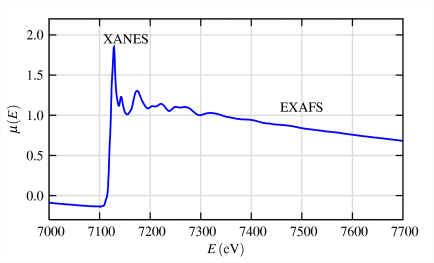
EXAFS arises from photoelectron scattering, making it a spectroscopically detected scattering method. EXAFS spectra contain structural information comparable to that obtained from single-crystal x-ray diffraction. The principal advantage of EXAFS in comparison with crystallography is that EXAFS is a local structure probe and does not require the presence of long-range order. This means that EXAFS can be used to determine the local structure in noncrystalline samples.
Origin of the EXAFS Oscillations
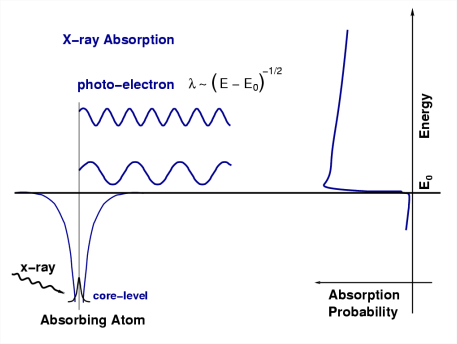
We’ll now develop the XAFS equation using a slightly more formal description of this simple physical picture. Since x-ray absorption is a transition between two quantum states (from an initial state with an x-ray, a core electron, and no photo-electron to a final state with no x-ray, a core hole, and a photo-electron), we describe µ(E) with Fermi’s Golden Rule:
\[\mu(E) \propto|\langle i|\mathcal{H}| f\rangle|^{2} \nonumber \]
where \(\langle i|\) represents the initial state (an x-ray, a core electron, and no photo-electron), \(|f\rangle\) is the final state (no x-ray, a core-hole, and a photo-electron), and H is the interaction term (which we’ll come back to shortly). Since the core-level electron is very tightly bound to the absorbing atom, the initial state will not be altered by the presence of the neighboring atom. The final state, on the other hand, will be affected by the neighboring atom because the photo-electron will be able to see it.
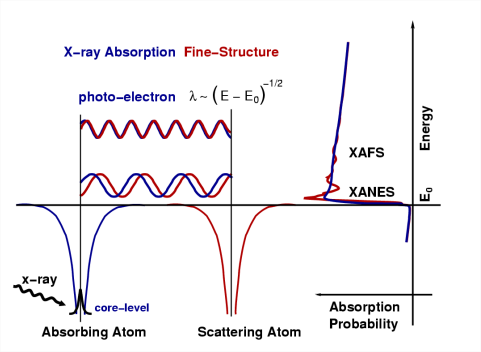
The EXAFS phenomenon results from the sensitivity of the X-ray absorption coefficient to photoelectron-electron scattering with electron density surrounding neighboring atoms. Considering an absorbing atom a and a scattering atom s, photon-induced dissociation of a 1s electron creates a photoelectron that can be considered a de Broglie wave with its origin at atom. The excess energy from the photon is conserved as kinetic energy of the photoelectron, determining the wavelength.
The wavefront of the ejected electron “propagates” out from atom the and backscatter from an nearby atom (Figure \(\PageIndex{3}\)). The quantum mechanical formulation of the X-ray transition moment suggests that the X-ray absorption coefficient is dependent on the magnitude of the backscattered photoelectron at atom a.
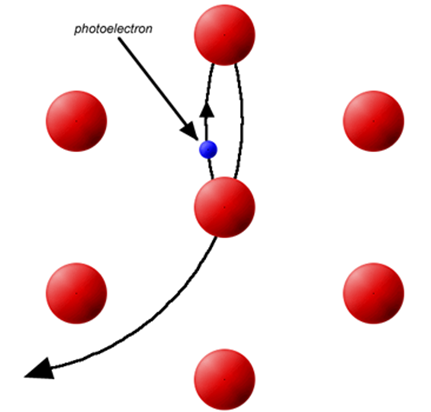
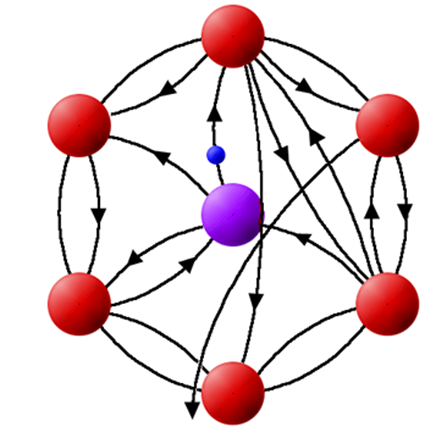
At a given photon energy (E1), this backscattering amplitude will be a maximum due to constructive interference of outgoing and backscattered photoelectron waves. This yields a local maximum in the absorption coefficient. A higher photon energy results in a shorter photoelectron wavelength, eventually causing a minimum in the backscattered wave (destructive interference of outgoing and backscattered waves) at atom a and a local minimum in the absorption coefficient. This behavior repeats, resulting in a periodic modulation of the absorption coefficient, which contain information about the relationship of atom a and atom s, i.e., the atomic neighborhood of atom a.
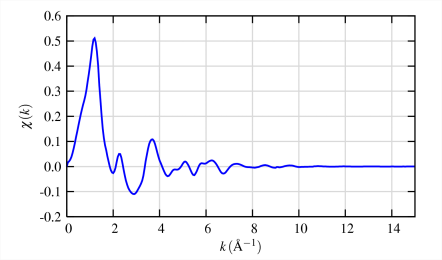
The different frequencies apparent in the oscillations in χ(k) correspond to different near-neighbor coordination shells which can be described and modeled according to the EXAFS Equation
\[\chi(k)=\sum_{j} \frac{N_{j} f_{j}(k) e^{-2 k^{2} \sigma_{j}^{2}}}{k R_{j}{ }^{2}} \sin \left[2 k R_{j}+\delta_{j}(k)\right] \label{1} \]
where \(f(k)\) and \(δ(k)\) are scattering properties of the atoms neighboring the excited atom, \(N\) is the number of neighboring atoms, \(R\) is the distance to the neighboring atom, and \(σ^2\) is the disorder in the neighbor distance. Though somewhat complicated, Equation \ref{1} allows us to determine \(N\), \(R\), and \(σ^2\) knowing the scattering amplitude \(f(k)\) and phase-shift \(δ(k)\). Furthermore, since these scattering factors depend on the \(Z_{eff}\) of the neighboring atom, EXAFS is also sensitive to the atomic species of the neighboring atom.
Data Reduction in EXAFS
The interference pattern of the photoelectron wavelets modifies the probability of the photoeffect. When the absorption spectrum is scanned by changing the photon energy, the energy of the photoelectron changes. Consequently, its wavelength varies, and the interference of the wavelets changes from constructive to destructive and back again. Each atom scattering contributes a harmonic oscillatory mode, together they form a complex quasiperiodic EXAFS signal: Fourier analysis of the signal resolves the harmonic components into a probability vs distance diagram.
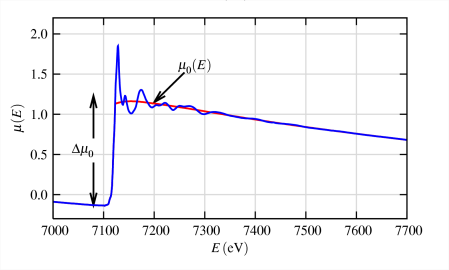
Extraction of the EXAFS (the quasi-periodic modulations of the X-ray absorption coefficient above the edge) consists of several steps, pictorially represented above.
- The raw XAS data are illustrated in maroon at the top of the left frame. The first step is to simulate (by fitting) and subtract the pre-edge absorbance (blue line) to isolate the contribution from only the element of interest.
- The pre-edge subtracted data are illustrated in maroon in the center of the left frame and the modulations above the edge are isolated by fitting a smooth curve (usually a three-region cubic or quartic spline), represented by the blue line.
- The resulting data (after spline subtraction and normalization) are defined as the EXAFS and are shown as a function of energy in the bottom of the left frame.
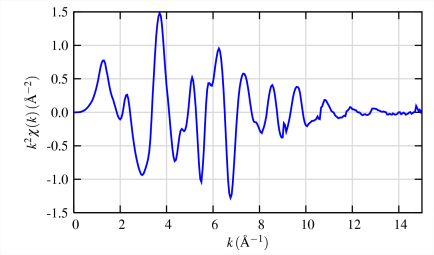
- Conversion to k (wave vector)-space results in the EXAFS as it is more typically used (top of right top frame). To avoid underestimating the value of the EXAFS oscillations at high k, it is common to multiply the raw EXAFS by a weighting function (k3 is almost universal) to emphasize the high-k oscillations (bottom of upper right frame).
- Finally, a Fourier transform of the k3-weighted EXAFS yields what appears to be a radial distribution function of electron density around the absorbing atom.
How many of what type of ligands are at what distance from metal? To simplify, each scattering atom generates a quasi-sinusoidal modulation of the X-ray absorption coefficient in the EXAFS. These sine waves are completely defined by three observables, Frequency, Phase Shift, and Amplitude.
#1 Frequency ⇒ Distance
From these three observables, analysis of the EXAFS can extract molecular level information. Frequency yields direct information about the Distance between atoms a and s.
#2 Phase Shift ⇒ Type of Atom (affects amplitude also)
The Phase Shift is determined by the type of atom s (it also depends on atom a, but this is constant for a given sample).
#3 Amplitude ⇒ # of Atoms
The Amplitude is directly proportional to the number of atoms (in a given shell). Also, since the scattering Amplitude depends on the electron density around atom s, the Amplitude also contains information about the type of atom
- What types of atoms are in the first coordination sphere of a metal site?
- What is the molecular symmetry of this metal site?
- How covalent are the metal ligand bonds?
- Does a particular treatment generate…
- a redox change at this metal site?
- result in a structural change at this metal site?
- Is this metal part of a metal cluster?
EXAFS tell Researchers how many of what type of ligands are at what distance from the metal?
EXAFS Accuracy
- Distances: ± 0.02 Å
- Coordination Numbers: ± 20-25 %
- Scattering Atoms: \( ΔZ ± 1\) (for Z=6-17) & \(ΔZ ± 3\) ( for Z=20-35)
Examining the accuracy of the three pieces of information available from analysis of the EXAFS data (distance, coordination number, type of scattering atom) gives a good indication of the limitations of the EXAFS-derived structural information.
- Since the frequency of the sinusoidal oscillations is relatively easy to measure accurately, the absorber-scatterer distances are measured quite accurately. This accuracy rivals that obtainable from small molecule crystallography, and is much better than what is available from macromolecular (protein) crystallography. This provides the useful complementarity with crystallography; the use of accurate metal-ligand distances from EXAFS can aid the refinement of metal sites in X-ray diffraction studies.
- Coordination number determinations are much less accurate. Since there is no good independent determination of the latter, we cannot accurately determine the former.
- Scattering atom identification is equally imprecise. Elements that are next to each other in the periodic table have barely distinguishable photoelectron scattering characteristics (much like they have similar X-ray scattering characteristics which makes elements hard to identify exactly in X-ray diffraction). This distinction becomes even harder at higher atomic no. (Z). Thus, C, N, and O, are impossible to distinguish, as are P, Cl, and S. Metal scatterers can only be placed in the proper row of the periodic table.
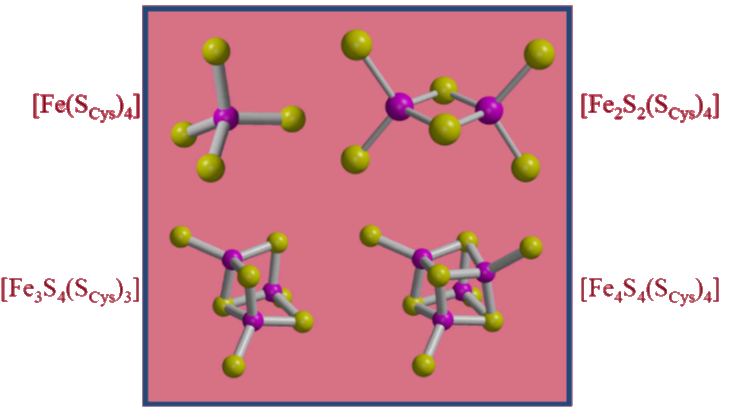
Case Study: Fe-S complexes
Historically, the characterization of metal clusters in biology has benefited from the use of EXAFS (in addition to many other techniques). A good example is the characterization of Fe-S clusters by the observation of Fe…Fe scattering in the Fe EXAFS. Displayed above are the “canonical” Fe-S sites observed in biology.
The Fourier transform of the Fe EXAFS of a simple Fe2S2 cluster in a [2Fe] ferredoxin provides a characteristic signature of the existence of a cluster. The raw EXAFS data display a beat pattern which implies a resolution of at least two FT peaks. In the FT, the peaks are color coded with the individual EXAFS component sine waves and the bonds (or non-bonded interactions) in the molecular model. The main (green) peak is associated with the Fe–S bonds, whereas the smaller, higher-R (blue) peak is associated with the Fe…Fe interaction.
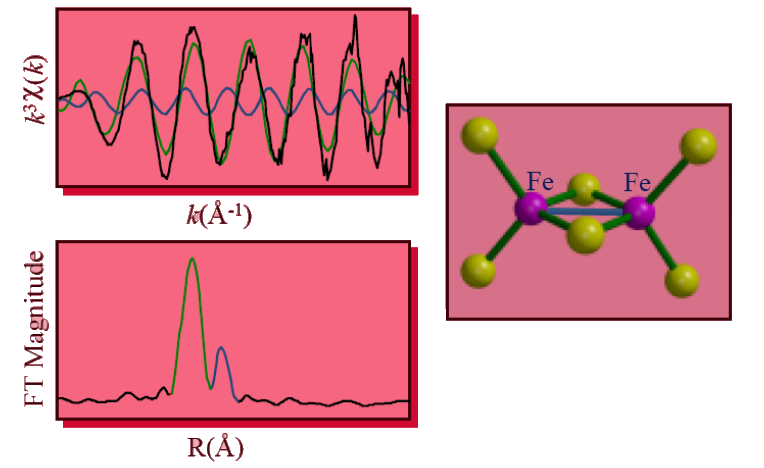
As the cluster size increases, each Fe should see 1 (2Fe cluster), 2 (3Fe cluster), or 3 (4Fe cluster) Fe scatterers, increasing the size of the 2.7-Å FT peak, while the main Fe–S peak remains unchanged.