7.4: Human Impacts on the Carbon Cycle
- Page ID
- 189474
\( \newcommand{\vecs}[1]{\overset { \scriptstyle \rightharpoonup} {\mathbf{#1}} } \)
\( \newcommand{\vecd}[1]{\overset{-\!-\!\rightharpoonup}{\vphantom{a}\smash {#1}}} \)
\( \newcommand{\id}{\mathrm{id}}\) \( \newcommand{\Span}{\mathrm{span}}\)
( \newcommand{\kernel}{\mathrm{null}\,}\) \( \newcommand{\range}{\mathrm{range}\,}\)
\( \newcommand{\RealPart}{\mathrm{Re}}\) \( \newcommand{\ImaginaryPart}{\mathrm{Im}}\)
\( \newcommand{\Argument}{\mathrm{Arg}}\) \( \newcommand{\norm}[1]{\| #1 \|}\)
\( \newcommand{\inner}[2]{\langle #1, #2 \rangle}\)
\( \newcommand{\Span}{\mathrm{span}}\)
\( \newcommand{\id}{\mathrm{id}}\)
\( \newcommand{\Span}{\mathrm{span}}\)
\( \newcommand{\kernel}{\mathrm{null}\,}\)
\( \newcommand{\range}{\mathrm{range}\,}\)
\( \newcommand{\RealPart}{\mathrm{Re}}\)
\( \newcommand{\ImaginaryPart}{\mathrm{Im}}\)
\( \newcommand{\Argument}{\mathrm{Arg}}\)
\( \newcommand{\norm}[1]{\| #1 \|}\)
\( \newcommand{\inner}[2]{\langle #1, #2 \rangle}\)
\( \newcommand{\Span}{\mathrm{span}}\) \( \newcommand{\AA}{\unicode[.8,0]{x212B}}\)
\( \newcommand{\vectorA}[1]{\vec{#1}} % arrow\)
\( \newcommand{\vectorAt}[1]{\vec{\text{#1}}} % arrow\)
\( \newcommand{\vectorB}[1]{\overset { \scriptstyle \rightharpoonup} {\mathbf{#1}} } \)
\( \newcommand{\vectorC}[1]{\textbf{#1}} \)
\( \newcommand{\vectorD}[1]{\overrightarrow{#1}} \)
\( \newcommand{\vectorDt}[1]{\overrightarrow{\text{#1}}} \)
\( \newcommand{\vectE}[1]{\overset{-\!-\!\rightharpoonup}{\vphantom{a}\smash{\mathbf {#1}}}} \)
\( \newcommand{\vecs}[1]{\overset { \scriptstyle \rightharpoonup} {\mathbf{#1}} } \)
\( \newcommand{\vecd}[1]{\overset{-\!-\!\rightharpoonup}{\vphantom{a}\smash {#1}}} \)
\(\newcommand{\avec}{\mathbf a}\) \(\newcommand{\bvec}{\mathbf b}\) \(\newcommand{\cvec}{\mathbf c}\) \(\newcommand{\dvec}{\mathbf d}\) \(\newcommand{\dtil}{\widetilde{\mathbf d}}\) \(\newcommand{\evec}{\mathbf e}\) \(\newcommand{\fvec}{\mathbf f}\) \(\newcommand{\nvec}{\mathbf n}\) \(\newcommand{\pvec}{\mathbf p}\) \(\newcommand{\qvec}{\mathbf q}\) \(\newcommand{\svec}{\mathbf s}\) \(\newcommand{\tvec}{\mathbf t}\) \(\newcommand{\uvec}{\mathbf u}\) \(\newcommand{\vvec}{\mathbf v}\) \(\newcommand{\wvec}{\mathbf w}\) \(\newcommand{\xvec}{\mathbf x}\) \(\newcommand{\yvec}{\mathbf y}\) \(\newcommand{\zvec}{\mathbf z}\) \(\newcommand{\rvec}{\mathbf r}\) \(\newcommand{\mvec}{\mathbf m}\) \(\newcommand{\zerovec}{\mathbf 0}\) \(\newcommand{\onevec}{\mathbf 1}\) \(\newcommand{\real}{\mathbb R}\) \(\newcommand{\twovec}[2]{\left[\begin{array}{r}#1 \\ #2 \end{array}\right]}\) \(\newcommand{\ctwovec}[2]{\left[\begin{array}{c}#1 \\ #2 \end{array}\right]}\) \(\newcommand{\threevec}[3]{\left[\begin{array}{r}#1 \\ #2 \\ #3 \end{array}\right]}\) \(\newcommand{\cthreevec}[3]{\left[\begin{array}{c}#1 \\ #2 \\ #3 \end{array}\right]}\) \(\newcommand{\fourvec}[4]{\left[\begin{array}{r}#1 \\ #2 \\ #3 \\ #4 \end{array}\right]}\) \(\newcommand{\cfourvec}[4]{\left[\begin{array}{c}#1 \\ #2 \\ #3 \\ #4 \end{array}\right]}\) \(\newcommand{\fivevec}[5]{\left[\begin{array}{r}#1 \\ #2 \\ #3 \\ #4 \\ #5 \\ \end{array}\right]}\) \(\newcommand{\cfivevec}[5]{\left[\begin{array}{c}#1 \\ #2 \\ #3 \\ #4 \\ #5 \\ \end{array}\right]}\) \(\newcommand{\mattwo}[4]{\left[\begin{array}{rr}#1 \amp #2 \\ #3 \amp #4 \\ \end{array}\right]}\) \(\newcommand{\laspan}[1]{\text{Span}\{#1\}}\) \(\newcommand{\bcal}{\cal B}\) \(\newcommand{\ccal}{\cal C}\) \(\newcommand{\scal}{\cal S}\) \(\newcommand{\wcal}{\cal W}\) \(\newcommand{\ecal}{\cal E}\) \(\newcommand{\coords}[2]{\left\{#1\right\}_{#2}}\) \(\newcommand{\gray}[1]{\color{gray}{#1}}\) \(\newcommand{\lgray}[1]{\color{lightgray}{#1}}\) \(\newcommand{\rank}{\operatorname{rank}}\) \(\newcommand{\row}{\text{Row}}\) \(\newcommand{\col}{\text{Col}}\) \(\renewcommand{\row}{\text{Row}}\) \(\newcommand{\nul}{\text{Nul}}\) \(\newcommand{\var}{\text{Var}}\) \(\newcommand{\corr}{\text{corr}}\) \(\newcommand{\len}[1]{\left|#1\right|}\) \(\newcommand{\bbar}{\overline{\bvec}}\) \(\newcommand{\bhat}{\widehat{\bvec}}\) \(\newcommand{\bperp}{\bvec^\perp}\) \(\newcommand{\xhat}{\widehat{\xvec}}\) \(\newcommand{\vhat}{\widehat{\vvec}}\) \(\newcommand{\uhat}{\widehat{\uvec}}\) \(\newcommand{\what}{\widehat{\wvec}}\) \(\newcommand{\Sighat}{\widehat{\Sigma}}\) \(\newcommand{\lt}{<}\) \(\newcommand{\gt}{>}\) \(\newcommand{\amp}{&}\) \(\definecolor{fillinmathshade}{gray}{0.9}\)Humans, just like all other living organisms, have impacted the global carbon cycle since the dawn of our species. However, the magnitude of our impacts has changed dramatically throughout history. The Industrial Revolution, which occurred around the turn of the 19th century, began to make major changes in the use of resources around the world. Beginning in Britain, industrialization eventually affected the whole world. The development of coal-fueled steam power, and later transportation following the discovery of large oil deposits, had enormous influence on the economic and social structure of the world. As the world accelerated in the production and transportation of manufactured goods, the production and consumption of fossil fuels grew. As economic growth continued to increase, so did the production of carbon dioxide through fossil fuel combustion. See Figure \(\PageIndex{2}\) later in this text.
Some of the human impacts on the carbon cycle have been quantified for you in Figure 7.1.1. Changes to fluxes in the carbon cycle that humans are responsible for include: increased contribution of CO2 and other greenhouse gases to the atmosphere through the combustion of fossil fuels and biomass; increased contribution of CO2 to the atmosphere due to land-use changes; increased CO2 dissolving into the ocean through ocean-atmosphere exchange; and increased terrestrial photosynthesis. The first two impacts, both contributing excess CO2 to the atmosphere at a rate of 4 Gt of carbon per year have, by far, the largest impact on our planet. For this reason, this is the change that we will most often focus on throughout this section. The excess CO2 in the atmosphere is responsible for the increased CO2 dissolving into the ocean, which we will discuss later in this section. This is also, in part, responsible for the increased terrestrial photosynthesis that can be observed, as additional CO2 is available to plants for photosynthesis. However, intensive agricultural and forestry practices also contribute to the change in this flux.
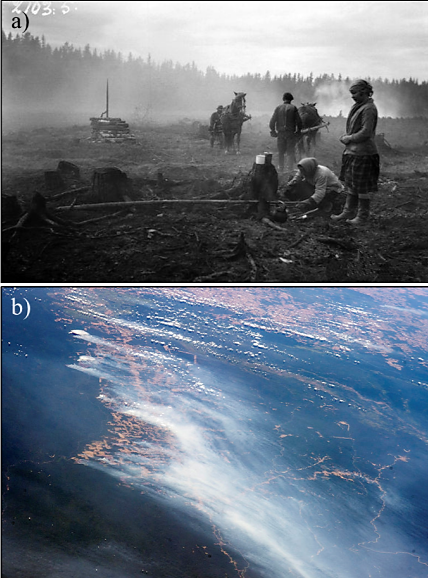
One characteristic example of a human impact on the carbon cycle is illustrated in Figure \(\PageIndex{1}\). Throughout most of our recent human history, people have been physically altering the landscape around them in order to have more control over their surroundings and increase their odds of survival. One way that people have done this is through agriculture. In order for most forms of agriculture to be successful, native vegetation is eliminated or minimized. Resources from this native vegetation, such as wood, may be used for combustion to provide heat, sanitation, or fuel for cooking. Combustion may also be used as an efficient way to clear the land and make way for crops or grazing lands for livestock. Often, settlements are formed around these newly fashioned agricultural fields, and the land is used in a similar fashion for many years in the future.
Let’s identify the ways in which humans are impacting the carbon cycle in this scenario of agricultural establishment. You should be able to identify from the above paragraph that the flux of combustion will release CO2 previously held in vegetation into the atmosphere. In addition, remember that the land that used to house native vegetation is now home to agricultural lands. In most controlled agricultural environments, there is less total vegetative biomass than there would be under natural conditions. This decreased biomass leads to lower total photosynthesis rates, thereby decreasing the amount of CO2 that is removed from the atmosphere and turned into plant biomass. Also, open soil on the fields between crops, during the winter months, or as a result of overgrazing allows for the air to penetrate deep into the soil structure. This provides the environment necessary for enhanced aerobic respiration by soil microorganisms. This decreases soil carbon, which can lead to erosion and soil degradation, and also releases additional CO2 to the atmosphere.
.png?revision=1)
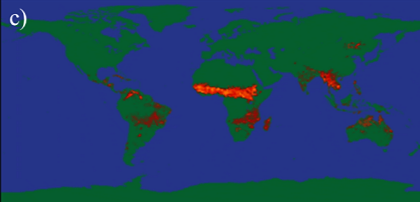
 Figure \(\PageIndex{1}\): Impacts of slash and burn agriculture and biomass burning. a) Slash and burn agriculture in Maaninka, Finland. This kind of agriculture was still in use in Finland at the end of the 1920s. b) Slash and burn agriculture at the margins of the Amazon Rainforest in South America captured by astronauts on the International Space Station in August, 2014. Credit: Astronaut photograph ISS040-E-103496. c) Global distribution of biomass fires, represented by red, orange, and yellow dots (lighter colors indicates more fires), based on nighttime measurements obtained by the DMSP Operational Linescan System. Credit: Julia Cole, NASA Earth Observatory
Figure \(\PageIndex{1}\): Impacts of slash and burn agriculture and biomass burning. a) Slash and burn agriculture in Maaninka, Finland. This kind of agriculture was still in use in Finland at the end of the 1920s. b) Slash and burn agriculture at the margins of the Amazon Rainforest in South America captured by astronauts on the International Space Station in August, 2014. Credit: Astronaut photograph ISS040-E-103496. c) Global distribution of biomass fires, represented by red, orange, and yellow dots (lighter colors indicates more fires), based on nighttime measurements obtained by the DMSP Operational Linescan System. Credit: Julia Cole, NASA Earth Observatory
As you learned in Chapter 5, biomass is an important form of energy to human civilization. Prior to the Industrial Revolution, this was essentially the only form of fuel to which most people on Earth had access. In many less-industrialized countries, combustion of biomass such as wood or animal dung is still the primary energy source that many citizens, particularly in rural areas, depend on for domestic use (heating, sanitation, and cooking) as it is inexpensive, relatively efficient, and readily available. Figure \(\PageIndex{1}\)c shows the global distribution of biomass fires in the world. While the burning of biomass for domestic use contributes to some of these fires, it is the so-called slash-and-burn agriculture that makes up a larger contribution. Take a minute to compare the areas highlighted in Figure \(\PageIndex{1}\)c to the countries of the world that are currently experiencing rapid population growth (Chapter 3). If you need a refresher, use the CIA World Factbook website to view current global population growth values by country: www.cia.gov/library/publicat.../2002rank.html.
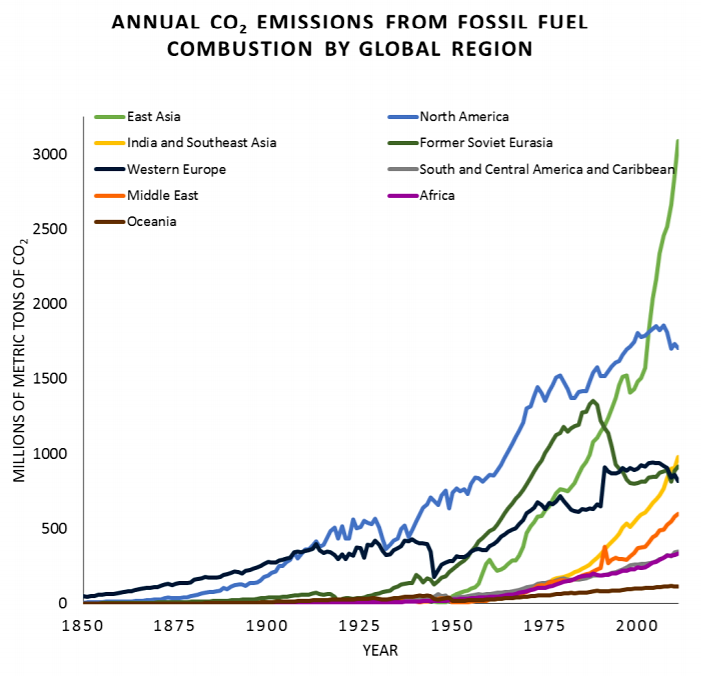
While biomass burning still has a significant impact on the global carbon cycle, human impacts on fluxes such as fossil fuel extraction and combustion continue to grow. For a review of the impacts of non-renewable energy sources such as fossil fuels, see Chapter 4. Burning of any fossil fuel (coal, natural gas, crude oil) moves carbon from a previously-sequestered state deep within the Earth’s crust into carbon dioxide in the atmosphere. As countries become more industrialized, their reliance on and combustion of fossil fuels tends to increase. Look at the graph in Figure \(\PageIndex{2}\), which compares CO2 emissions from fossil fuels of regions across the globe.
How has the use and distribution of fossil fuels changed throughout the past 250 years?
.png?revision=1&size=bestfit&width=589&height=568) Figure \(\PageIndex{2}\): Total annual CO2 emissions from fossil fuel combustion 1850-2011 by global region. Data from the Carbon Dioxide Information Analysis Center (CDIAC) cdiac.esd.ornl.gov/
Figure \(\PageIndex{2}\): Total annual CO2 emissions from fossil fuel combustion 1850-2011 by global region. Data from the Carbon Dioxide Information Analysis Center (CDIAC) cdiac.esd.ornl.gov/
The data shown in Figure \(\PageIndex{2}\) reveals much about the regions of the world it depicts. The effects of historic events such as the Great Depression of 1929-1939, World Wars, the fall of the Soviet Union in 1991, and the Kuwait oil fires of 1991 can be seen. Furthermore, between 1850 and 2011, different regions have gone in and out of the lead position as top producer of CO2 from fossil fuel emissions. Population is one reason why fossil fuel use has changed throughout time. This is particularly apparent when comparing the data for Western Europe to that of India and Southeast Asia.
As countries industrialize, their relationship with agriculture also changes. More-industrialized countries rely very little on slash-and-burn agriculture. Their agricultural practices, however, are no less impactful on the environment. The growing population (Chapter 3) in many countries has required agriculture to become industrialized in order to meet demand. As a person living in the United States, industrialized agriculture probably produces the vast majority of the food you eat, including grains, fruits and vegetables, dairy and eggs, meats, and even fish. Industrialized agriculture can refer to a variety of practices, but has several main components: the use of motorized machinery; the use of chemicals such as fertilizers, pesticides, hormones, and/or antibiotics; and the intense and efficient production of one product across a large area of land.
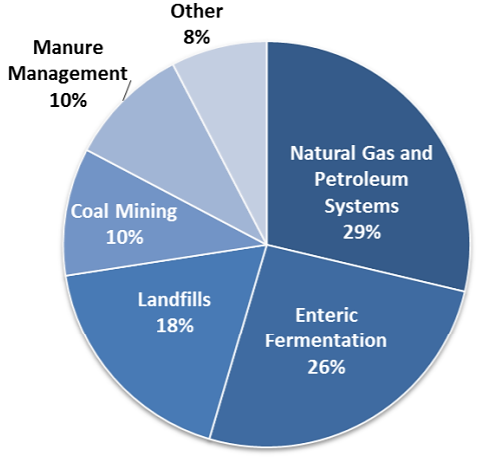
.png?revision=1&size=bestfit&width=361&height=340) Figure \(\PageIndex{3}\): US methane emissions by source. 36% of the US methane production comes from agriculture: enteric fermentation (production of methane by anaerobic bacteria within the ruminant gut) and manure management. All emissions estimates from the Inventory of US Greenhouse Gas Emissions and Sinks: 1990-2013. US EPA
Figure \(\PageIndex{3}\): US methane emissions by source. 36% of the US methane production comes from agriculture: enteric fermentation (production of methane by anaerobic bacteria within the ruminant gut) and manure management. All emissions estimates from the Inventory of US Greenhouse Gas Emissions and Sinks: 1990-2013. US EPA
One example of the impacts of industrialized agriculture is the production of methane (CH4), a potent greenhouse gas. You will learn more methaneabout methane later in this section. As you saw earlier, methane is a common product of anaerobic metabolisms. The gut of ruminant animals (such as sheep, cattle, and goats) has evolved to allow the animals to digest the very tough carbon molecules, such as cellulose, in grass. They do this through symbiosis, or cooperation, with anaerobic bacteria who live in the gut tract. These anaerobic bacteria produce methane and other gases as a result of their metabolism when they break down molecules like cellulose. This is sometimes called enteric fermentation. The methane gas is excreted from the animal, and this contributes significantly to total methane emissions (Figure \(\PageIndex{3}\)). A similar type of bacteria live in the fecal matter, or manure, of livestock. As the manure is handled or stored for future use, methane is also released to the environment.
The methane excretions of one cow or a few sheep would be miniscule and insignificant. If you were a small farmer with only enough livestock to feed your family, your contribution to total methane emissions would be close to zero. However, the demand for animal protein from meat, dairy, and eggs is very large in the United States. As of January 2015, the United States had a total cattle inventory of 89.9 million animals, and in 2014, 25.5 billion pounds of beef was consumed in the United States (statistics: National Cattlemen’s Beef Association). The impacts of enteric fermentation and manure management for almost 90 million animals are very significant, as seen in Figure \(\PageIndex{3}\). In both cases, carbon that was previously stored in biomass (cattle feed) is moved into the atmosphere, this time in the form of CH4. This is another example of how humans have impacted the carbon cycle.
Previously in this chapter, you identified other ways the carbon cycle is impacted by human agriculture. Through industrialized agriculture, we must also account for the fossil fuels that are used. In order to deliver agricultural products to consumers, fossil fuels are used numerous times: deliveries of fertilizer, feed, and/or seed to farms; farm machinery; delivery of products to processers; food processing; delivery of foods to supermarkets; etc.
As animal products, especially meat, are expensive, the demand is typically greater in more industrialized countries than it is in less-industrialized countries. This makes industrialized agriculture, and especially industrialized animal agriculture, one of the major contributors to greenhouse gas emissions in more-industrialized countries.
Knowledge check – answer these questions on your own to further explore the impacts of biomass and fossil fuel burning on the global carbon cycle.
1. Why is there a correlation between population growth rate and global distribution of biomass fires?
2. Do you think this correlation is more likely due to personal biomass fires for activities such as cooking, or due to slash-and-burn agriculture? Why?
3. Given any other knowledge you might have about the areas highlighted in Figure \(\PageIndex{1}\)c, what other environmental impacts may be occurring here besides carbon cycle alterations?
4. Compare the production of CO2 emissions from fossil fuel combustion across world regions in 1900, 1950, and 2011 in Figure \(\PageIndex{2}\). What has accounted for these differences?
5. Has the total worldwide production of CO2 from fossil fuels increased evenly relative to human population growth during the time period displayed in Figure \(\PageIndex{2}\)? Why or why not?
6. What are the differences in contributions of greenhouse gas emissions from more industrialized countries and less-industrialized countries? What are the similarities?
Resources
Carbon Dioxide Information Analysis Center cdiac.esd.ornl.gov/
NOAA Earth System Research Laboratory: Carbon Cycle Science www.esrl.noaa.gov/research/themes/carbon/
Sass, Ronald. Q2: What are the Causes of Global Climate Change? OpenStax CNX. Sep 22, 2009 http://cnx.org/contents/5d263a29-7bd...c233619bca33@3
USDA Climate Change and Agriculture in the United States: Effects and Adaptation www.usda.gov/oce/climate_chan...griculture.htm
US EPA Overview of Greenhouse Gases: Methane http://epa.gov/climatechange/ghgemis...gases/ch4.html
Woods Hole Oceanographic Institution: Carbon Around the Earth http://www.whoi.edu/feature/carboncycle/
Terms list
Aerobic
Less-industrialized country
Anaerobic
Lithosphere
Autotroph
Methane
Biomass
More-industrialized country
Carbon
Nitrous oxide
Carbon dioxide
Ocean-atmosphere
Cellular respiration exchange
Chloroplast
Photosynthesis
Combustion
Potential energy
Consumption
Primary producer
Decomposition
Reservoir
Equilibrium
Residence time
Flux
Ruminant animal
Greenhouse gas
Sink
Heterotroph
Slash-and-burn agriculture
Industrial Revolution
Source
Industrialized agriculture

