
7.3: Powering the United States
- Page ID
- 198474
\( \newcommand{\vecs}[1]{\overset { \scriptstyle \rightharpoonup} {\mathbf{#1}} } \)
\( \newcommand{\vecd}[1]{\overset{-\!-\!\rightharpoonup}{\vphantom{a}\smash {#1}}} \)
\( \newcommand{\id}{\mathrm{id}}\) \( \newcommand{\Span}{\mathrm{span}}\)
( \newcommand{\kernel}{\mathrm{null}\,}\) \( \newcommand{\range}{\mathrm{range}\,}\)
\( \newcommand{\RealPart}{\mathrm{Re}}\) \( \newcommand{\ImaginaryPart}{\mathrm{Im}}\)
\( \newcommand{\Argument}{\mathrm{Arg}}\) \( \newcommand{\norm}[1]{\| #1 \|}\)
\( \newcommand{\inner}[2]{\langle #1, #2 \rangle}\)
\( \newcommand{\Span}{\mathrm{span}}\)
\( \newcommand{\id}{\mathrm{id}}\)
\( \newcommand{\Span}{\mathrm{span}}\)
\( \newcommand{\kernel}{\mathrm{null}\,}\)
\( \newcommand{\range}{\mathrm{range}\,}\)
\( \newcommand{\RealPart}{\mathrm{Re}}\)
\( \newcommand{\ImaginaryPart}{\mathrm{Im}}\)
\( \newcommand{\Argument}{\mathrm{Arg}}\)
\( \newcommand{\norm}[1]{\| #1 \|}\)
\( \newcommand{\inner}[2]{\langle #1, #2 \rangle}\)
\( \newcommand{\Span}{\mathrm{span}}\) \( \newcommand{\AA}{\unicode[.8,0]{x212B}}\)
\( \newcommand{\vectorA}[1]{\vec{#1}} % arrow\)
\( \newcommand{\vectorAt}[1]{\vec{\text{#1}}} % arrow\)
\( \newcommand{\vectorB}[1]{\overset { \scriptstyle \rightharpoonup} {\mathbf{#1}} } \)
\( \newcommand{\vectorC}[1]{\textbf{#1}} \)
\( \newcommand{\vectorD}[1]{\overrightarrow{#1}} \)
\( \newcommand{\vectorDt}[1]{\overrightarrow{\text{#1}}} \)
\( \newcommand{\vectE}[1]{\overset{-\!-\!\rightharpoonup}{\vphantom{a}\smash{\mathbf {#1}}}} \)
\( \newcommand{\vecs}[1]{\overset { \scriptstyle \rightharpoonup} {\mathbf{#1}} } \)
\( \newcommand{\vecd}[1]{\overset{-\!-\!\rightharpoonup}{\vphantom{a}\smash {#1}}} \)
\(\newcommand{\avec}{\mathbf a}\) \(\newcommand{\bvec}{\mathbf b}\) \(\newcommand{\cvec}{\mathbf c}\) \(\newcommand{\dvec}{\mathbf d}\) \(\newcommand{\dtil}{\widetilde{\mathbf d}}\) \(\newcommand{\evec}{\mathbf e}\) \(\newcommand{\fvec}{\mathbf f}\) \(\newcommand{\nvec}{\mathbf n}\) \(\newcommand{\pvec}{\mathbf p}\) \(\newcommand{\qvec}{\mathbf q}\) \(\newcommand{\svec}{\mathbf s}\) \(\newcommand{\tvec}{\mathbf t}\) \(\newcommand{\uvec}{\mathbf u}\) \(\newcommand{\vvec}{\mathbf v}\) \(\newcommand{\wvec}{\mathbf w}\) \(\newcommand{\xvec}{\mathbf x}\) \(\newcommand{\yvec}{\mathbf y}\) \(\newcommand{\zvec}{\mathbf z}\) \(\newcommand{\rvec}{\mathbf r}\) \(\newcommand{\mvec}{\mathbf m}\) \(\newcommand{\zerovec}{\mathbf 0}\) \(\newcommand{\onevec}{\mathbf 1}\) \(\newcommand{\real}{\mathbb R}\) \(\newcommand{\twovec}[2]{\left[\begin{array}{r}#1 \\ #2 \end{array}\right]}\) \(\newcommand{\ctwovec}[2]{\left[\begin{array}{c}#1 \\ #2 \end{array}\right]}\) \(\newcommand{\threevec}[3]{\left[\begin{array}{r}#1 \\ #2 \\ #3 \end{array}\right]}\) \(\newcommand{\cthreevec}[3]{\left[\begin{array}{c}#1 \\ #2 \\ #3 \end{array}\right]}\) \(\newcommand{\fourvec}[4]{\left[\begin{array}{r}#1 \\ #2 \\ #3 \\ #4 \end{array}\right]}\) \(\newcommand{\cfourvec}[4]{\left[\begin{array}{c}#1 \\ #2 \\ #3 \\ #4 \end{array}\right]}\) \(\newcommand{\fivevec}[5]{\left[\begin{array}{r}#1 \\ #2 \\ #3 \\ #4 \\ #5 \\ \end{array}\right]}\) \(\newcommand{\cfivevec}[5]{\left[\begin{array}{c}#1 \\ #2 \\ #3 \\ #4 \\ #5 \\ \end{array}\right]}\) \(\newcommand{\mattwo}[4]{\left[\begin{array}{rr}#1 \amp #2 \\ #3 \amp #4 \\ \end{array}\right]}\) \(\newcommand{\laspan}[1]{\text{Span}\{#1\}}\) \(\newcommand{\bcal}{\cal B}\) \(\newcommand{\ccal}{\cal C}\) \(\newcommand{\scal}{\cal S}\) \(\newcommand{\wcal}{\cal W}\) \(\newcommand{\ecal}{\cal E}\) \(\newcommand{\coords}[2]{\left\{#1\right\}_{#2}}\) \(\newcommand{\gray}[1]{\color{gray}{#1}}\) \(\newcommand{\lgray}[1]{\color{lightgray}{#1}}\) \(\newcommand{\rank}{\operatorname{rank}}\) \(\newcommand{\row}{\text{Row}}\) \(\newcommand{\col}{\text{Col}}\) \(\renewcommand{\row}{\text{Row}}\) \(\newcommand{\nul}{\text{Nul}}\) \(\newcommand{\var}{\text{Var}}\) \(\newcommand{\corr}{\text{corr}}\) \(\newcommand{\len}[1]{\left|#1\right|}\) \(\newcommand{\bbar}{\overline{\bvec}}\) \(\newcommand{\bhat}{\widehat{\bvec}}\) \(\newcommand{\bperp}{\bvec^\perp}\) \(\newcommand{\xhat}{\widehat{\xvec}}\) \(\newcommand{\vhat}{\widehat{\vvec}}\) \(\newcommand{\uhat}{\widehat{\uvec}}\) \(\newcommand{\what}{\widehat{\wvec}}\) \(\newcommand{\Sighat}{\widehat{\Sigma}}\) \(\newcommand{\lt}{<}\) \(\newcommand{\gt}{>}\) \(\newcommand{\amp}{&}\) \(\definecolor{fillinmathshade}{gray}{0.9}\)- Determine if an energy source is renewable or nonrenewable.
- Realize what sources provide the most power for the United States.
- Compare and contrast the different types of energy sources.
- Understand the environmental impacts of energy sources.
- Compare and calculate the amounts of energy produced from each source (using Kilo, Mega, and Giga units)
Source of Energy
Production of electricity can involve either one of two primary energy sources. For example, a country employs nonrenewable sources like natural gas, petroleum, coal, or nuclear energy to supply power to homes and industry. In addition, an area might choose to incorporate renewable energy sources to meet its consumers' needs. Examples of these would include biomass, hydropower, geothermal, wind, and solar energies.
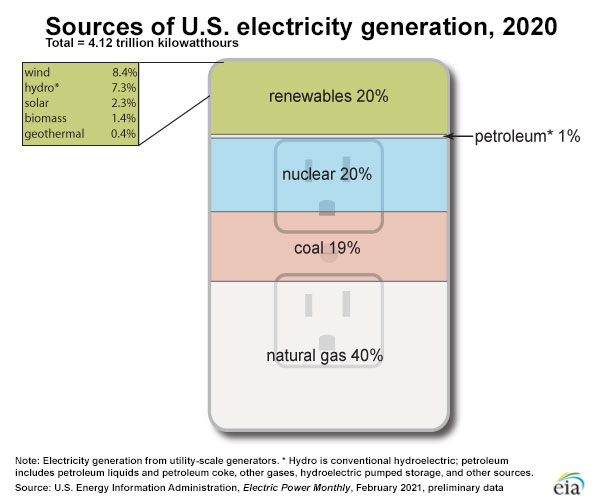
Figure \(\PageIndex{5}\): Chart illustrating electrical power generation in the United States. Image is taken from Electricity in the U.S. - U.S. Energy Information Administration (EIA)
As of 2020, the current United States population is approximately 331 million people. Supplying electricity to a population of this size requires many different types of sources. At this time, the majority of electrical output is the result of fossil fuel combustion. Click on this link to see how energy sources used in the United States have changed over the years.
Energy Units
The SI unit for heat is the Joule. Heat can also be measured using the unit calories. One calorie (this unit is not equivalent to the calorie seen in foods) is equivalent to 4.184 Joules. The table below illustrates the amount ot heat that can be produced from the burning of a specific material. Capital M is representative of the metric unit, mega. The one gas in the table below is measured using the volumetric term of meters cubed (m3). Lastly, the other substance amounts correlate per kilogram of material burned.
| Firewood (dry) | 16 MJ/kg |
| Brown coal (lignite) | 10 MJ/kg |
| Black coal (low quality) | 13-23 MJ/kg |
| Black coal (hard) | 24-30 MJ/kg |
| Natural Gas | 38 MJ/m3 |
| Crude Oil | 45-46 MJ/kg |
| Uranium - in a typical reactor | 500,000 MJ/kg (of natural U) |
Coal
In the United States, coal is the cheapest option as an electrical source. The coal industry estimates that there are approximately 260 billion tons of coal yet to be mined in this country. Assuming the daily rate of coal consumption remained constant, the United States should have enough coal reserves to last over 230 years. Annually, The United States produces over one billion tons of coal. This value equates to approximately 12% of the world's supply.
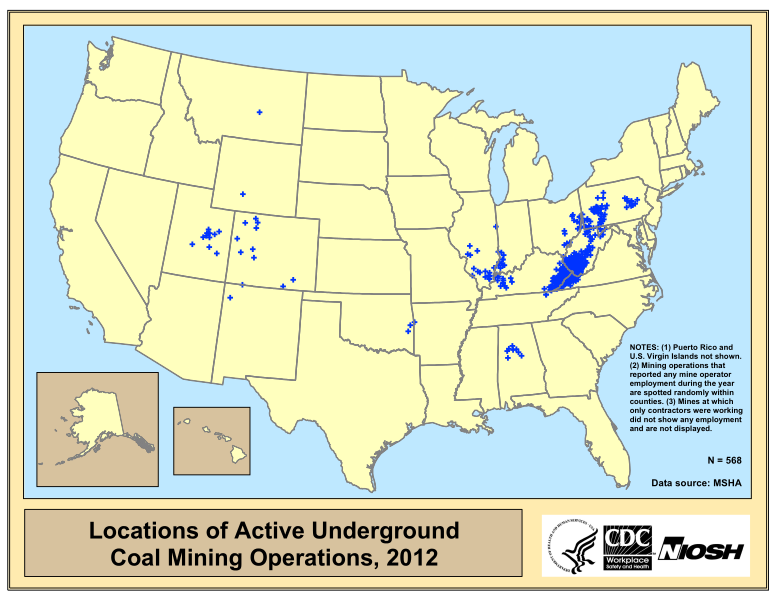
Heavy equipment is utilized to extract coal from the surface of the earth. Surface mining can lead to residual chemicals from the coal entering the water supply and surrounding soils. Many states, namely West Virginia and Pennsylvania, still use coal miners to dig coal from underground reserves. Although regulated, this occupation can be particularly risky with exposure to particulate chemicals that can affect the lung and hearts of workers. In addition, gaseous chemicals inside the mine can combust easily if a spark is present. This could result in trapped workers and fatalities at the site.
There are 600 coal-burning electric plants in the US delivering \(44.9\%\) of American electricity and producing 2 billion tons of \(\ce{CO_2}\) annually, accounting for \(40\%\) of U.S. \(\ce{CO_2}\) emissions and \(10\%\) of global emissions. Coal-burning facilities also produce \(64\%\) of the sulfur dioxide emissions, \(26\%\) of the nitrous oxide emissions, and \(33\%\) of mercury emissions. Sulfur dioxide and nitrous oxide combustion are precursors to acid rain and industrial and photochemical smog. Mercury, a heavy metal toxin, affects the neurological system and can cause behavior and intellectual disorders. Incomplete combustion of carbon can produce particulate matter. These carbon-based solids gather in the atmosphere and make visibility difficult. For more information about combustion of any type of fossil fuel, click on this link.
Trace amounts of radionuclides can be detected in coal. Uranium and thorium isotopes that are present will eventually decay to other species. When burned, these substances become airborne and release their decay products. All chemicals and matter resulting from the combustion process can cause heart, lung, and immunity disorders. In addition, high combustion areas can affect the average lifespan of individuals and species living in these areas.
.jpg?revision=1&size=bestfit&width=511&height=191)
Figure \(\PageIndex{7}\): Two pictures of Beijing in 2005. The picture on the left shows the city after two days of rain. The picture on the right shows smog gathering in the atmosphere.
Coal can be cleaned to remove some impurities (like sulfur-based species), but there is no such thing as "clean" coal. Industries that burn coal can install scrubbers in their smokestacks to grab many pollutants before they enter the atmosphere. In the United States, the Environmental Protection Agency (EPA) regulates all pollutants resulting from the combustion process except for carbon dioxide.
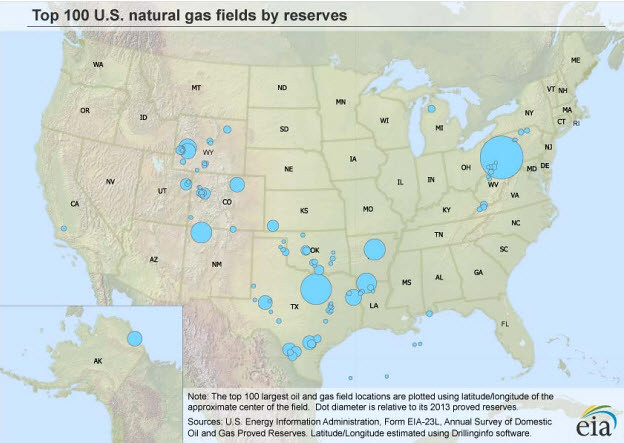
Natural Gas
Natural gas combustion does not produce as many types of byproducts. It is a much cleaner fuel to burn and there would be fewer environmental and health problems related to this fuel choice. Greenhouse gases are still produced when this fuel is burned. Unfortunately, natural gas exists deep within the ground and can be difficult to extract.
Hydroelectric
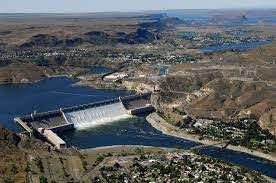
Hydroelectric sources provide almost 7% of the United State's electricity. To use this type of energy, a large body of water needs to be present within the area. A river is intentionally dammed to create a large water supply. With monitored releases, the dammed water is allowed to fall to a lower altitude. This motion will turn a turbine which will produce energy. Unlike fossil fuel combustion, hydroelectric sources do not release toxins into the atmosphere. As a result, this method of energy production does not contribute to global warming, acid rain, or smog production. Some disadvantages of hydroelectric power include the disruption of aquatic ecosystems. Construction of hydroelectric facilities requires large areas of land that could involve uprooting and affecting human and animal populations. Lastly, altering land geology can cause severe flooding.
The largest hydroelectric facility in the United State is located in Washington State along the Columbia River. Grand Coulee Dam produces over 6800 Megawatts of electrical energy for this region of the country. At this time, there are over 1600 hydroelectric plants in the United States.
Solar and Wind Power
In recent years, the use of wind and solar sources has increased in this country. Both of these types of energy require large plots of land for their structures. In addition, both the sun and wind need to be present to generate energy. Wind and solar energy can be stored for days in which the climate does not produce adequate amounts of either. With wind energy, there is some concern about how the structures appear and affect wildlife. These devices can also be very noisy. At this time, Texas leads the country in the production of wind energy.
Research has focused on making components of solar panels less toxic and more affordable for the average consumer. Many utility companies offer incentives for residents to install solar panels. In addition, some utility companies will buy back excess solar wattage from their own consumers. The state of California leads the country in the production of solar energy. The Ivanpah Solar Farm in the Mohave Desert generates over 390 megawatts of energy per year.
.jpg?revision=1&size=bestfit&width=444&height=333)
Recently, Furman University installed its own solar farm. Click on this link to read more about how this university is using renewable energy to cut down on carbon emissions.
Nuclear Reactors
There are over thirty countries that use nuclear power to generate electricity. Commercial nuclear reactors can be found in North and South America, Europe, Africa, and Asia. The United States has the most reactors of any other country. There are around ninety-nine reactors in the United States that provide around twenty percent of the electrical energy in the United States. Other countries, like France, employ around sixty nuclear reactors to produce 80% of their electrical power.
| Country | Number of Operated Reactors | Total Net Electrical Capacity | [MW]Nuclear Electricity Supplied | [GW.h]Nuclear Share |
|---|---|---|---|---|
| FRANCE | 58 | 63130 | 386452.88 | 72.3 |
| SLOVAKIA | 4 | 1814 | 13733.35 | 54.1 |
| UKRAINE | 15 | 13107 | 76077.79 | 52.3 |
| BELGIUM | 7 | 5913 | 41430.45 | 51.7 |
| HUNGARY | 4 | 1889 | 15183.01 | 51.3 |
| SWEDEN | 10 | 9740 | 60647.40 | 40.0 |
| SLOVENIA | 1 | 688 | 5431.27 | 35.2 |
| BULGARIA | 2 | 1926 | 15083.45 | 35.0 |
| SWITZERLAND | 5 | 3333 | 20303.12 | 34.4 |
| FINLAND | 4 | 2764 | 22280.10 | 33.7 |
| ARMENIA | 1 | 375 | 2194.85 | 31.4 |
| KOREA, REPUBLIC OF | 25 | 23077 | 154306.65 | 30.3 |
| CZECH REPUBLIC | 6 | 3930 | 22729.87 | 29.4 |
| SPAIN | 7 | 7121 | 56102.44 | 21.4 |
| UNITED KINGDOM | 15 | 8918 | 65148.98 | 20.4 |
| UNITED STATES OF AMERICA | 100 | 100351 | 804872.94 | 19.7 |
| ROMANIA | 2 | 1300 | 10388.20 | 17.1 |
| RUSSIA | 36 | 26496 | 184054.09 | 17.1 |
| CANADA | 19 | 13554 | 95650.19 | 15.6 |
| GERMANY | 8 | 10799 | 80069.61 | 13.1 |
| SOUTH AFRICA | 2 | 1860 | 15209.47 | 6.6 |
| MEXICO | 2 | 1552 | 10272.29 | 6.2 |
| ARGENTINA | 3 | 1632 | 7677.36 | 5.6 |
| PAKISTAN | 4 | 1005 | 5438.90 | 4.4 |
| CHINA | 36 | 31384 | 197829.04 | 3.6 |
| INDIA | 22 | 6240 | 35006.83 | 3.4 |
| NETHERLANDS | 1 | 482 | 3749.81 | 3.4 |
| BRAZIL | 2 | 1884 | 14970.46 | 2.9 |
| JAPAN | 43 | 40290 | 17537.14 | 2.2 |
| IRAN | 1 | 915 | 5923.97 | 2.1 |
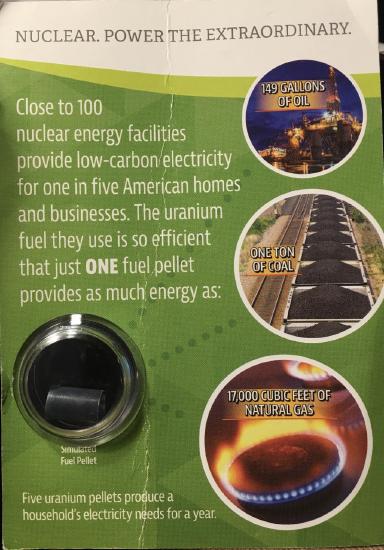
Today's nuclear power plants use fission reactions to generate energy for electrical production. One kilogram of U-235 can supply over 2.4 x 10⁷ kilowatt-hours (kWh) of energy. In contrast, one kilogram of coal can only produce 8 kilowatt-hours of energy. Also, nuclear does not contribute to the problems of acid rain, smog, or greenhouse gas production.
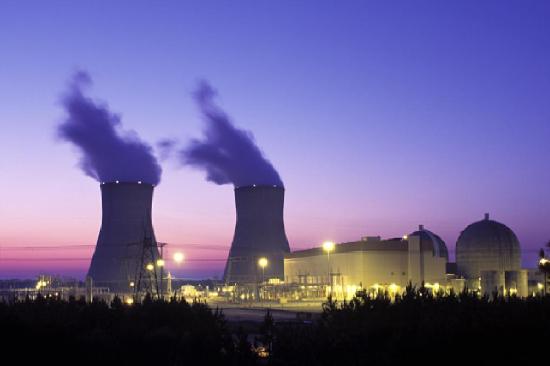
Nuclear and coal power plants can appear similar to most people. Both of these types of facilities have large cooling towers that release excess steam energy into the atmosphere. Nuclear power plants will have small, round, and dome-like structures to house the nuclear reactors. In contrast, coal-fired plants will have slender chimney stacks that tower above or at the rounder cooling towers.

Sources
- en.Wikipedia.org/wiki/Shippi..._Power_Station
- https://www.census.gov/popclock/
- http://www.hydro.org/policy/faq/#494
- www.euronuclear.org/info/enc...comparison.htm
- https://pubs.usgs.gov/fs/1997/fs163-97/FS-163-97.html
Paul Flowers (University of North Carolina - Pembroke), Klaus Theopold (University of Delaware) and Richard Langley (Stephen F. Austin State University) with contributing authors. Textbook content produced by OpenStax College is licensed under a Creative Commons Attribution License 4.0 license. Download for free at http://cnx.org/contents/85abf193-2bd...a7ac8df6@9.110).