3.7.0.0: Heating Curves and Phase Changes (Problems)
- Page ID
- 210731
PROBLEM \(\PageIndex{1}\)
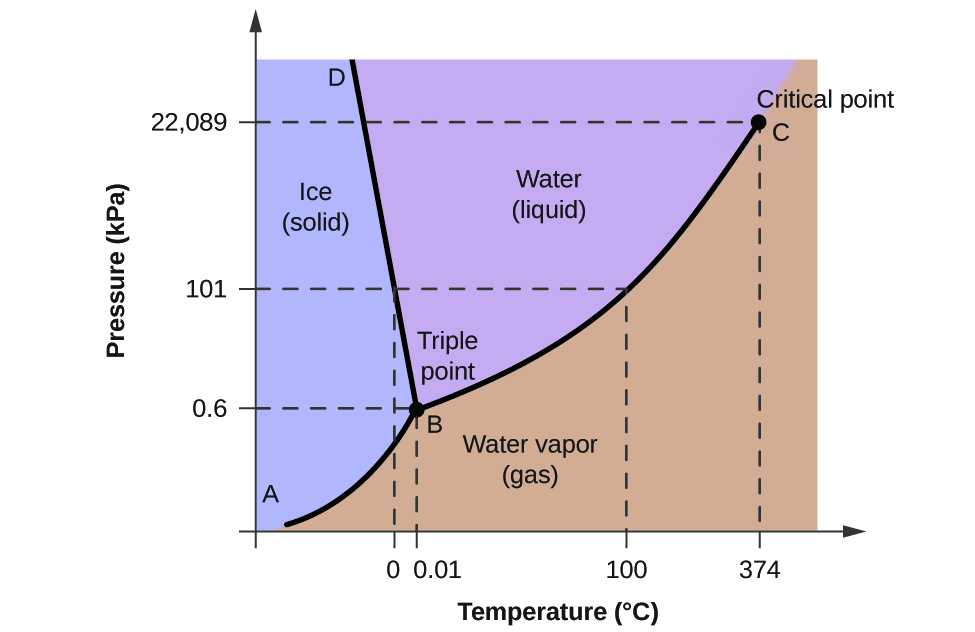
From the phase diagram for water, determine the state of water at:
- 35 °C and 85 kPa
- −15 °C and 40 kPa
- −15 °C and 0.1 kPa
- 75 °C and 3 kPa
- 40 °C and 0.1 kPa
- 60 °C and 50 kPa
- Answer a
-
Liquid
- Answer b
-
solid
- Answer c
-
solid
- Answer d
-
gas
- Answer e
-
gas
- Answer f
-
liquid
PROBLEM \(\PageIndex{2}\)
Evaporation of sweat requires energy and thus take excess heat away from the body. Some of the water that you drink may eventually be converted into sweat and evaporate. If you drink a 20-ounce bottle of water that had been in the refrigerator at 3.8 °C, how much heat is needed to convert all of that water into sweat and then to vapor?? (Note: Your body temperature is 36.6 °C. For the purpose of solving this problem, assume that the thermal properties of sweat are the same as for water.)
- Answer
-
81.17 kJ
PROBLEM \(\PageIndex{3}\)
How much heat is required to convert 422 g of liquid H2O at 23.5 °C into steam at 150 °C?
- Answer
-
1130 kJ
PROBLEM \(\PageIndex{4}\)
Titanium tetrachloride, TiCl4, has a melting point of −23.2 °C and has a ΔH fusion = 9.37 kJ/mol.
- How much energy is required to melt 263.1 g TiCl4?
- For TiCl4, which will likely have the larger magnitude: ΔH fusion or ΔH vaporization? Explain your reasoning.
- Answer a
-
13.0 kJ
- Answer b
-
It is likely that the heat of vaporization will have a larger magnitude since in the case of vaporization the intermolecular interactions have to be completely overcome, while melting weakens or destroys only some of them.
PROBLEM \(\PageIndex{5}\)

What phase changes will take place when water is subjected to varying pressure at a constant temperature of 0.005 °C? At 40 °C? At −40 °C?
- Answer
-
0.005 °C: gas to solid to liquid
40 °C: gas to liquid
−40 °C: gas to solid to liquid (maybe)
PROBLEM \(\PageIndex{6}\)
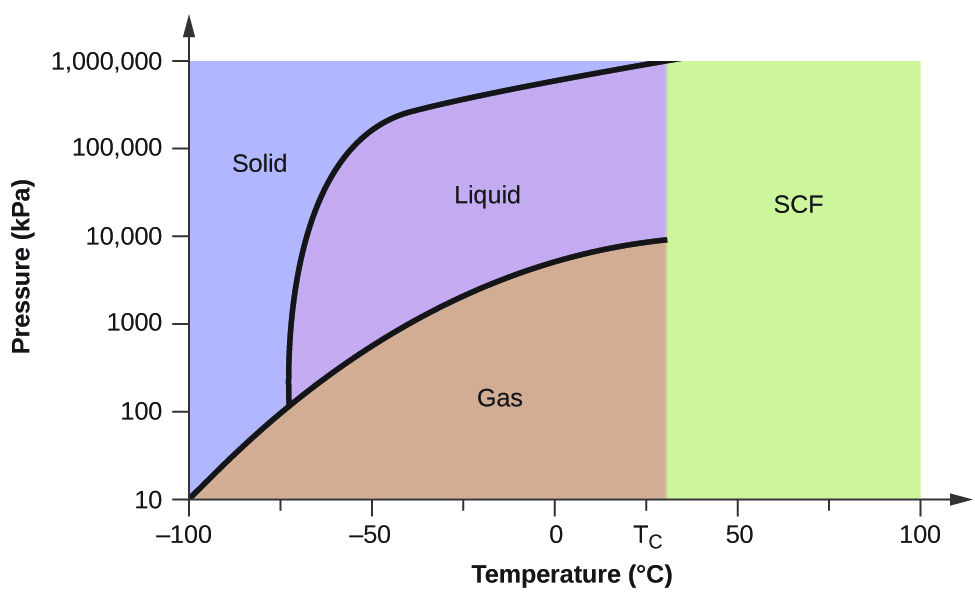
From the phase diagram for carbon dioxide, determine the state of CO2 at:
- 20 °C and 1000 kPa
- 10 °C and 2000 kPa
- 10 °C and 100 kPa
- −40 °C and 500 kPa
- −80 °C and 1500 kPa
- −80 °C and 10 kPa
- Answer a
-
liquid
- Answer b
-
solid
- Answer c
-
gas
- Answer d
-
gas
- Answer e
-
gas
- Answer f
-
gas
PROBLEM \(\PageIndex{7}\)

Determine the phase changes that carbon dioxide undergoes as the pressure changes if the temperature is held at −50 °C? If the temperature is held at −40 °C? At 20 °C?
- Answer
-
−50 °C: gas to liquid to solid
−40 °C: gas to liquid to solid
20 °C: gas to liquid to solid
PROBLEM \(\PageIndex{8}\)

Dry ice, CO2(s), does not melt at atmospheric pressure. It sublimes at a temperature of −78 °C. What is the lowest pressure at which CO2(s) will melt to give CO2(l)? At approximately what temperature will this occur?
- Answer
-
Dry ice, CO2(s), will melt to give CO2(l) at 5.11 atm at −56.6 °C, the triple point of carbon dioxide.
PROBLEM \(\PageIndex{9}\)
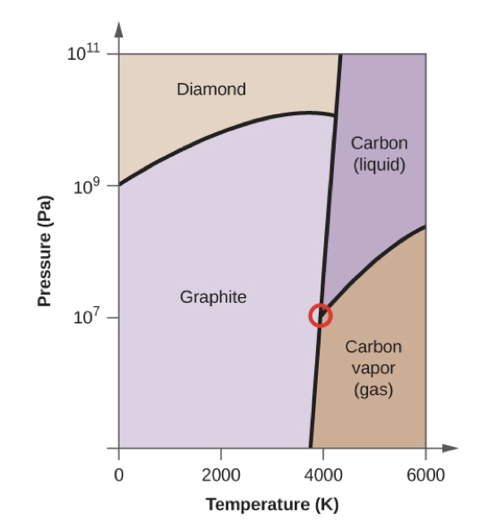
Elemental carbon has one gas phase, one liquid phase, and three different solid phases, as shown in the phase diagram:
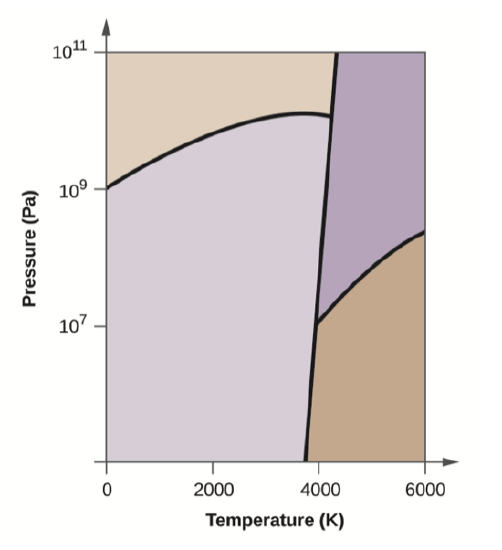
- On the phase diagram, label the gas and liquid regions.
- Graphite is the most stable phase of carbon at normal conditions. On the phase diagram, label the graphite phase.
- If graphite at normal conditions is heated to 2500 K while the pressure is increased to 1010 Pa, it is converted into diamond. Label the diamond phase.
- Circle each triple point on the phase diagram.
- In what phase does carbon exist at 5000 K and 108 Pa?
- If the temperature of a sample of carbon increases from 3000 K to 5000 K at a constant pressure of 106 Pa, which phase transition occurs, if any?
- Answer a
-
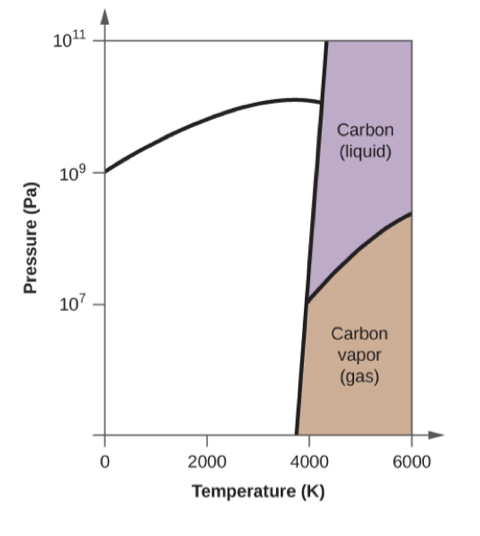
- Answer b
-

- Answer c
-

- Answer d
-
- Answer e
-
liquid
- Answer f
-
sublimation
Have a video solution request?
Let your professors know here.
***Please know that you are helping future students - videos will be made in time for next term's class.
Contributors and Attributions
Paul Flowers (University of North Carolina - Pembroke), Klaus Theopold (University of Delaware) and Richard Langley (Stephen F. Austin State University) with contributing authors. Textbook content produced by OpenStax College is licensed under a Creative Commons Attribution License 4.0 license. Download for free at http://cnx.org/contents/85abf193-2bd...a7ac8df6@9.110).
- Adelaide Clark, Oregon Institute of Technology
Feedback
Think one of the answers above is wrong? Let us know here.

