ATR-FTIR
- Page ID
- 202091
\( \newcommand{\vecs}[1]{\overset { \scriptstyle \rightharpoonup} {\mathbf{#1}} } \)
\( \newcommand{\vecd}[1]{\overset{-\!-\!\rightharpoonup}{\vphantom{a}\smash {#1}}} \)
\( \newcommand{\dsum}{\displaystyle\sum\limits} \)
\( \newcommand{\dint}{\displaystyle\int\limits} \)
\( \newcommand{\dlim}{\displaystyle\lim\limits} \)
\( \newcommand{\id}{\mathrm{id}}\) \( \newcommand{\Span}{\mathrm{span}}\)
( \newcommand{\kernel}{\mathrm{null}\,}\) \( \newcommand{\range}{\mathrm{range}\,}\)
\( \newcommand{\RealPart}{\mathrm{Re}}\) \( \newcommand{\ImaginaryPart}{\mathrm{Im}}\)
\( \newcommand{\Argument}{\mathrm{Arg}}\) \( \newcommand{\norm}[1]{\| #1 \|}\)
\( \newcommand{\inner}[2]{\langle #1, #2 \rangle}\)
\( \newcommand{\Span}{\mathrm{span}}\)
\( \newcommand{\id}{\mathrm{id}}\)
\( \newcommand{\Span}{\mathrm{span}}\)
\( \newcommand{\kernel}{\mathrm{null}\,}\)
\( \newcommand{\range}{\mathrm{range}\,}\)
\( \newcommand{\RealPart}{\mathrm{Re}}\)
\( \newcommand{\ImaginaryPart}{\mathrm{Im}}\)
\( \newcommand{\Argument}{\mathrm{Arg}}\)
\( \newcommand{\norm}[1]{\| #1 \|}\)
\( \newcommand{\inner}[2]{\langle #1, #2 \rangle}\)
\( \newcommand{\Span}{\mathrm{span}}\) \( \newcommand{\AA}{\unicode[.8,0]{x212B}}\)
\( \newcommand{\vectorA}[1]{\vec{#1}} % arrow\)
\( \newcommand{\vectorAt}[1]{\vec{\text{#1}}} % arrow\)
\( \newcommand{\vectorB}[1]{\overset { \scriptstyle \rightharpoonup} {\mathbf{#1}} } \)
\( \newcommand{\vectorC}[1]{\textbf{#1}} \)
\( \newcommand{\vectorD}[1]{\overrightarrow{#1}} \)
\( \newcommand{\vectorDt}[1]{\overrightarrow{\text{#1}}} \)
\( \newcommand{\vectE}[1]{\overset{-\!-\!\rightharpoonup}{\vphantom{a}\smash{\mathbf {#1}}}} \)
\( \newcommand{\vecs}[1]{\overset { \scriptstyle \rightharpoonup} {\mathbf{#1}} } \)
\(\newcommand{\longvect}{\overrightarrow}\)
\( \newcommand{\vecd}[1]{\overset{-\!-\!\rightharpoonup}{\vphantom{a}\smash {#1}}} \)
\(\newcommand{\avec}{\mathbf a}\) \(\newcommand{\bvec}{\mathbf b}\) \(\newcommand{\cvec}{\mathbf c}\) \(\newcommand{\dvec}{\mathbf d}\) \(\newcommand{\dtil}{\widetilde{\mathbf d}}\) \(\newcommand{\evec}{\mathbf e}\) \(\newcommand{\fvec}{\mathbf f}\) \(\newcommand{\nvec}{\mathbf n}\) \(\newcommand{\pvec}{\mathbf p}\) \(\newcommand{\qvec}{\mathbf q}\) \(\newcommand{\svec}{\mathbf s}\) \(\newcommand{\tvec}{\mathbf t}\) \(\newcommand{\uvec}{\mathbf u}\) \(\newcommand{\vvec}{\mathbf v}\) \(\newcommand{\wvec}{\mathbf w}\) \(\newcommand{\xvec}{\mathbf x}\) \(\newcommand{\yvec}{\mathbf y}\) \(\newcommand{\zvec}{\mathbf z}\) \(\newcommand{\rvec}{\mathbf r}\) \(\newcommand{\mvec}{\mathbf m}\) \(\newcommand{\zerovec}{\mathbf 0}\) \(\newcommand{\onevec}{\mathbf 1}\) \(\newcommand{\real}{\mathbb R}\) \(\newcommand{\twovec}[2]{\left[\begin{array}{r}#1 \\ #2 \end{array}\right]}\) \(\newcommand{\ctwovec}[2]{\left[\begin{array}{c}#1 \\ #2 \end{array}\right]}\) \(\newcommand{\threevec}[3]{\left[\begin{array}{r}#1 \\ #2 \\ #3 \end{array}\right]}\) \(\newcommand{\cthreevec}[3]{\left[\begin{array}{c}#1 \\ #2 \\ #3 \end{array}\right]}\) \(\newcommand{\fourvec}[4]{\left[\begin{array}{r}#1 \\ #2 \\ #3 \\ #4 \end{array}\right]}\) \(\newcommand{\cfourvec}[4]{\left[\begin{array}{c}#1 \\ #2 \\ #3 \\ #4 \end{array}\right]}\) \(\newcommand{\fivevec}[5]{\left[\begin{array}{r}#1 \\ #2 \\ #3 \\ #4 \\ #5 \\ \end{array}\right]}\) \(\newcommand{\cfivevec}[5]{\left[\begin{array}{c}#1 \\ #2 \\ #3 \\ #4 \\ #5 \\ \end{array}\right]}\) \(\newcommand{\mattwo}[4]{\left[\begin{array}{rr}#1 \amp #2 \\ #3 \amp #4 \\ \end{array}\right]}\) \(\newcommand{\laspan}[1]{\text{Span}\{#1\}}\) \(\newcommand{\bcal}{\cal B}\) \(\newcommand{\ccal}{\cal C}\) \(\newcommand{\scal}{\cal S}\) \(\newcommand{\wcal}{\cal W}\) \(\newcommand{\ecal}{\cal E}\) \(\newcommand{\coords}[2]{\left\{#1\right\}_{#2}}\) \(\newcommand{\gray}[1]{\color{gray}{#1}}\) \(\newcommand{\lgray}[1]{\color{lightgray}{#1}}\) \(\newcommand{\rank}{\operatorname{rank}}\) \(\newcommand{\row}{\text{Row}}\) \(\newcommand{\col}{\text{Col}}\) \(\renewcommand{\row}{\text{Row}}\) \(\newcommand{\nul}{\text{Nul}}\) \(\newcommand{\var}{\text{Var}}\) \(\newcommand{\corr}{\text{corr}}\) \(\newcommand{\len}[1]{\left|#1\right|}\) \(\newcommand{\bbar}{\overline{\bvec}}\) \(\newcommand{\bhat}{\widehat{\bvec}}\) \(\newcommand{\bperp}{\bvec^\perp}\) \(\newcommand{\xhat}{\widehat{\xvec}}\) \(\newcommand{\vhat}{\widehat{\vvec}}\) \(\newcommand{\uhat}{\widehat{\uvec}}\) \(\newcommand{\what}{\widehat{\wvec}}\) \(\newcommand{\Sighat}{\widehat{\Sigma}}\) \(\newcommand{\lt}{<}\) \(\newcommand{\gt}{>}\) \(\newcommand{\amp}{&}\) \(\definecolor{fillinmathshade}{gray}{0.9}\)This module will go over attenuated total reflectance Fourier transform infrared spectroscopy (ATR-FTIR). It will go over basic physics that describe and dictate the analytical technique. There will be a given example of how ATR-FTIR is used in biological studies. This example will be given in the format of real data and data analysis methods.
Introduction
ATR-FTIR is a tool that has been proven to be useful in various applications1. This technique is able to probe in situ single or multiple layers of adsorbed/deposited species at a solid/liquid interface1,2. It is for this reason that ATR-FTIR has been implemented in various different biological studies in order to probe chemical reactions/structure at the solid/liquid interface2. The reader should be aware that this module will not cover in depth about the physics that govern ATR-FTIR’s ability to probe chemical species, but rather give the reader an introduction on the technique. This module will cover the basic experimental set-up that is currently being utilized in research, briefly go over essential equations that will help the reader better understand methods of experimentation, and finally provide an example of how ATR-FTIR can be utilized.
Experimental Setup
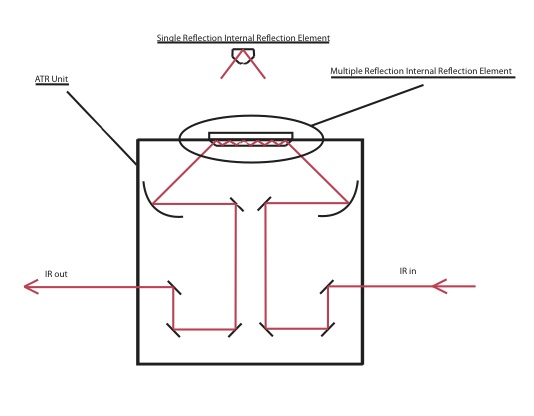
ATR Basics
The infrared radiation that interacts with the adsorbed species is limited to a given depth, and is dependent on the wavelength and angle of the incoming radiation, refractive index of the IRE, and the refractive indices of the interacting layers at the IRE interface. This depth is known as the depth of penetration and the governing equation is shown below.
\[ dp = \dfrac{\lambda}{2\pi \sqrt{n_1}}^2 \text{sin} [\theta ]^2-n_2^2 \tag{1} \]
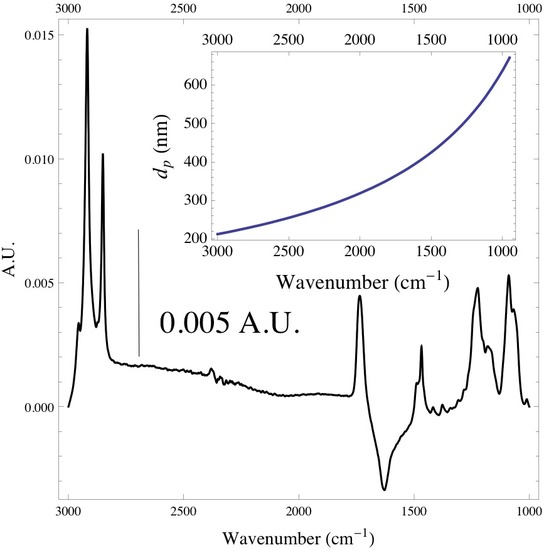
It is good to keep in mind that the if working with systems that have more than one monolayer of adsorbed species that the depth of penetration is dependent on the wavelength of the incoming radiation. If this is the case the depth of penetration will be greater at higher wavelengths, and one will be probing deeper into the medium rather than at the interface of the IRE. Below is a spectrum of a monolayer of DPPC lipid vesicles adsorbed onto the surface of a ZnSe IRE. The inset plot shows the depth of penetration of the infrared radiation with respect to wavenumber.
Vibrational Spectroscopy at the Solid/Liquid Interface
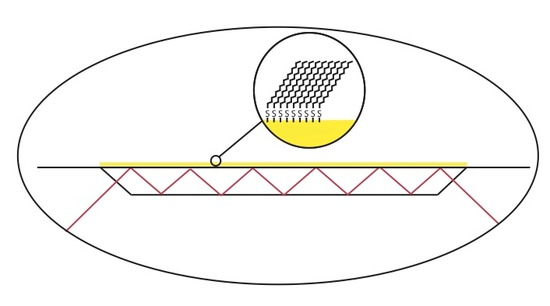
ATR-FTIR has been used to monitor and characterize organic thin film systems such as well formed self-assembled monolayers (SAM). This can be achieved forming a thin film of gold onto the IRE surface, exposing the gold surface to a thiol solution for a given amount of time. The figure below shows an example of an organic thin film formed on the surface of gold that was deposited on an IRE.
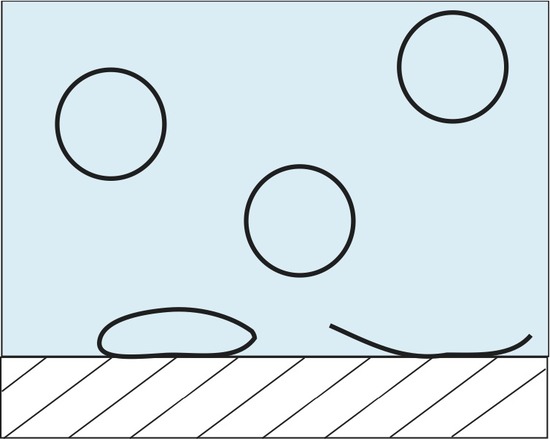
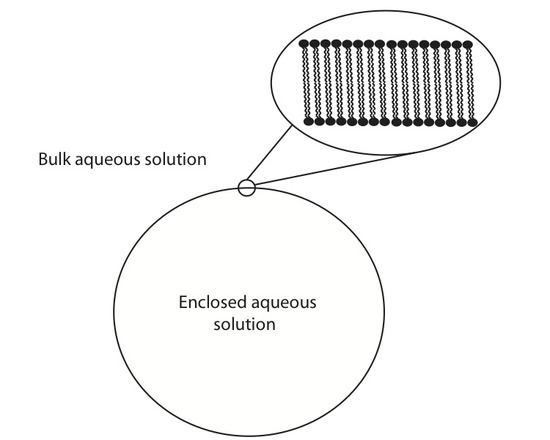
Lipid vesicles have received some attention over the years due to their ability to spontaneously form lipid aggregate spherical structures. These spherical structures have a wall made of lipids that separate the intracellular aqueous medium from the extracellular aqueous medium. They have been implemented in current forms of drug delivery systems, biological contrast agents, as well as serving as a model membrane. ATR-FTIR can be used to study these systems in a number of different ways. One such way to monitor the adsorption rate of these lipid vesicles from a bulk solution to a solid interface. Below is an example of one such experiment where 100 nm lipid vesicles were used to study the adsorption rate onto a ZnSe single reflection IRE.
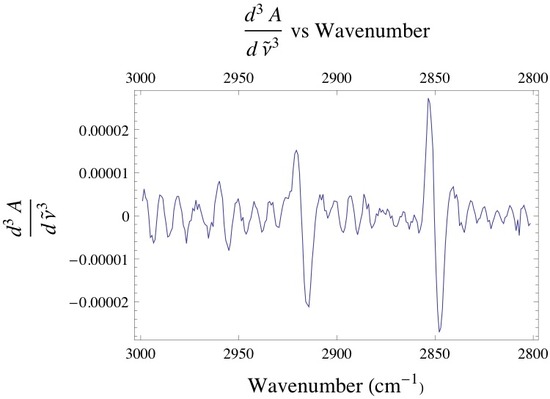
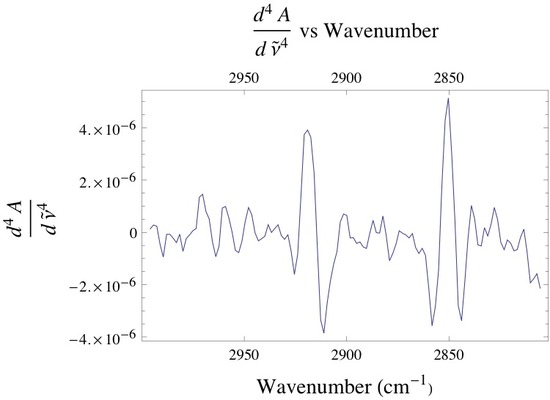
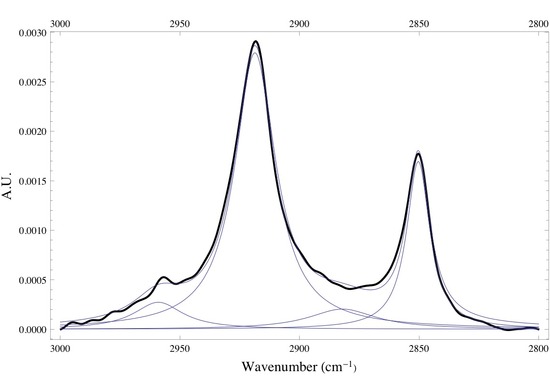
Below is the -C-H stretching region of DPPC found within the 2800 - 3000 cm-1. The interval consists of the overlap of four different bands attributed to different -CH2 and -CH3 vibrational modes found within the acyl chain of DPPC. The bands found at 2850 and 2920 cm-1 are assigned to the -CH2 symmetric and asymmetric vibrational modes, while the bands found at 2880 and 2960 cm-1 are assigned to the -CH3 symmetric and asymmetric vibrational modes. Since the absorbance is proportional to the relative concentration of adsorbed lipid, it has been shown that if one monitors the absorbance under the -CH2 bands one is able to attain precise adsorption rates of the lipid vesicles at the liquid/solid interface. Caution must be taken when finding the absorbance of any absorption band, especially when dealing with overlapping absorption bands like the ones shown below. The proper way to analyze the data is to deconvolute the region of interest by identifying how many absorption bands are present by performing the proper 3rd and 4th derivative analysis on the spectrum, then fitting the data to the correct number of Gaussian/Lorentzian like bands.
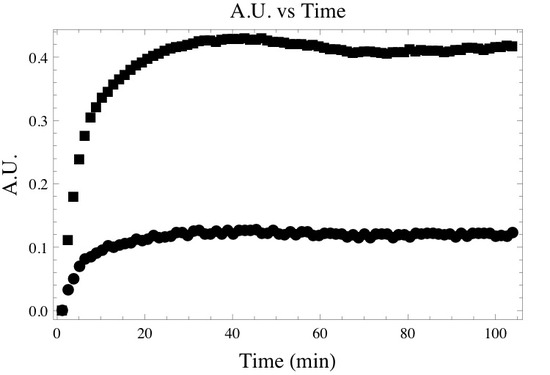
Following the deconvolution and integration of the correct absorption bands one may create a time dependent absorbance plot similar to the one below. Where the top and bottom curve represent the time dependent absorbance of the asymmetric and symmetric -CH2 bands.
References
- Hind, A. R.; Bhargava, S. K.; McKinnon, A., At the solid/liquid interface: FTIR/ATR - the tool of choice. Advances in Colloid and Interface Science 2001, 93 (1-3), 91-114.
- Kazarian, S. G.; Chan, K. L. A., Applications of ATR-FTIR spectroscopic imaging to biomedical samples. Biochimica Et Biophysica Acta-Biomembranes 2006, 1758 (7), 858-867.
Problems
What is the depth of penetration within water, if you are using a ZnSe internal reflection element, have an incident angle of 30o, and you are at 1000 cm-1? (Hint: You will need the ni for water and ZnSe.)


