
X-ray Crystallography
- Page ID
- 202103
\( \newcommand{\vecs}[1]{\overset { \scriptstyle \rightharpoonup} {\mathbf{#1}} } \)
\( \newcommand{\vecd}[1]{\overset{-\!-\!\rightharpoonup}{\vphantom{a}\smash {#1}}} \)
\( \newcommand{\dsum}{\displaystyle\sum\limits} \)
\( \newcommand{\dint}{\displaystyle\int\limits} \)
\( \newcommand{\dlim}{\displaystyle\lim\limits} \)
\( \newcommand{\id}{\mathrm{id}}\) \( \newcommand{\Span}{\mathrm{span}}\)
( \newcommand{\kernel}{\mathrm{null}\,}\) \( \newcommand{\range}{\mathrm{range}\,}\)
\( \newcommand{\RealPart}{\mathrm{Re}}\) \( \newcommand{\ImaginaryPart}{\mathrm{Im}}\)
\( \newcommand{\Argument}{\mathrm{Arg}}\) \( \newcommand{\norm}[1]{\| #1 \|}\)
\( \newcommand{\inner}[2]{\langle #1, #2 \rangle}\)
\( \newcommand{\Span}{\mathrm{span}}\)
\( \newcommand{\id}{\mathrm{id}}\)
\( \newcommand{\Span}{\mathrm{span}}\)
\( \newcommand{\kernel}{\mathrm{null}\,}\)
\( \newcommand{\range}{\mathrm{range}\,}\)
\( \newcommand{\RealPart}{\mathrm{Re}}\)
\( \newcommand{\ImaginaryPart}{\mathrm{Im}}\)
\( \newcommand{\Argument}{\mathrm{Arg}}\)
\( \newcommand{\norm}[1]{\| #1 \|}\)
\( \newcommand{\inner}[2]{\langle #1, #2 \rangle}\)
\( \newcommand{\Span}{\mathrm{span}}\) \( \newcommand{\AA}{\unicode[.8,0]{x212B}}\)
\( \newcommand{\vectorA}[1]{\vec{#1}} % arrow\)
\( \newcommand{\vectorAt}[1]{\vec{\text{#1}}} % arrow\)
\( \newcommand{\vectorB}[1]{\overset { \scriptstyle \rightharpoonup} {\mathbf{#1}} } \)
\( \newcommand{\vectorC}[1]{\textbf{#1}} \)
\( \newcommand{\vectorD}[1]{\overrightarrow{#1}} \)
\( \newcommand{\vectorDt}[1]{\overrightarrow{\text{#1}}} \)
\( \newcommand{\vectE}[1]{\overset{-\!-\!\rightharpoonup}{\vphantom{a}\smash{\mathbf {#1}}}} \)
\( \newcommand{\vecs}[1]{\overset { \scriptstyle \rightharpoonup} {\mathbf{#1}} } \)
\(\newcommand{\longvect}{\overrightarrow}\)
\( \newcommand{\vecd}[1]{\overset{-\!-\!\rightharpoonup}{\vphantom{a}\smash {#1}}} \)
\(\newcommand{\avec}{\mathbf a}\) \(\newcommand{\bvec}{\mathbf b}\) \(\newcommand{\cvec}{\mathbf c}\) \(\newcommand{\dvec}{\mathbf d}\) \(\newcommand{\dtil}{\widetilde{\mathbf d}}\) \(\newcommand{\evec}{\mathbf e}\) \(\newcommand{\fvec}{\mathbf f}\) \(\newcommand{\nvec}{\mathbf n}\) \(\newcommand{\pvec}{\mathbf p}\) \(\newcommand{\qvec}{\mathbf q}\) \(\newcommand{\svec}{\mathbf s}\) \(\newcommand{\tvec}{\mathbf t}\) \(\newcommand{\uvec}{\mathbf u}\) \(\newcommand{\vvec}{\mathbf v}\) \(\newcommand{\wvec}{\mathbf w}\) \(\newcommand{\xvec}{\mathbf x}\) \(\newcommand{\yvec}{\mathbf y}\) \(\newcommand{\zvec}{\mathbf z}\) \(\newcommand{\rvec}{\mathbf r}\) \(\newcommand{\mvec}{\mathbf m}\) \(\newcommand{\zerovec}{\mathbf 0}\) \(\newcommand{\onevec}{\mathbf 1}\) \(\newcommand{\real}{\mathbb R}\) \(\newcommand{\twovec}[2]{\left[\begin{array}{r}#1 \\ #2 \end{array}\right]}\) \(\newcommand{\ctwovec}[2]{\left[\begin{array}{c}#1 \\ #2 \end{array}\right]}\) \(\newcommand{\threevec}[3]{\left[\begin{array}{r}#1 \\ #2 \\ #3 \end{array}\right]}\) \(\newcommand{\cthreevec}[3]{\left[\begin{array}{c}#1 \\ #2 \\ #3 \end{array}\right]}\) \(\newcommand{\fourvec}[4]{\left[\begin{array}{r}#1 \\ #2 \\ #3 \\ #4 \end{array}\right]}\) \(\newcommand{\cfourvec}[4]{\left[\begin{array}{c}#1 \\ #2 \\ #3 \\ #4 \end{array}\right]}\) \(\newcommand{\fivevec}[5]{\left[\begin{array}{r}#1 \\ #2 \\ #3 \\ #4 \\ #5 \\ \end{array}\right]}\) \(\newcommand{\cfivevec}[5]{\left[\begin{array}{c}#1 \\ #2 \\ #3 \\ #4 \\ #5 \\ \end{array}\right]}\) \(\newcommand{\mattwo}[4]{\left[\begin{array}{rr}#1 \amp #2 \\ #3 \amp #4 \\ \end{array}\right]}\) \(\newcommand{\laspan}[1]{\text{Span}\{#1\}}\) \(\newcommand{\bcal}{\cal B}\) \(\newcommand{\ccal}{\cal C}\) \(\newcommand{\scal}{\cal S}\) \(\newcommand{\wcal}{\cal W}\) \(\newcommand{\ecal}{\cal E}\) \(\newcommand{\coords}[2]{\left\{#1\right\}_{#2}}\) \(\newcommand{\gray}[1]{\color{gray}{#1}}\) \(\newcommand{\lgray}[1]{\color{lightgray}{#1}}\) \(\newcommand{\rank}{\operatorname{rank}}\) \(\newcommand{\row}{\text{Row}}\) \(\newcommand{\col}{\text{Col}}\) \(\renewcommand{\row}{\text{Row}}\) \(\newcommand{\nul}{\text{Nul}}\) \(\newcommand{\var}{\text{Var}}\) \(\newcommand{\corr}{\text{corr}}\) \(\newcommand{\len}[1]{\left|#1\right|}\) \(\newcommand{\bbar}{\overline{\bvec}}\) \(\newcommand{\bhat}{\widehat{\bvec}}\) \(\newcommand{\bperp}{\bvec^\perp}\) \(\newcommand{\xhat}{\widehat{\xvec}}\) \(\newcommand{\vhat}{\widehat{\vvec}}\) \(\newcommand{\uhat}{\widehat{\uvec}}\) \(\newcommand{\what}{\widehat{\wvec}}\) \(\newcommand{\Sighat}{\widehat{\Sigma}}\) \(\newcommand{\lt}{<}\) \(\newcommand{\gt}{>}\) \(\newcommand{\amp}{&}\) \(\definecolor{fillinmathshade}{gray}{0.9}\)X-ray Crystallography is a scientific method used to determine the arrangement of atoms of a crystalline solid in three dimensional space. This technique takes advantage of the interatomic spacing of most crystalline solids by employing them as a diffraction gradient for x-ray light, which has wavelengths on the order of 1 angstrom (10-8 cm).
Introduction
In 1895, Wilhelm Rontgen discovered x- rays. The nature of x- rays, whether they were particles or electromagnetic radiation, was a topic of debate until 1912. If the wave idea was correct, researchers knew that the wavelength of this light would need to be on the order of 1 Angstrom (A) (10-8 cm). Diffraction and measurement of such small wavelengths would require a gradient with spacing on the same order of magnitude as the light.
In 1912, Max von Laue, at the University of Munich in Germany, postulated that atoms in a crystal lattice had a regular, periodic structure with interatomic distances on the order of 1 A. Without having any evidence to support his claim on the periodic arrangements of atoms in a lattice, he further postulated that the crystalline structure can be used to diffract x-rays, much like a gradient in an infrared spectrometer can diffract infrared light. His postulate was based on the following assumptions: the atomic lattice of a crystal is periodic, x- rays are electromagnetic radiation, and the interatomic distance of a crystal are on the same order of magnitude as x- ray light. Laue's predictions were confirmed when two researchers: Friedrich and Knipping, successfully photographed the diffraction pattern associated with the x-ray radiation of crystalline \(CuSO_4 \cdot 5H_2O\). The science of x-ray crystallography was born.
The arrangement of the atoms needs to be in an ordered, periodic structure in order for them to diffract the x-ray beams. A series of mathematical calculations is then used to produce a diffraction pattern that is characteristic to the particular arrangement of atoms in that crystal. X-ray crystallography remains to this day the primary tool used by researchers in characterizing the structure and bonding of organometallic compounds.
Diffraction
Diffraction is a phenomena that occurs when light encounters an obstacle. The waves of light can either bend around the obstacle, or in the case of a slit, can travel through the slits. The resulting diffraction pattern will show areas of constructive interference, where two waves interact in phase, and destructive interference, where two waves interact out of phase. Calculation of the phase difference can be explained by examining Figure 1 below.
.jpg?revision=1)
In the figure below, two parallel waves, BD and AH are striking a gradient at an angle \(θ_o\). The incident wave BD travels farther than AH by a distance of CD before reaching the gradient. The scattered wave (depicted below the gradient) HF, travels father than the scattered wave DE by a distance of HG. So the total path difference between path AHGF and BCDE is CD - HG. To observe a wave of high intensity (one created through constructive interference), the difference CD - HG must equal to an integer number of wavelengths to be observed at the angle psi, \(CD - HG = n\lambda\), where \(\lambda\) is the wavelength of the light. Applying some basic trigonometric properties, the following two equations can be shown about the lines:
\[CD = x \cos(θ o)\]
and
\[HG = x \cos (θ) \]
where \(x\) is the distance between the points where the diffraction repeats. Combining the two equations,
Bragg's Law
Diffraction of an x-ray beam, occurs when the light interacts with the electron cloud surrounding the atoms of the crystalline solid. Due to the periodic crystalline structure of a solid, it is possible to describe it as a series of planes with an equal interplaner distance. As an x-ray's beam hits the surface of the crystal at an angle ?, some of the light will be diffracted at that same angle away from the solid (Figure 2). The remainder of the light will travel into the crystal and some of that light will interact with the second plane of atoms. Some of the light will be diffracted at an angle \(theta\), and the remainder will travel deeper into the solid. This process will repeat for the many planes in the crystal. The x-ray beams travel different pathlengths before hitting the various planes of the crystal, so after diffraction, the beams will interact constructively only if the path length difference is equal to an integer number of wavelengths (just like in the normal diffraction case above). In the figure below, the difference in path lengths of the beam striking the first plane and the beam striking the second plane is equal to BG + GF. So, the two diffracted beams will constructively interfere (be in phase) only if \(BG + GF = n \lambda\). Basic trigonometry will tell us that the two segments are equal to one another with the interplaner distance times the sine of the angle \(\theta\). So we get:
\[ BG = BC = d \sin \theta \label{1}\]
Thus,
\[ 2d \sin \theta = n \lambda \label{2}\]
This equation is known as Bragg's Law, named after W. H. Bragg and his son, W. L. Bragg; who discovered this geometric relationship in 1912. {C}{C}Bragg's Law relates the distance between two planes in a crystal and the angle of reflection to the x-ray wavelength. The x-rays that are diffracted off the crystal have to be in-phase in order to signal. Only certain angles that satisfy the following condition will register:
\[ \sin \theta = \dfrac{n \lambda}{2d} \label{3} \]
For historical reasons, the resulting diffraction spectrum is represented as intensity vs. \(2θ\).
.jpg?revision=1&size=bestfit&width=379&height=324)
Instrument Components
The main components of an x-ray instrument are similar to those of many optical spectroscopic instruments. These include a source, a device to select and restrict the wavelengths used for measurement, a holder for the sample, a detector, and a signal converter and readout. However, for x-ray diffraction; only a source, sample holder, and signal converter/readout are required.
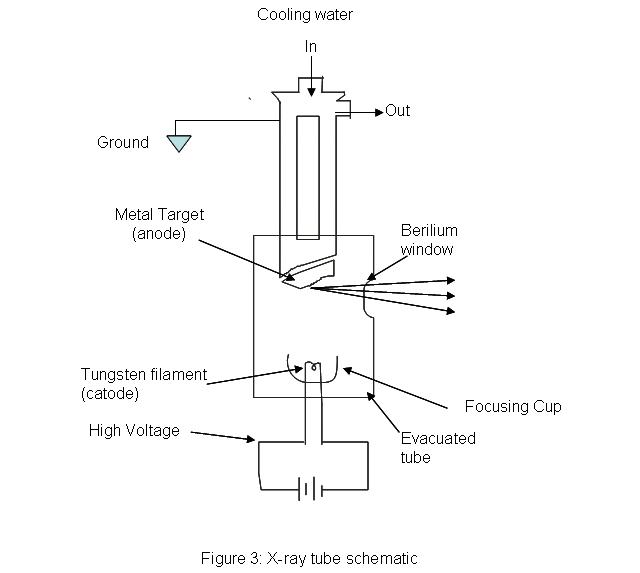
The Source
x-ray tubes provides a means for generating x-ray radiation in most analytical instruments. An evacuated tube houses a tungsten filament which acts as a cathode opposite to a much larger, water cooled anode made of copper with a metal plate on it. The metal plate can be made of any of the following metals: chromium, tungsten, copper, rhodium, silver, cobalt, and iron. A high voltage is passed through the filament and high energy electrons are produced. The machine needs some way of controlling the intensity and wavelength of the resulting light. The intensity of the light can be controlled by adjusting the amount of current passing through the filament; essentially acting as a temperature control. The wavelength of the light is controlled by setting the proper accelerating voltage of the electrons. The voltage placed across the system will determine the energy of the electrons traveling towards the anode. X-rays are produced when the electrons hit the target metal. Because the energy of light is inversely proportional to wavelength (\(E=hc=h(1/\lambda\)), controlling the energy, controls the wavelength of the x-ray beam.
.jpg?revision=1)
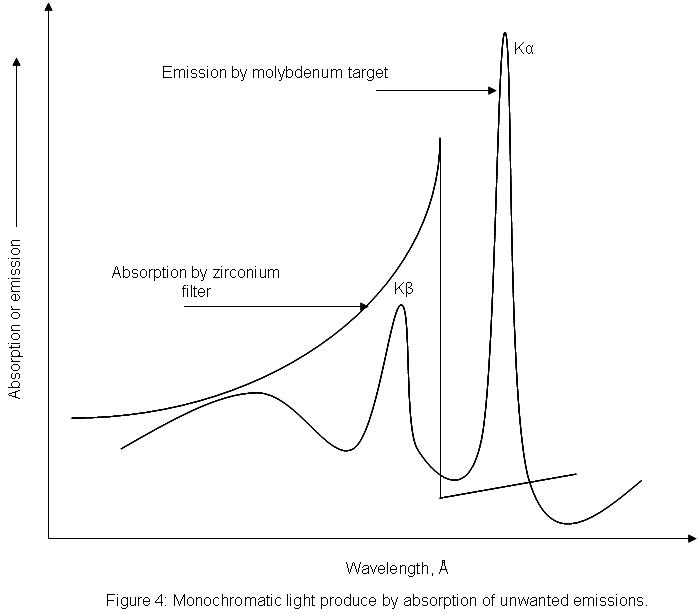
X-ray Filter
Monochromators and filters are used to produce monochromatic x-ray light. This narrow wavelength range is essential for diffraction calculations. For instance, a zirconium filter can be used to cut out unwanted wavelengths from a molybdenum metal target (see figure 4). The molybdenum target will produce x-rays with two wavelengths. A zirconium filter can be used to absorb the unwanted emission with wavelength Kβ, while allowing the desired wavelength, Kα to pass through.
Needle Sample Holder
The sample holder for an x-ray diffraction unit is simply a needle that holds the crystal in place while the x-ray diffractometer takes readings.
Signal Converter
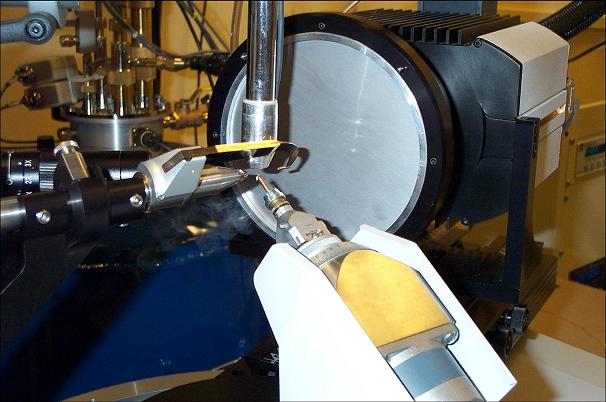
In x-ray diffraction, the detector is a transducer that counts the number of photons that collide into it. This photon counter gives a digital readout in number of photons per unit time. Below is a figure of a typical x-ray diffraction unit with all of the parts labeled.
.jpg?revision=1&size=bestfit&width=324&height=241)
Fourier Transform
In mathematics, a Fourier transform is an operation that converts one real function into another. In the case of FTIR, a Fourier transform is applied to a function in the time domain to convert it into the frequency domain. One way of thinking about this is to draw the example of music by writing it down on a sheet of paper. Each note is in a so-called "sheet" domain. These same notes can also be expressed by playing them. The process of playing the notes can be thought of as converting the notes from the "sheet" domain into the "sound" domain. Each note played represents exactly what is on the paper just in a different way. This is precisely what the Fourier transform process is doing to the collected data of an x-ray diffraction. This is done in order to determine the electron density around the crystalline atoms in real space. The following equations can be used to determine the electrons' position:
\[p(x,y,z) = \sum_h \sum_k \sum_l F(hkl) e ^{-2\pi i (hx+ky+lz)} \label{1A}\]
\[ \int _0^1 \int _0^1 \int _0^1 p(x,y,z) e ^{2\pi i (hx+ky+lz)} dx\;dy\;dz \label{2B}\]
\[F(q) = | F(q) | e^{i \phi(q)} \label{3C}\]
where \(p(xyz)\) is the electron density function, and \(F(hkl)\) is the electron density function in real space. Equation 1 represents the Fourier expansion of the electron density function. To solve for \(F(hkl)\), the equation 1 needs to be evaluated over all values of h, k, and l, resulting in Equation 2. The resulting function \(F(hkl)\) is generally expressed as a complex number (as seen in equation 3 above) with \(| F(q)|\) representing the magnitude of the function and \(\phi\) representing the phase.
Crystallization
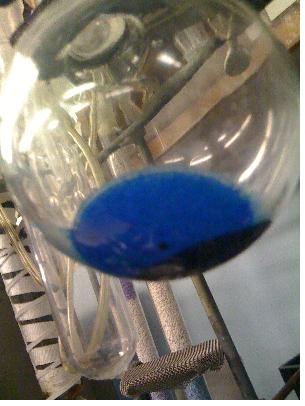
In order to run an x-ray diffraction experiment, one must first obtain a crystal. In organometallic chemistry, a reaction might work but when no crystals form, it is impossible to characterize the products. Crystals are grown by slowly cooling a supersaturated solution. Such a solution can be made by heating a solution to decrease the amount of solvent present and to increase the solubility of the desired compound in the solvent. Once made, the solution must be cooled gradually. Rapid temperature change will cause the compound to crash out of solution, trapping solvent and impurities within the newly formed matrix. Cooling continues as a seed crystal forms. This crystal is a point where solute can deposit out of the solution and into the solid phase. Solutions are generally placed into a freezer (-78 ºC) in order to ensure all of the compound has crystallized. One way to ensure gradual cooling in a -78 ºC freezer is to place the container housing the compound into a beaker of ethanol. The ethanol will act as a temperature buffer, ensuring a slow decrease in the temperature gradient between the flask and the freezer. Once crystals are grown, it is imperative that they remain cold as any addition of energy will cause a disruption of the crystal lattice, which will yield bad diffraction data. The result of an organometallic chromium compound crystallization can be seen below.
.jpg?revision=1)
Mounting the Crystal
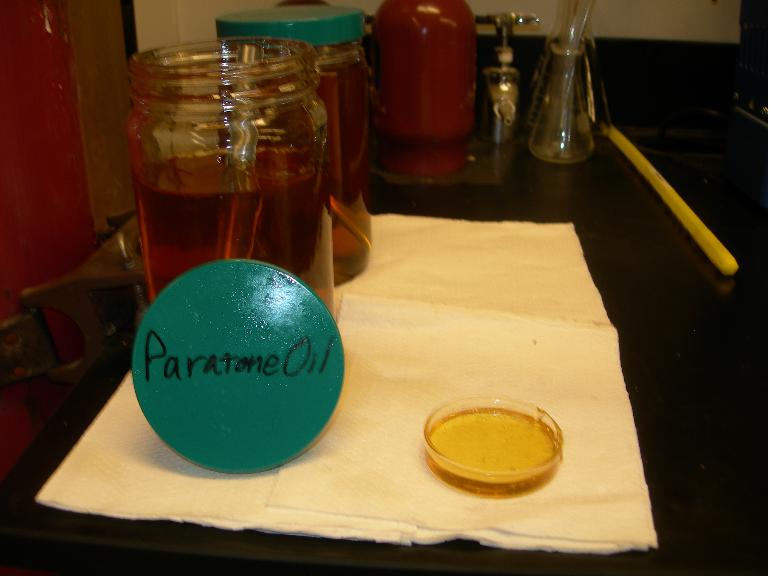
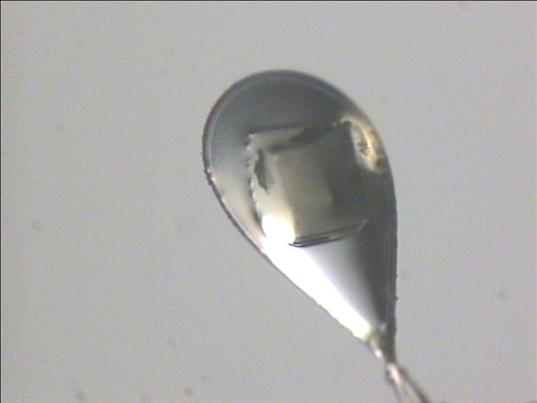
Due to the air-sensitivity of most organometallic compounds, crystals must be transported in a highly viscous organic compound called paratone oil (see picture below). Crystals are abstracted from their respective Schlenks by dabbing the end of a spatula with the paratone oil and then sticking the crystal onto the oil. Although there might be some exposure of the compounds to air and water, crystals can withstand more exposure than solution (of the preserved protein) before degrading. On top of serving to protect the crystal, the paratone oil also serves as the glue to bind the crystal to the needle.
Rotating Crystal Method
To describe the periodic, three dimensional nature of crystals, the Laue equations are employed:
\[ a(\cos \theta_o – \cos \theta) = h\lambda \label{eq1}\]
\[b(\cos \theta_o – \cos \theta) = k\lambda \label{eq2}\]
\[c(\cos \theta_o – \cos \theta) = l\lambda \label{eq3}\]
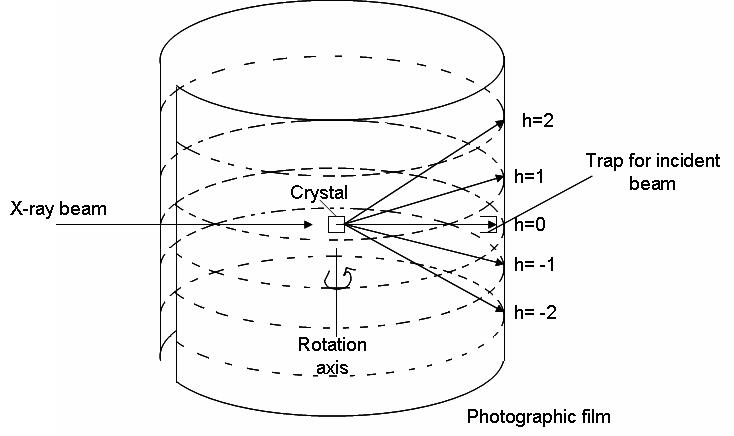
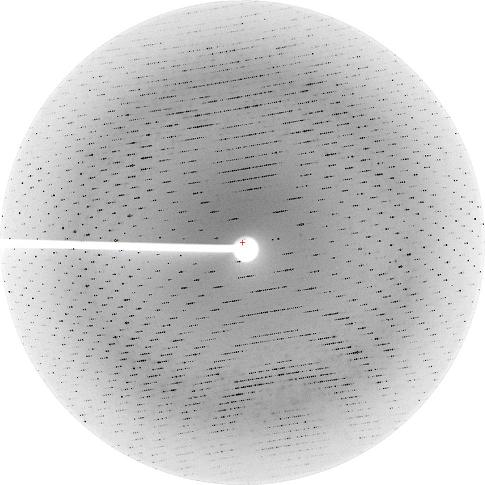
where \(a\), \(b\), and \(c\) are the three axes of the unit cell, \(θ_o\), \(o\), \(?o\) are the angles of incident radiation, and ?, ?, ? are the angles of the diffracted radiation. A diffraction signal (constructive interference) will arise when \(h\), \(k\), and \(l\) are integer values. The rotating crystal method employs these equations. X-ray radiation is shown onto a crystal as it rotates around one of its unit cell axis. The beam strikes the crystal at a 90 degree angle. Using equation 1 above, we see that if \(\theta_o\) is 90 degrees, then \(\cos \theta_o = 0\). For the equation to hold true, we can set h=0, granted that \theta= 90. The above three equations will be satisfied at various points as the crystal rotates. This gives rise to a diffraction pattern (shown in the image below as multiple h values). The cylindrical film is then unwrapped and developed. The following equation can be used to determine the length axis around which the crystal was rotated:
\[ a = \dfrac{ch \lambda}{\sin \tan^{-1} (y/r}\]
where a is the length of the axis, y is the distance from \(h=0\) to the \(h\) of interest, \(r\) is the radius of the firm, and ? is the wavelength of the x-ray radiation used. The first length can be determined with ease, but the other two require far more work, including remounting the crystal so that it rotates around that particular axis.
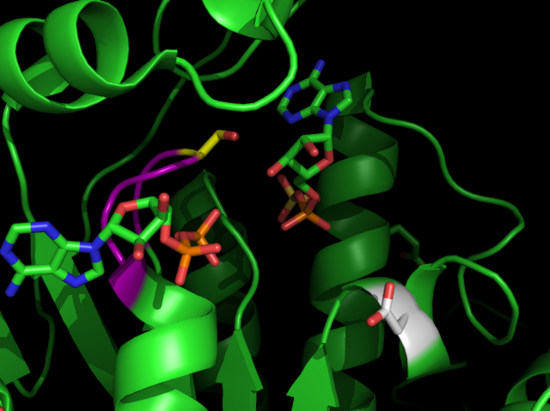
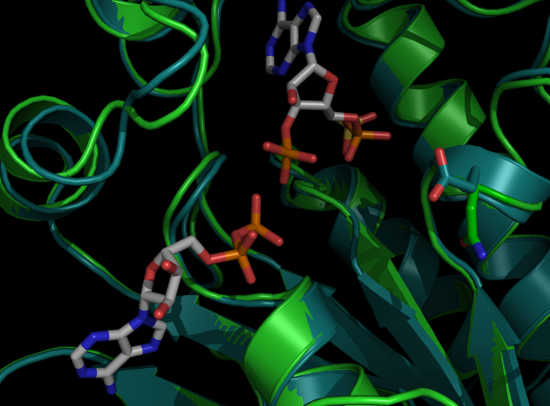
x-ray Crystallography of Proteins
The crystals that form are frozen in liquid nitrogen and taken to the synchrotron which is a highly powered tunable x-ray source. They are mounted on a goniometer and hit with a beam of x-rays. Data is collected as the crystal is rotated through a series of angles. The angle depends on the symmetry of the crystal.
Proteins are among the many biological molecules that are used for x-ray Crystallography studies. They are involved in many pathways in biology, often catalyzing reactions by increasing the reaction rate. Most scientists use x-ray Crystallography to solve the structures of protein and to determine functions of residues, interactions with substrates, and interactions with other proteins or nucleic acids. Proteins can be co - crystallized with these substrates, or they may be soaked into the crystal after crystallization.
Protein crystallization
Proteins will solidify into crystals under certain conditions. These conditions are usually made up of salts, buffers, and precipitating agents. This is often the hardest step in x-ray crystallography. Hundreds of conditions varying the salts, pH, buffer, and precipitating agents are combined with the protein in order to crystallize the protein under the right conditions. This is done using 96 well plates; each well containing a different condition and crystals; which form over the course of days, weeks, or even months. The pictures below are crystals of APS Kinase D63N from Penicillium chrysogenum taken at the Chemistry building at UC Davis after crystals formed over a period of a week.

References
-
Skoog, D . A.; Holler, F. J.; Stanley R. C.; Principles of Instrumental Analysis; Thomson Brooks/Cole: Belmont CA, 2007.
- Sands, D. E.; Introduction to Crystallography; Dover Publications, Inc.; New York, 1975
- Drenth, Jan. Principles of Protein x-ray Crystallography, 3rd edition. 2007, Springer Science + Business Media, LLC. pg. 14.
- Rhodes, Gale. Crystallography Made Crystal Clear, 3rd edition. 2006, Elsevier Inc. pg. 33, 55 - 57.
- Actual experimentation done of APS Kinase D63N Penicillium Chrysogenum.
Contributors
- Roman Kazantsev (UC Davis) and Michelle Towles (UC Davis)