
Dynamic Light Scattering
- Page ID
- 334
\( \newcommand{\vecs}[1]{\overset { \scriptstyle \rightharpoonup} {\mathbf{#1}} } \)
\( \newcommand{\vecd}[1]{\overset{-\!-\!\rightharpoonup}{\vphantom{a}\smash {#1}}} \)
\( \newcommand{\dsum}{\displaystyle\sum\limits} \)
\( \newcommand{\dint}{\displaystyle\int\limits} \)
\( \newcommand{\dlim}{\displaystyle\lim\limits} \)
\( \newcommand{\id}{\mathrm{id}}\) \( \newcommand{\Span}{\mathrm{span}}\)
( \newcommand{\kernel}{\mathrm{null}\,}\) \( \newcommand{\range}{\mathrm{range}\,}\)
\( \newcommand{\RealPart}{\mathrm{Re}}\) \( \newcommand{\ImaginaryPart}{\mathrm{Im}}\)
\( \newcommand{\Argument}{\mathrm{Arg}}\) \( \newcommand{\norm}[1]{\| #1 \|}\)
\( \newcommand{\inner}[2]{\langle #1, #2 \rangle}\)
\( \newcommand{\Span}{\mathrm{span}}\)
\( \newcommand{\id}{\mathrm{id}}\)
\( \newcommand{\Span}{\mathrm{span}}\)
\( \newcommand{\kernel}{\mathrm{null}\,}\)
\( \newcommand{\range}{\mathrm{range}\,}\)
\( \newcommand{\RealPart}{\mathrm{Re}}\)
\( \newcommand{\ImaginaryPart}{\mathrm{Im}}\)
\( \newcommand{\Argument}{\mathrm{Arg}}\)
\( \newcommand{\norm}[1]{\| #1 \|}\)
\( \newcommand{\inner}[2]{\langle #1, #2 \rangle}\)
\( \newcommand{\Span}{\mathrm{span}}\) \( \newcommand{\AA}{\unicode[.8,0]{x212B}}\)
\( \newcommand{\vectorA}[1]{\vec{#1}} % arrow\)
\( \newcommand{\vectorAt}[1]{\vec{\text{#1}}} % arrow\)
\( \newcommand{\vectorB}[1]{\overset { \scriptstyle \rightharpoonup} {\mathbf{#1}} } \)
\( \newcommand{\vectorC}[1]{\textbf{#1}} \)
\( \newcommand{\vectorD}[1]{\overrightarrow{#1}} \)
\( \newcommand{\vectorDt}[1]{\overrightarrow{\text{#1}}} \)
\( \newcommand{\vectE}[1]{\overset{-\!-\!\rightharpoonup}{\vphantom{a}\smash{\mathbf {#1}}}} \)
\( \newcommand{\vecs}[1]{\overset { \scriptstyle \rightharpoonup} {\mathbf{#1}} } \)
\(\newcommand{\longvect}{\overrightarrow}\)
\( \newcommand{\vecd}[1]{\overset{-\!-\!\rightharpoonup}{\vphantom{a}\smash {#1}}} \)
\(\newcommand{\avec}{\mathbf a}\) \(\newcommand{\bvec}{\mathbf b}\) \(\newcommand{\cvec}{\mathbf c}\) \(\newcommand{\dvec}{\mathbf d}\) \(\newcommand{\dtil}{\widetilde{\mathbf d}}\) \(\newcommand{\evec}{\mathbf e}\) \(\newcommand{\fvec}{\mathbf f}\) \(\newcommand{\nvec}{\mathbf n}\) \(\newcommand{\pvec}{\mathbf p}\) \(\newcommand{\qvec}{\mathbf q}\) \(\newcommand{\svec}{\mathbf s}\) \(\newcommand{\tvec}{\mathbf t}\) \(\newcommand{\uvec}{\mathbf u}\) \(\newcommand{\vvec}{\mathbf v}\) \(\newcommand{\wvec}{\mathbf w}\) \(\newcommand{\xvec}{\mathbf x}\) \(\newcommand{\yvec}{\mathbf y}\) \(\newcommand{\zvec}{\mathbf z}\) \(\newcommand{\rvec}{\mathbf r}\) \(\newcommand{\mvec}{\mathbf m}\) \(\newcommand{\zerovec}{\mathbf 0}\) \(\newcommand{\onevec}{\mathbf 1}\) \(\newcommand{\real}{\mathbb R}\) \(\newcommand{\twovec}[2]{\left[\begin{array}{r}#1 \\ #2 \end{array}\right]}\) \(\newcommand{\ctwovec}[2]{\left[\begin{array}{c}#1 \\ #2 \end{array}\right]}\) \(\newcommand{\threevec}[3]{\left[\begin{array}{r}#1 \\ #2 \\ #3 \end{array}\right]}\) \(\newcommand{\cthreevec}[3]{\left[\begin{array}{c}#1 \\ #2 \\ #3 \end{array}\right]}\) \(\newcommand{\fourvec}[4]{\left[\begin{array}{r}#1 \\ #2 \\ #3 \\ #4 \end{array}\right]}\) \(\newcommand{\cfourvec}[4]{\left[\begin{array}{c}#1 \\ #2 \\ #3 \\ #4 \end{array}\right]}\) \(\newcommand{\fivevec}[5]{\left[\begin{array}{r}#1 \\ #2 \\ #3 \\ #4 \\ #5 \\ \end{array}\right]}\) \(\newcommand{\cfivevec}[5]{\left[\begin{array}{c}#1 \\ #2 \\ #3 \\ #4 \\ #5 \\ \end{array}\right]}\) \(\newcommand{\mattwo}[4]{\left[\begin{array}{rr}#1 \amp #2 \\ #3 \amp #4 \\ \end{array}\right]}\) \(\newcommand{\laspan}[1]{\text{Span}\{#1\}}\) \(\newcommand{\bcal}{\cal B}\) \(\newcommand{\ccal}{\cal C}\) \(\newcommand{\scal}{\cal S}\) \(\newcommand{\wcal}{\cal W}\) \(\newcommand{\ecal}{\cal E}\) \(\newcommand{\coords}[2]{\left\{#1\right\}_{#2}}\) \(\newcommand{\gray}[1]{\color{gray}{#1}}\) \(\newcommand{\lgray}[1]{\color{lightgray}{#1}}\) \(\newcommand{\rank}{\operatorname{rank}}\) \(\newcommand{\row}{\text{Row}}\) \(\newcommand{\col}{\text{Col}}\) \(\renewcommand{\row}{\text{Row}}\) \(\newcommand{\nul}{\text{Nul}}\) \(\newcommand{\var}{\text{Var}}\) \(\newcommand{\corr}{\text{corr}}\) \(\newcommand{\len}[1]{\left|#1\right|}\) \(\newcommand{\bbar}{\overline{\bvec}}\) \(\newcommand{\bhat}{\widehat{\bvec}}\) \(\newcommand{\bperp}{\bvec^\perp}\) \(\newcommand{\xhat}{\widehat{\xvec}}\) \(\newcommand{\vhat}{\widehat{\vvec}}\) \(\newcommand{\uhat}{\widehat{\uvec}}\) \(\newcommand{\what}{\widehat{\wvec}}\) \(\newcommand{\Sighat}{\widehat{\Sigma}}\) \(\newcommand{\lt}{<}\) \(\newcommand{\gt}{>}\) \(\newcommand{\amp}{&}\) \(\definecolor{fillinmathshade}{gray}{0.9}\)Dynamic Light Scattering (DLS), also called Photon Correlation Spectroscopy, is a spectroscopic technique used in Chemistry, Biochemistry, and Physics primarily to characterize the hydrodynamic radius of polymers, proteins, and colloids in solution. DLS is a useful technique for determining the size distribution of nanoparticles in a suspension and detecting small amounts of high mass species in protein samples.
Introduction
In a typical DLS experiment, a solution/suspension of analyte is irradiated with monochromatic laser light and fluctuations in the intensity of the diffracted light are measured as a function of time. Intensity data is then collected using an autocorrelator to determine the size distribution of particles or molecules in a sample.
In general, when a sample of particles with diamter much smaller than the wavelength of light is irradiated with light, each particle will diffract the incident light in all directions. This is called Rayleigh Scattering. If that diffracted light is projected as an image onto a screen it will generate a “speckle" pattern like the one seen here.3
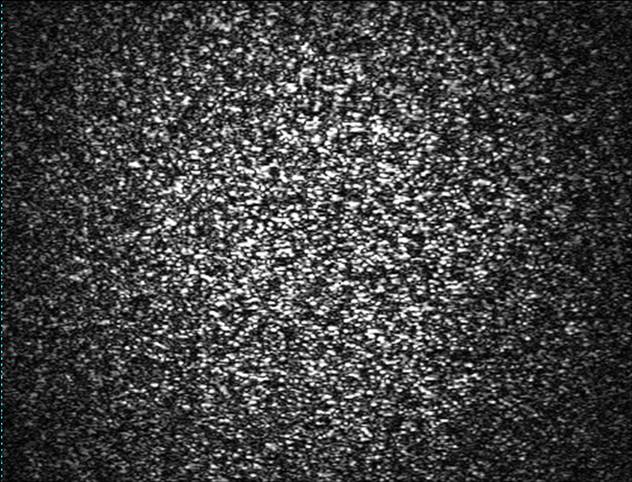
Figure 1. A Typical Speckle Pattern
The dark areas in the speckle pattern represent regions where the diffracted light from the particles arrives out of phase interfering destructively and the bright areas represent regions where the diffracted light arrives in phase interfering constructively.
In practice, particle samples are typically not stationary because they are suspended in a solution and as a result they are moving randomly due to collisions with solvent molecules. This type of motion is called Brownian Motion and it is vital for DLS analysis because it allows the use of the Stokes-Einstein equation to relate the velocity of a particle in solution to its hydrodynamic radius.1
\[D=\frac{kT}{6\pi \eta a} \nonumber \]
In the Stokes-Einstein equation, D is the diffusion velocity of the particle, k is the Boltzmann constant, T is the temperature, η is the viscosity of the solution and a is the hydrodynamic radius of the particle. The diffusion velocity (D) in the Stokes-Einstein relation is inversely proportional to the radius of the particle (a) and this shows that for a system undergoing Brownian Motion, small particles should diffuse faster than large ones. This is a key concept in DLS analysis.
In a sample of particles experiencing Brownian Motion, the distance between particles is constantly changing and this results in a Doppler Shift between the frequency of incoming light and the frequency of scattered light. Since the distance between particles affects the phase overlap of the diffracted light, the brightness of the spots on the speckle pattern will fluctuate in intensity as the particles change position with respect to each other. The rate of these intensity fluctuations depends on how fast the particles are moving and will therefore be slower for large particles and faster for small particles. This means that the fluctuating scattered light data contains information about the size of the particles.2
Collecting Data
In a typical DLS experiment, a suspension of analyte such as nanoparticles or polymer molecules is irradiated with monochromatic light from a laser while intensity of the diffracted light is measured. The detector is typically a photomultiplier positioned at 90° to the light source and it is used to collect light diffracted from the sample. Collimating lenses are used to focus laser light to the center of the sample holder and to prevent saturation of the photomultiplier tube.1

Ideally, the sample itself should be free of unwanted particles that could contribute to light scattering. For this reason dispersions are often filtered or purified before being measured. Samples are also diluted to low concentrations in order to prevent the particles from interacting with each other and disrupting Brownian Motion.
Processing Data
Since the fluctuating intensity data contains a wide spectrum of Doppler shifted frequencies it is not usually measured directly but instead it is compiled for processing using a device called a digital correlator. The function of the correlator in a DLS system is essentially to compare the intensity of two signals over a short period of time \(\tau\) (nanoseconds to microseconds) and to calculate the extent of similarity between the two signals using the correlation function. The electric field correlation function is defined mathematically as
\[G_{1}(t)=\lim_{t\to\infty}\frac{1}{T}\int_{-T}^{T}I(t)I(t+\tau )dt \nonumber \]
And is related to the intensity correlation function (G2) by the Siegart relationship
\[G_{2}(\tau )=1+\beta \left |G_{1}(\tau ) \right |^{2} \nonumber \]
where β is an experimental factor that is related to the angle of scattering in the DLS setup being used.
Consider the fluctuating intensities of the speckle pattern mentioned earlier. If the intensity signal at a location on a speckle pattern is compared to itself with no change in time (t) then the correlator will measure a perfect correlation and it will assign a value of 1. However, if the same intensity signal is compared with another signal a short time later (t+Δt) then the correlation has now diminished and the correlator will assign a value less than 1. With most speckle patterns the signal correlation drops to zero after 1-10 milliseconds so Δt, the time scale of measurements, must be on a faster time scale of nanoseconds to microseconds.1
Since these intensity fluctuations that are being measured are directly related to the movement of particles in solution, it is useful to recall the Stokes-Einstein relation above which shows that smaller particles move more quickly through solution than larger particles. This means that the intensity signal for smaller particles should fluctuate more rapidly than for larger particles and as a result the correlation decreases at a faster rate as seen in the figure below.
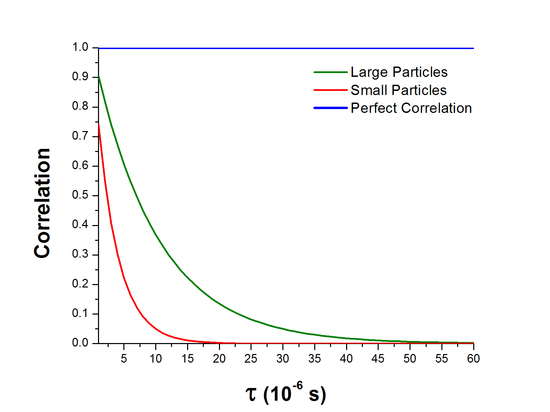
Figure 2. Exponential decay of the correlation function.
The correlation function for a system experiencing Brownian motion \(G(t)\) decays exponentially with decay constant \(\Gamma\).
\[G(t)=e^{-\Gamma t} \nonumber \]
\(\Gamma\) is related to the diffusivity of the particle by
\[\Gamma=-Dq^{^{2}} \nonumber \]
where
\[q=\frac{4\pi n }{\lambda}\sin(\dfrac{\Theta }{2}) \nonumber \]
References
- Dynamic Light Scattering Edited by Robert Pecora 1985. Plenum Press New York
- Foundations of Colloid Science Written by Robert J. Hunter 1987 Clarendon Press Oxford
- J.W Goodman, Some Fundamental Properties of Speckle, JOSA, Vol. 66, Issue 11, pp. 1145-1150 (1976)