
6.1C: Melting Point Theory
- Page ID
- 93433

\( \newcommand{\vecs}[1]{\overset { \scriptstyle \rightharpoonup} {\mathbf{#1}} } \)
\( \newcommand{\vecd}[1]{\overset{-\!-\!\rightharpoonup}{\vphantom{a}\smash {#1}}} \)
\( \newcommand{\id}{\mathrm{id}}\) \( \newcommand{\Span}{\mathrm{span}}\)
( \newcommand{\kernel}{\mathrm{null}\,}\) \( \newcommand{\range}{\mathrm{range}\,}\)
\( \newcommand{\RealPart}{\mathrm{Re}}\) \( \newcommand{\ImaginaryPart}{\mathrm{Im}}\)
\( \newcommand{\Argument}{\mathrm{Arg}}\) \( \newcommand{\norm}[1]{\| #1 \|}\)
\( \newcommand{\inner}[2]{\langle #1, #2 \rangle}\)
\( \newcommand{\Span}{\mathrm{span}}\)
\( \newcommand{\id}{\mathrm{id}}\)
\( \newcommand{\Span}{\mathrm{span}}\)
\( \newcommand{\kernel}{\mathrm{null}\,}\)
\( \newcommand{\range}{\mathrm{range}\,}\)
\( \newcommand{\RealPart}{\mathrm{Re}}\)
\( \newcommand{\ImaginaryPart}{\mathrm{Im}}\)
\( \newcommand{\Argument}{\mathrm{Arg}}\)
\( \newcommand{\norm}[1]{\| #1 \|}\)
\( \newcommand{\inner}[2]{\langle #1, #2 \rangle}\)
\( \newcommand{\Span}{\mathrm{span}}\) \( \newcommand{\AA}{\unicode[.8,0]{x212B}}\)
\( \newcommand{\vectorA}[1]{\vec{#1}} % arrow\)
\( \newcommand{\vectorAt}[1]{\vec{\text{#1}}} % arrow\)
\( \newcommand{\vectorB}[1]{\overset { \scriptstyle \rightharpoonup} {\mathbf{#1}} } \)
\( \newcommand{\vectorC}[1]{\textbf{#1}} \)
\( \newcommand{\vectorD}[1]{\overrightarrow{#1}} \)
\( \newcommand{\vectorDt}[1]{\overrightarrow{\text{#1}}} \)
\( \newcommand{\vectE}[1]{\overset{-\!-\!\rightharpoonup}{\vphantom{a}\smash{\mathbf {#1}}}} \)
\( \newcommand{\vecs}[1]{\overset { \scriptstyle \rightharpoonup} {\mathbf{#1}} } \)
\( \newcommand{\vecd}[1]{\overset{-\!-\!\rightharpoonup}{\vphantom{a}\smash {#1}}} \)
\(\newcommand{\avec}{\mathbf a}\) \(\newcommand{\bvec}{\mathbf b}\) \(\newcommand{\cvec}{\mathbf c}\) \(\newcommand{\dvec}{\mathbf d}\) \(\newcommand{\dtil}{\widetilde{\mathbf d}}\) \(\newcommand{\evec}{\mathbf e}\) \(\newcommand{\fvec}{\mathbf f}\) \(\newcommand{\nvec}{\mathbf n}\) \(\newcommand{\pvec}{\mathbf p}\) \(\newcommand{\qvec}{\mathbf q}\) \(\newcommand{\svec}{\mathbf s}\) \(\newcommand{\tvec}{\mathbf t}\) \(\newcommand{\uvec}{\mathbf u}\) \(\newcommand{\vvec}{\mathbf v}\) \(\newcommand{\wvec}{\mathbf w}\) \(\newcommand{\xvec}{\mathbf x}\) \(\newcommand{\yvec}{\mathbf y}\) \(\newcommand{\zvec}{\mathbf z}\) \(\newcommand{\rvec}{\mathbf r}\) \(\newcommand{\mvec}{\mathbf m}\) \(\newcommand{\zerovec}{\mathbf 0}\) \(\newcommand{\onevec}{\mathbf 1}\) \(\newcommand{\real}{\mathbb R}\) \(\newcommand{\twovec}[2]{\left[\begin{array}{r}#1 \\ #2 \end{array}\right]}\) \(\newcommand{\ctwovec}[2]{\left[\begin{array}{c}#1 \\ #2 \end{array}\right]}\) \(\newcommand{\threevec}[3]{\left[\begin{array}{r}#1 \\ #2 \\ #3 \end{array}\right]}\) \(\newcommand{\cthreevec}[3]{\left[\begin{array}{c}#1 \\ #2 \\ #3 \end{array}\right]}\) \(\newcommand{\fourvec}[4]{\left[\begin{array}{r}#1 \\ #2 \\ #3 \\ #4 \end{array}\right]}\) \(\newcommand{\cfourvec}[4]{\left[\begin{array}{c}#1 \\ #2 \\ #3 \\ #4 \end{array}\right]}\) \(\newcommand{\fivevec}[5]{\left[\begin{array}{r}#1 \\ #2 \\ #3 \\ #4 \\ #5 \\ \end{array}\right]}\) \(\newcommand{\cfivevec}[5]{\left[\begin{array}{c}#1 \\ #2 \\ #3 \\ #4 \\ #5 \\ \end{array}\right]}\) \(\newcommand{\mattwo}[4]{\left[\begin{array}{rr}#1 \amp #2 \\ #3 \amp #4 \\ \end{array}\right]}\) \(\newcommand{\laspan}[1]{\text{Span}\{#1\}}\) \(\newcommand{\bcal}{\cal B}\) \(\newcommand{\ccal}{\cal C}\) \(\newcommand{\scal}{\cal S}\) \(\newcommand{\wcal}{\cal W}\) \(\newcommand{\ecal}{\cal E}\) \(\newcommand{\coords}[2]{\left\{#1\right\}_{#2}}\) \(\newcommand{\gray}[1]{\color{gray}{#1}}\) \(\newcommand{\lgray}[1]{\color{lightgray}{#1}}\) \(\newcommand{\rank}{\operatorname{rank}}\) \(\newcommand{\row}{\text{Row}}\) \(\newcommand{\col}{\text{Col}}\) \(\renewcommand{\row}{\text{Row}}\) \(\newcommand{\nul}{\text{Nul}}\) \(\newcommand{\var}{\text{Var}}\) \(\newcommand{\corr}{\text{corr}}\) \(\newcommand{\len}[1]{\left|#1\right|}\) \(\newcommand{\bbar}{\overline{\bvec}}\) \(\newcommand{\bhat}{\widehat{\bvec}}\) \(\newcommand{\bperp}{\bvec^\perp}\) \(\newcommand{\xhat}{\widehat{\xvec}}\) \(\newcommand{\vhat}{\widehat{\vvec}}\) \(\newcommand{\uhat}{\widehat{\uvec}}\) \(\newcommand{\what}{\widehat{\wvec}}\) \(\newcommand{\Sighat}{\widehat{\Sigma}}\) \(\newcommand{\lt}{<}\) \(\newcommand{\gt}{>}\) \(\newcommand{\amp}{&}\) \(\definecolor{fillinmathshade}{gray}{0.9}\)Melting Point Diagrams
The typical behavior of an impure solid containing two components is summarized by the general phase diagram in Figure 6.7a. The furthest left side of the graph represents a sample that is pure compound "A," while the furthest right side of the graph represents a sample of pure compound "B." The lines mark the solid-liquid transition temperature (melting points). The melting point decreases the further the composition is from purity, toward the middle of the graph. In many mixtures, the minimum melting temperature for a mixture occurs at a certain composition of components, and is called the eutectic point (Figure 6.7a). Some systems do not have any eutectic points and some have multiple eutectic points.
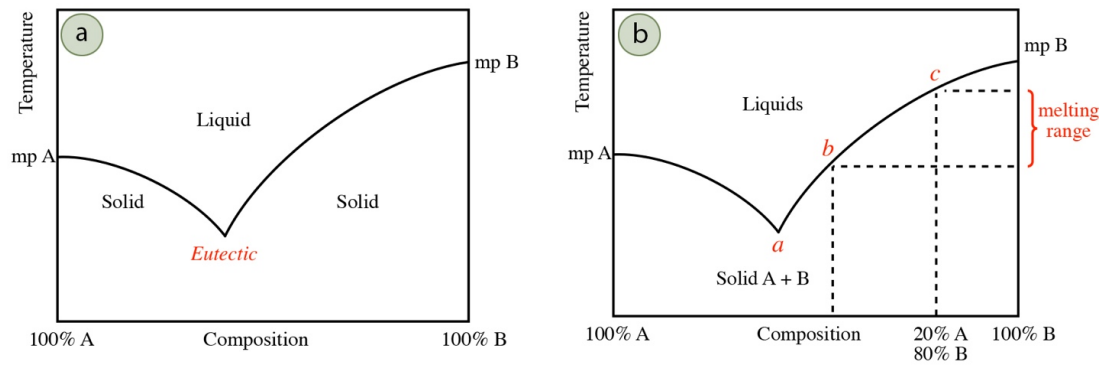
An impure solid is typically heterogeneous on the microscopic level, with pure regions of each component distributed through the bulk solid much like granite. When an impure solid is warmed, microscopic melting first occurs in a pure region by the component with the lower melting point (compound A in Figure 6.7a). This microscopic melting is not visible to the eye.
The preliminary melting of compound A in Figure 6.7a forms tiny pools of liquid that begin to dissolve compound B from the bulk solid. As compound B is dissolved into the melt (causing it to become more impure), the freezing point of this mixture is depressed. Compound B will continue to dissolve in the melt, until it reaches the eutectic composition (point a in Figure 6.7b), and the system will continue to melt at this composition until the entirety of the minor component (the impurity) is dissolved. Once the minor component is completely dissolved, further melting continues of the bulk component. This increases the purity of the melt, so the melting temperature increases somewhat. The system follows the melting line in Figure 6.7b either to the left or right of the eutectic temperature (depending on which side of the eutectic point is started), adjusting its melting temperature as the bulk component increases its concentration in the melt. This continues until the entire sample is melted.
Although microscopic melting begins at the eutectic temperature, the first value of the melting range (when a droplet of liquid is seen with the eye) is not necessarily recorded at this temperature. A droplet of liquid is not seen until approximately \(10\)-\(20\%\) of the sample has melted. Depending on the quantity of impurity, the system may have progressed far from the eutectic temperature (perhaps to point b in Figure 6.7b) before liquid becomes visible to the eye. The final value of the melting range is at the highest the melting point of the pure solid, but is often lower, reflecting the depressed melting point of the bulk solid. For example, a solid that is \(20\%\) compound A and \(80\%\) compound B would have a final melting temperature of point c in Figure 6.7b. The recorded melting range for this system would be at the maximum between temperatures a and c, but if the first droplet is seen at point b, the recorded melting range would be between temperatures b and c.
Impurities Effect on the Melting Point
A melting point is a useful indicator of purity as there is a general lowering and broadening of the melting range as impurities increase. In this section is described the theory behind the phenomenon of melting point depression (which is identical to freezing point depression since freezing and melting are the same processes in reverse) and why an impure sample has a broad melting range.
Melting Point Depression (Lowering the M. P.)
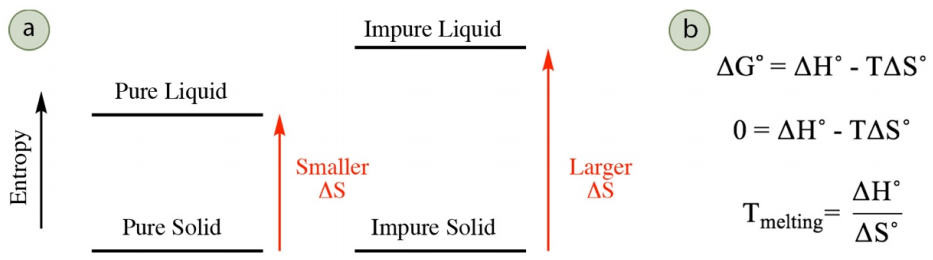
Melting of a pure solid occurs at a higher temperature than melting of an impure solid, a concept called melting point depression (or freezing point depression). The melting point is the temperature where the solid and liquid phases are in equilibrium with each other, and the change in free energy \(\left( \Delta G^\text{o} \right)\) for the process (solid \(\rightleftharpoons\) liquid) is zero. \(\Delta G^\text{o}\) is dependent on both the changes in enthalpy \(\left( \Delta H^\text{o} \right)\) and entropy \(\left( \Delta S^\text{o} \right)\) during the process (see versions of the Gibbs free energy equation in Figure 6.8b), but the changes in enthalpy are similar when melting a pure and impure solid as similar intermolecular forces are broken. Melting point depression is the result of different changes in entropy when melting a pure and impure solid.
As solids are restricted in atomic motion, there is little difference in entropy between a pure and impure solid. However, there is a more significant difference in entropy between a pure and impure liquid, and an impure liquid has greater disorder and greater entropy. Melting of an impure solid into an impure liquid therefore has a larger change in entropy than melting a pure solid into a pure liquid (Figure 6.8a). A larger change in entropy corresponds to a lower melting temperature. This can be rationalized either mathematically or conceptually. A mathematical description is in Figure 6.8b: as \(\Delta S^\text{o}\) is the denominator in the final equation, a larger \(\Delta S^\text{o}\) corresponds to a smaller \(T_\text{melting}\). A conceptual approach is to consider that melting occurs when the enthalpy \(\left( \Delta H^\text{o} \right)\) and entropy components \(\left( T \Delta S^\text{o} \right)\) are equal in magnitude (when \(\Delta G^\text{o} = 0\)). A larger \(\Delta S^\text{o}\) means that a smaller temperature will be required to "match" the enthalpy component.
Broadening of the Melting Point
The breadth of an experimentally determined melting point can often be correlated to the purity of the solid. Although all samples start melting at the eutectic temperature, the first droplet of liquid is not seen until approximately \(10\)-\(20\%\) of the sample has microscopically melted. As the melting temperature does not rise above the eutectic temperature until the entirety of the impurity has melted, the quantity of impurity will determine how far the system will have progressed along the melting point line in the phase diagram before reaching the visible minimum of \(10\)-\(20\%\) of solid.
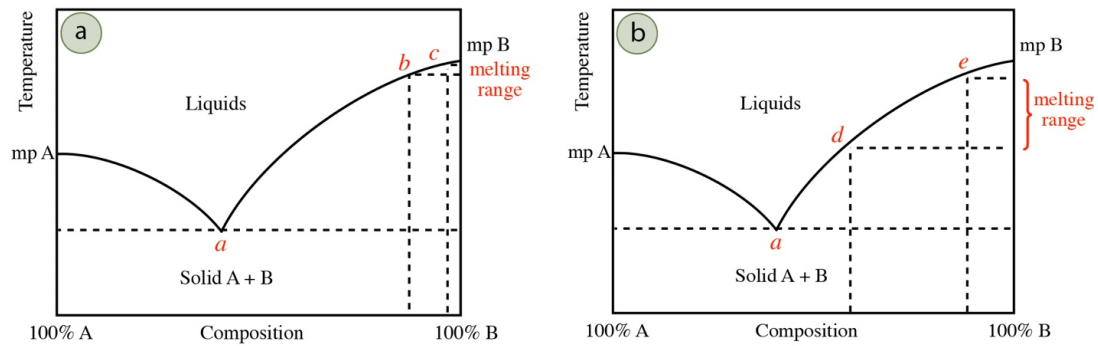
For example, if a solid has a minor amount of impurity, the impurity will quickly melt at the eutectic temperature (point a in Figure 6.9a), and the melting temperature will increase, following the melting point line in the phase diagram. When \(10\)-\(20\%\) of solid has melted and a droplet is visible, the system may have progressed far from the eutectic composition (perhaps to begin visibly melting at point b in Figure 6.9a). The solid will continue melting until perhaps point c in Figure 6.9a, to give a relatively narrow melting range (between points b and c). If instead the solid has a significant amount of impurity, it may take melting of nearly \(10\%\) of the solid to fully dissolve the impurity, which means the melting temperature may not have progressed far from the eutectic temperature when a droplet becomes visible. A more impure solid may first visibly melt at perhaps point d in Figure 6.9b, to give a broader melting range (between points d and e).
It is for these reasons that a low melting range \(\left( < 2^\text{o} \text{C} \right)\) is associated with purity, although it is also possible that the solid's composition could be coincidentally near a eutectic point. If the eutectic composition is, for example, \(40\%\) A/\(60\%\) B, and the solid's composition is \(45\%\) A/\(55\%\) B, nearly all of the impure solid will melt before the melting temperature will change from the eutectic temperature in the phase diagram. Therefore, mixtures with compositions near the eutectic composition also give a sharp melting range, even though they may be far from pure.
Whether a system is in fact pure, or sharply melting because it is at the eutectic composition, can be proven by performing a mixed melting point.