
4.4 The IR Spectrum
- Page ID
- 432181
\( \newcommand{\vecs}[1]{\overset { \scriptstyle \rightharpoonup} {\mathbf{#1}} } \)
\( \newcommand{\vecd}[1]{\overset{-\!-\!\rightharpoonup}{\vphantom{a}\smash {#1}}} \)
\( \newcommand{\dsum}{\displaystyle\sum\limits} \)
\( \newcommand{\dint}{\displaystyle\int\limits} \)
\( \newcommand{\dlim}{\displaystyle\lim\limits} \)
\( \newcommand{\id}{\mathrm{id}}\) \( \newcommand{\Span}{\mathrm{span}}\)
( \newcommand{\kernel}{\mathrm{null}\,}\) \( \newcommand{\range}{\mathrm{range}\,}\)
\( \newcommand{\RealPart}{\mathrm{Re}}\) \( \newcommand{\ImaginaryPart}{\mathrm{Im}}\)
\( \newcommand{\Argument}{\mathrm{Arg}}\) \( \newcommand{\norm}[1]{\| #1 \|}\)
\( \newcommand{\inner}[2]{\langle #1, #2 \rangle}\)
\( \newcommand{\Span}{\mathrm{span}}\)
\( \newcommand{\id}{\mathrm{id}}\)
\( \newcommand{\Span}{\mathrm{span}}\)
\( \newcommand{\kernel}{\mathrm{null}\,}\)
\( \newcommand{\range}{\mathrm{range}\,}\)
\( \newcommand{\RealPart}{\mathrm{Re}}\)
\( \newcommand{\ImaginaryPart}{\mathrm{Im}}\)
\( \newcommand{\Argument}{\mathrm{Arg}}\)
\( \newcommand{\norm}[1]{\| #1 \|}\)
\( \newcommand{\inner}[2]{\langle #1, #2 \rangle}\)
\( \newcommand{\Span}{\mathrm{span}}\) \( \newcommand{\AA}{\unicode[.8,0]{x212B}}\)
\( \newcommand{\vectorA}[1]{\vec{#1}} % arrow\)
\( \newcommand{\vectorAt}[1]{\vec{\text{#1}}} % arrow\)
\( \newcommand{\vectorB}[1]{\overset { \scriptstyle \rightharpoonup} {\mathbf{#1}} } \)
\( \newcommand{\vectorC}[1]{\textbf{#1}} \)
\( \newcommand{\vectorD}[1]{\overrightarrow{#1}} \)
\( \newcommand{\vectorDt}[1]{\overrightarrow{\text{#1}}} \)
\( \newcommand{\vectE}[1]{\overset{-\!-\!\rightharpoonup}{\vphantom{a}\smash{\mathbf {#1}}}} \)
\( \newcommand{\vecs}[1]{\overset { \scriptstyle \rightharpoonup} {\mathbf{#1}} } \)
\(\newcommand{\longvect}{\overrightarrow}\)
\( \newcommand{\vecd}[1]{\overset{-\!-\!\rightharpoonup}{\vphantom{a}\smash {#1}}} \)
\(\newcommand{\avec}{\mathbf a}\) \(\newcommand{\bvec}{\mathbf b}\) \(\newcommand{\cvec}{\mathbf c}\) \(\newcommand{\dvec}{\mathbf d}\) \(\newcommand{\dtil}{\widetilde{\mathbf d}}\) \(\newcommand{\evec}{\mathbf e}\) \(\newcommand{\fvec}{\mathbf f}\) \(\newcommand{\nvec}{\mathbf n}\) \(\newcommand{\pvec}{\mathbf p}\) \(\newcommand{\qvec}{\mathbf q}\) \(\newcommand{\svec}{\mathbf s}\) \(\newcommand{\tvec}{\mathbf t}\) \(\newcommand{\uvec}{\mathbf u}\) \(\newcommand{\vvec}{\mathbf v}\) \(\newcommand{\wvec}{\mathbf w}\) \(\newcommand{\xvec}{\mathbf x}\) \(\newcommand{\yvec}{\mathbf y}\) \(\newcommand{\zvec}{\mathbf z}\) \(\newcommand{\rvec}{\mathbf r}\) \(\newcommand{\mvec}{\mathbf m}\) \(\newcommand{\zerovec}{\mathbf 0}\) \(\newcommand{\onevec}{\mathbf 1}\) \(\newcommand{\real}{\mathbb R}\) \(\newcommand{\twovec}[2]{\left[\begin{array}{r}#1 \\ #2 \end{array}\right]}\) \(\newcommand{\ctwovec}[2]{\left[\begin{array}{c}#1 \\ #2 \end{array}\right]}\) \(\newcommand{\threevec}[3]{\left[\begin{array}{r}#1 \\ #2 \\ #3 \end{array}\right]}\) \(\newcommand{\cthreevec}[3]{\left[\begin{array}{c}#1 \\ #2 \\ #3 \end{array}\right]}\) \(\newcommand{\fourvec}[4]{\left[\begin{array}{r}#1 \\ #2 \\ #3 \\ #4 \end{array}\right]}\) \(\newcommand{\cfourvec}[4]{\left[\begin{array}{c}#1 \\ #2 \\ #3 \\ #4 \end{array}\right]}\) \(\newcommand{\fivevec}[5]{\left[\begin{array}{r}#1 \\ #2 \\ #3 \\ #4 \\ #5 \\ \end{array}\right]}\) \(\newcommand{\cfivevec}[5]{\left[\begin{array}{c}#1 \\ #2 \\ #3 \\ #4 \\ #5 \\ \end{array}\right]}\) \(\newcommand{\mattwo}[4]{\left[\begin{array}{rr}#1 \amp #2 \\ #3 \amp #4 \\ \end{array}\right]}\) \(\newcommand{\laspan}[1]{\text{Span}\{#1\}}\) \(\newcommand{\bcal}{\cal B}\) \(\newcommand{\ccal}{\cal C}\) \(\newcommand{\scal}{\cal S}\) \(\newcommand{\wcal}{\cal W}\) \(\newcommand{\ecal}{\cal E}\) \(\newcommand{\coords}[2]{\left\{#1\right\}_{#2}}\) \(\newcommand{\gray}[1]{\color{gray}{#1}}\) \(\newcommand{\lgray}[1]{\color{lightgray}{#1}}\) \(\newcommand{\rank}{\operatorname{rank}}\) \(\newcommand{\row}{\text{Row}}\) \(\newcommand{\col}{\text{Col}}\) \(\renewcommand{\row}{\text{Row}}\) \(\newcommand{\nul}{\text{Nul}}\) \(\newcommand{\var}{\text{Var}}\) \(\newcommand{\corr}{\text{corr}}\) \(\newcommand{\len}[1]{\left|#1\right|}\) \(\newcommand{\bbar}{\overline{\bvec}}\) \(\newcommand{\bhat}{\widehat{\bvec}}\) \(\newcommand{\bperp}{\bvec^\perp}\) \(\newcommand{\xhat}{\widehat{\xvec}}\) \(\newcommand{\vhat}{\widehat{\vvec}}\) \(\newcommand{\uhat}{\widehat{\uvec}}\) \(\newcommand{\what}{\widehat{\wvec}}\) \(\newcommand{\Sighat}{\widehat{\Sigma}}\) \(\newcommand{\lt}{<}\) \(\newcommand{\gt}{>}\) \(\newcommand{\amp}{&}\) \(\definecolor{fillinmathshade}{gray}{0.9}\)After completing this section, you should be able to:
- understand the idea behind why peaks fall at particular wavelengths
- begin to figure out which peaks
The IR spectrum is a graph where the x-axis is frequency and is labeled as wavenumber (cm-1). The y-axis is the amount of light absorbed and labeled as Transmittance (%). This is measuring how much light has been transmitted at a particular frequency. In other words, if all of the light is detected, then the molecule has absorbed no light at that frequency. If you run your finger along the baseline, which is at the top of the spectrum, you can tell when light has been absorbed due to a dip in the line. The dips are actually called peaks. In the theory section of this chapter, it was discussed that different types of bonds will absorb at different frequencies. Below is an IR spectrum of pentane.

Now that we have oriented ourselves with what an IR spectrum looks like, let's think back to the theory of IR spectroscopy and begin to understand why peaks appear as they do.
Origin of Peak Positions, Intensities, and Widths
Peak Positions
The equation below gives the frequency of light that a molecule will absorb, and gives the frequency of vibration of the normal mode excited by that light.
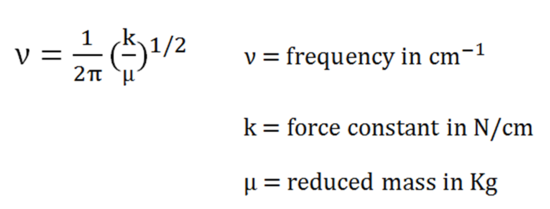
There are two variables in the above equation - a chemical bond's force constant and reduced mass. Here, the reduced mass refers to (M1M2)/(M1+M2) where M1 and M2 are the masses of the two atoms in the vibrating bond, respectively. These two molecular properties determine the wavenumber at which a molecule will absorb infrared light. No two chemical substances in the universe have the same force constants and atomic masses, which is why the infrared spectrum of each chemical substance is unique. To understand the effect of atomic masses and force constant on the positions of infrared bands, table 1 and 2 are shown as an example, respectively.
| Bond | C-H Stretch in cm-1 |
| C-1H | ~3000 |
| C-2D | ~2120 |
In this example, the force constant remains the same, while the reduced masses of C-1H and C-2D are different. Remember, deuterium is one of the isotopes of hydrogen - 2H (or 2D). Here, we simply doubled the mass of the hydrogen atom, the carbon-hydrogen stretching vibration is reduced by over 800 cm-1. Mass is inversely proportional to the wavenumber.
Table 2. An Example of a Bond Strength Effect
| Bond | C-H Stretch in cm-1 |
| Csp3-H | ~3000 |
| Csp2-H | ~3100 |
| Csp-H | ~3330 |
In this example, the reduced mass remains the same, while the force constant changes. Here, we can see that as we increase the strength of the bond (or increase the force constant), the wavenumber increase. Therefore, force constant is proportional to the frequency.
The Origin of Peak Intensities
The different vibrations of the different functional groups in the molecule give rise to bands of differing intensity. This is because \( \frac{\partial \mu}{\partial x}\) is different for each of these vibrations. For example, the most intense band in the spectrum of pentane shown above is at 2958 cm-1 and is due to stretching of the C-H bond. One of the weaker bands in the spectrum of pentane is at 727 cm-1, and it is due to long-chain methyl rock of the carbon-carbon bonds in pentane. The change in dipole moment with respect to distance for the C-H stretching is greater than that for the C-C rock vibration, which is why the C-H stretching band is the more intense than C-C rock vibration.
Another factor that determines the peak intensity in infrared spectra is the concentration of molecules in the sample. The equation below that relates concentration to absorbance is Beer's law,
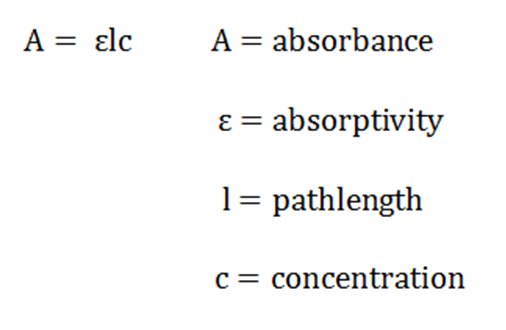
The absorptivity is the proportionality constant between concentration and absorbance. The absorptivity is an absolute measure of infrared absorbance intensity for a specific molecule at a specific wavenumber.
The Origin of Peak Widths
In general, the width of infrared bands for solid and liquid samples is determined by the number of chemical environments which is related to the strength of intermolecular interactions such as hydrogen bonding. The figure below shows hydrogen bond in water molecules and these water molecules are in different chemical environments. Because the number and strength of hydrogen bonds differs with chemical environment, the force constant varies and the wavenumber differs at which these molecules absorb infrared light.
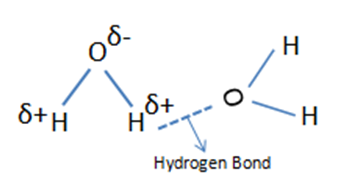
In any sample where hydrogen bonding occurs, the number and strength of intermolecular interactions varies greatly within the sample, causing the bands in these samples to be particularly broad. This is common in alcohols and carboxylic acids. When intermolecular interactions are weak, the number of chemical environments is small, and narrow infrared bands are observed.
The Origin of Group Frequencies
An important observation made by early researchers is that many functional group absorb infrared radiation at about the same wavenumber, regardless of the structure of the rest of the molecule. For example, C-H stretching vibrations usually appear between 3300 and 2800 cm-1 and carbonyl (C=O) stretching vibrations usually appear between 1800 and 1600 cm-1. This makes these bands diagnostic markers for the presence of a functional group in a sample. These types of infrared bands are called group frequencies because they tell us about the presence or absence of specific functional groups in a sample.
.gif?revision=1)
The region of the infrared spectrum from 1200 to 700 cm-1 is called the fingerprint region. This region is notable for the large number of infrared bands that are found there. Many different vibrations, including C-O, C-C and C-N single bond stretches, C-H bending vibrations, and some bands due to benzene rings are found in this region. The fingerprint region is often the most complex and confusing region to interpret, and is usually the last section of a spectrum to be interpreted. However, the utility of the fingerprint region is that the many bands there provide a fingerprint for a molecule.
Why do carbon-nitrogen triple bonds appear at a higher wavenumber than carbon-nitrogen double bonds?
- Answer
-
If we look at the equation for frequency, there are two variables. The reduced mass and the bond strength. In this case, our reduced mass will remain the same because we are looking at bonds with the same atoms attached - carbon and nitrogen. The difference is bond strength. A triple bond is a stronger bond than a double bond. Bond strength and frequency are proportional to each other, so the stronger the bond, the larger the wavenumber.
Would you expect the C=O bond to have a more intense or less intense peak?
- Answer
-
Since there is a greater dipole change in the C=O bond stretch, this will lead to a more intense peak.
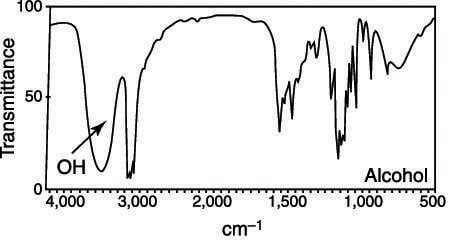
Alcohols typically show up as a very wide broad (3322 cm-1) as can be seen in the figure below. Why does the peak show up as broad?
- Answer
-
The width of infrared bands for solid and liquid samples is determined by the number of chemical environments which is related to the strength of intermolecular interactions such as hydrogen bonding. Alcohols have the ability to hydrogen bond, which creates the broad band.