
5.1: COSY Spectra
- Page ID
- 189775

\( \newcommand{\vecs}[1]{\overset { \scriptstyle \rightharpoonup} {\mathbf{#1}} } \)
\( \newcommand{\vecd}[1]{\overset{-\!-\!\rightharpoonup}{\vphantom{a}\smash {#1}}} \)
\( \newcommand{\dsum}{\displaystyle\sum\limits} \)
\( \newcommand{\dint}{\displaystyle\int\limits} \)
\( \newcommand{\dlim}{\displaystyle\lim\limits} \)
\( \newcommand{\id}{\mathrm{id}}\) \( \newcommand{\Span}{\mathrm{span}}\)
( \newcommand{\kernel}{\mathrm{null}\,}\) \( \newcommand{\range}{\mathrm{range}\,}\)
\( \newcommand{\RealPart}{\mathrm{Re}}\) \( \newcommand{\ImaginaryPart}{\mathrm{Im}}\)
\( \newcommand{\Argument}{\mathrm{Arg}}\) \( \newcommand{\norm}[1]{\| #1 \|}\)
\( \newcommand{\inner}[2]{\langle #1, #2 \rangle}\)
\( \newcommand{\Span}{\mathrm{span}}\)
\( \newcommand{\id}{\mathrm{id}}\)
\( \newcommand{\Span}{\mathrm{span}}\)
\( \newcommand{\kernel}{\mathrm{null}\,}\)
\( \newcommand{\range}{\mathrm{range}\,}\)
\( \newcommand{\RealPart}{\mathrm{Re}}\)
\( \newcommand{\ImaginaryPart}{\mathrm{Im}}\)
\( \newcommand{\Argument}{\mathrm{Arg}}\)
\( \newcommand{\norm}[1]{\| #1 \|}\)
\( \newcommand{\inner}[2]{\langle #1, #2 \rangle}\)
\( \newcommand{\Span}{\mathrm{span}}\) \( \newcommand{\AA}{\unicode[.8,0]{x212B}}\)
\( \newcommand{\vectorA}[1]{\vec{#1}} % arrow\)
\( \newcommand{\vectorAt}[1]{\vec{\text{#1}}} % arrow\)
\( \newcommand{\vectorB}[1]{\overset { \scriptstyle \rightharpoonup} {\mathbf{#1}} } \)
\( \newcommand{\vectorC}[1]{\textbf{#1}} \)
\( \newcommand{\vectorD}[1]{\overrightarrow{#1}} \)
\( \newcommand{\vectorDt}[1]{\overrightarrow{\text{#1}}} \)
\( \newcommand{\vectE}[1]{\overset{-\!-\!\rightharpoonup}{\vphantom{a}\smash{\mathbf {#1}}}} \)
\( \newcommand{\vecs}[1]{\overset { \scriptstyle \rightharpoonup} {\mathbf{#1}} } \)
\(\newcommand{\longvect}{\overrightarrow}\)
\( \newcommand{\vecd}[1]{\overset{-\!-\!\rightharpoonup}{\vphantom{a}\smash {#1}}} \)
\(\newcommand{\avec}{\mathbf a}\) \(\newcommand{\bvec}{\mathbf b}\) \(\newcommand{\cvec}{\mathbf c}\) \(\newcommand{\dvec}{\mathbf d}\) \(\newcommand{\dtil}{\widetilde{\mathbf d}}\) \(\newcommand{\evec}{\mathbf e}\) \(\newcommand{\fvec}{\mathbf f}\) \(\newcommand{\nvec}{\mathbf n}\) \(\newcommand{\pvec}{\mathbf p}\) \(\newcommand{\qvec}{\mathbf q}\) \(\newcommand{\svec}{\mathbf s}\) \(\newcommand{\tvec}{\mathbf t}\) \(\newcommand{\uvec}{\mathbf u}\) \(\newcommand{\vvec}{\mathbf v}\) \(\newcommand{\wvec}{\mathbf w}\) \(\newcommand{\xvec}{\mathbf x}\) \(\newcommand{\yvec}{\mathbf y}\) \(\newcommand{\zvec}{\mathbf z}\) \(\newcommand{\rvec}{\mathbf r}\) \(\newcommand{\mvec}{\mathbf m}\) \(\newcommand{\zerovec}{\mathbf 0}\) \(\newcommand{\onevec}{\mathbf 1}\) \(\newcommand{\real}{\mathbb R}\) \(\newcommand{\twovec}[2]{\left[\begin{array}{r}#1 \\ #2 \end{array}\right]}\) \(\newcommand{\ctwovec}[2]{\left[\begin{array}{c}#1 \\ #2 \end{array}\right]}\) \(\newcommand{\threevec}[3]{\left[\begin{array}{r}#1 \\ #2 \\ #3 \end{array}\right]}\) \(\newcommand{\cthreevec}[3]{\left[\begin{array}{c}#1 \\ #2 \\ #3 \end{array}\right]}\) \(\newcommand{\fourvec}[4]{\left[\begin{array}{r}#1 \\ #2 \\ #3 \\ #4 \end{array}\right]}\) \(\newcommand{\cfourvec}[4]{\left[\begin{array}{c}#1 \\ #2 \\ #3 \\ #4 \end{array}\right]}\) \(\newcommand{\fivevec}[5]{\left[\begin{array}{r}#1 \\ #2 \\ #3 \\ #4 \\ #5 \\ \end{array}\right]}\) \(\newcommand{\cfivevec}[5]{\left[\begin{array}{c}#1 \\ #2 \\ #3 \\ #4 \\ #5 \\ \end{array}\right]}\) \(\newcommand{\mattwo}[4]{\left[\begin{array}{rr}#1 \amp #2 \\ #3 \amp #4 \\ \end{array}\right]}\) \(\newcommand{\laspan}[1]{\text{Span}\{#1\}}\) \(\newcommand{\bcal}{\cal B}\) \(\newcommand{\ccal}{\cal C}\) \(\newcommand{\scal}{\cal S}\) \(\newcommand{\wcal}{\cal W}\) \(\newcommand{\ecal}{\cal E}\) \(\newcommand{\coords}[2]{\left\{#1\right\}_{#2}}\) \(\newcommand{\gray}[1]{\color{gray}{#1}}\) \(\newcommand{\lgray}[1]{\color{lightgray}{#1}}\) \(\newcommand{\rank}{\operatorname{rank}}\) \(\newcommand{\row}{\text{Row}}\) \(\newcommand{\col}{\text{Col}}\) \(\renewcommand{\row}{\text{Row}}\) \(\newcommand{\nul}{\text{Nul}}\) \(\newcommand{\var}{\text{Var}}\) \(\newcommand{\corr}{\text{corr}}\) \(\newcommand{\len}[1]{\left|#1\right|}\) \(\newcommand{\bbar}{\overline{\bvec}}\) \(\newcommand{\bhat}{\widehat{\bvec}}\) \(\newcommand{\bperp}{\bvec^\perp}\) \(\newcommand{\xhat}{\widehat{\xvec}}\) \(\newcommand{\vhat}{\widehat{\vvec}}\) \(\newcommand{\uhat}{\widehat{\uvec}}\) \(\newcommand{\what}{\widehat{\wvec}}\) \(\newcommand{\Sighat}{\widehat{\Sigma}}\) \(\newcommand{\lt}{<}\) \(\newcommand{\gt}{>}\) \(\newcommand{\amp}{&}\) \(\definecolor{fillinmathshade}{gray}{0.9}\)In 2D NMR, correlation peaks are used to help establish the structure.
Let's start with a simple compound, ethyl acetate.
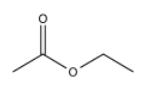
The 1H NMR spectrum is not very complicated.
In homonuclear correlation spectroscopy (COSY), we can look for hydrogens that are coupled to each other. In ethyl acetate, it's pretty clear where they are. There is a quartet and a triplet; the hydrogens corresponding to those two peaks are probably beside each other in the structure.
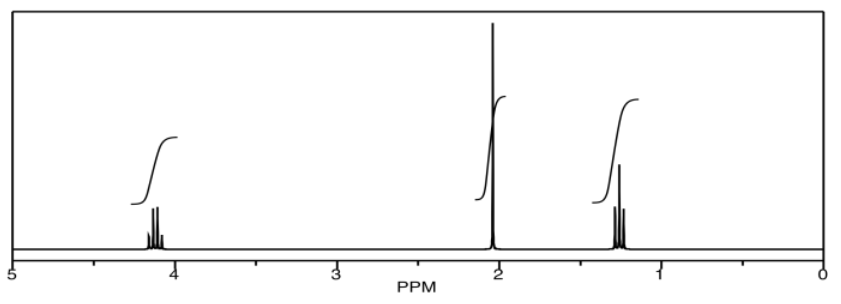
The COSY spectrum simply takes that 1H spectrum and spreads it out into two dimensions. Instead of being displayed as a row of peaks, the peaks are spread out into an array. In the following simulated COSY spectrum, the peaks are displayed along one axis. The same peaks are also displayed along the other axis. In the middle of the plot, the peaks are shown plotted against each other -- that is, there is a peak at 1.25 ppm on the y axis and along the x axis, so there is a data point on the plot at (1.25, 1.25). Other such peaks appear along the diagonal stretching from the upper right to the lower left through the middle of the plot. There are three peaks appearing along that diagonal line; these three peaks basically show us what we already saw in the regular 1H NMR spectrum.
The interesting peaks are the ones that do not appear along the diagonal. Those peaks indicate which hydrogens are coupled to which other hydrogens. The hydrogens at 1.25 ppm are coupled to the ones at 4.2 ppm, and that gives a "cross-peak" at (1.25, 4.20). There is also a cross-peak at (4.20, 1.25), because that relationship goes both ways.
What does it mean to be coupled? It means that magnetic information is transmitted between the atoms. How can we tell? Essentially, we can send a pulse of electromagnetic radiation into one set of hydrogens and look for a response somewhere else. Of course, if we send a pulse of radio waves at a frequency that will be absorbed by a particular hydrogen, we will see a response in that hydrogen itself. That's why we see the peaks on the diagonal. However, we also see responses from other hydrogens that are magnetically linked to the original one.
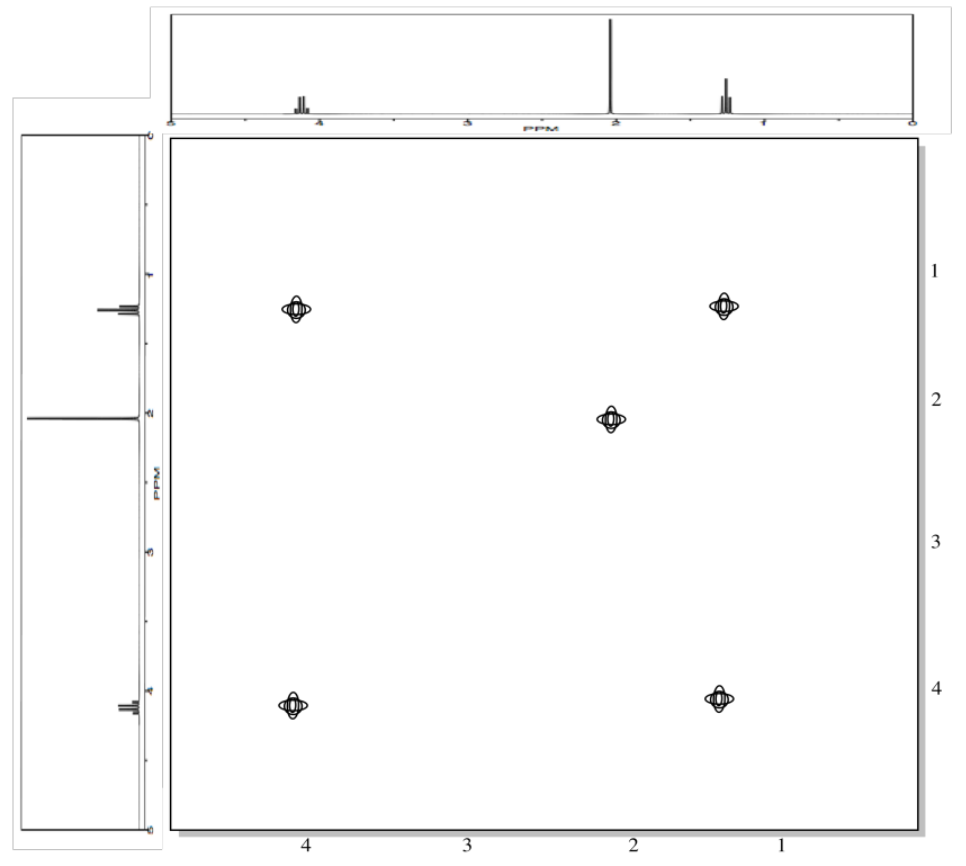
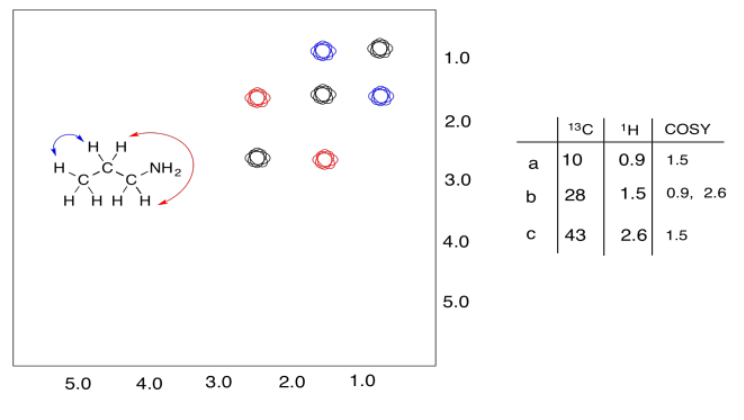
A second example is shown below. This time, the compound is propanamine. In propanamine, there would again be a diagonal set of peaks, shown in black, corresponding to the peaks in the regular proton spectrum. In addition, two different sets of protons are coupled. The methyl group is coupled to the methylene in the middle of the molecule; that cross-peak is shown in blue. The methylene in the middle is also coupled to the methylene next to the nitrogen; that cross-peak is shown in red.
Exercise \(\PageIndex{1}\)
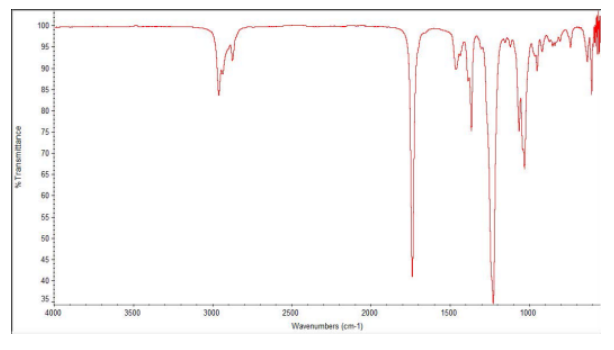
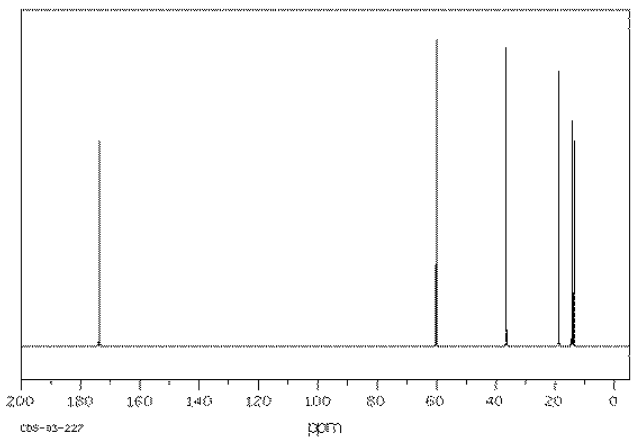
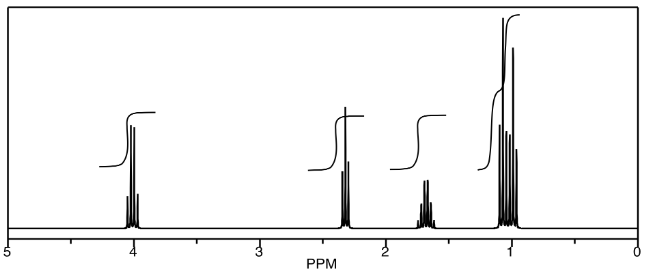
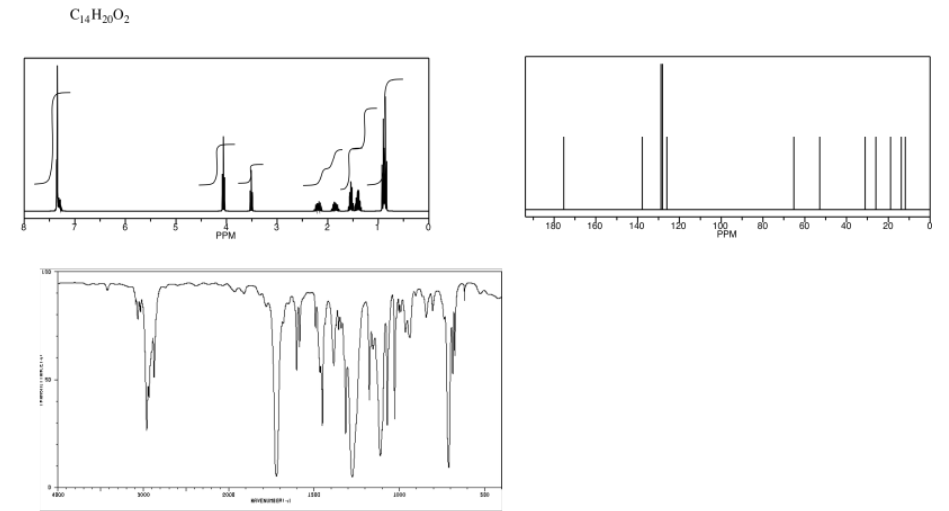
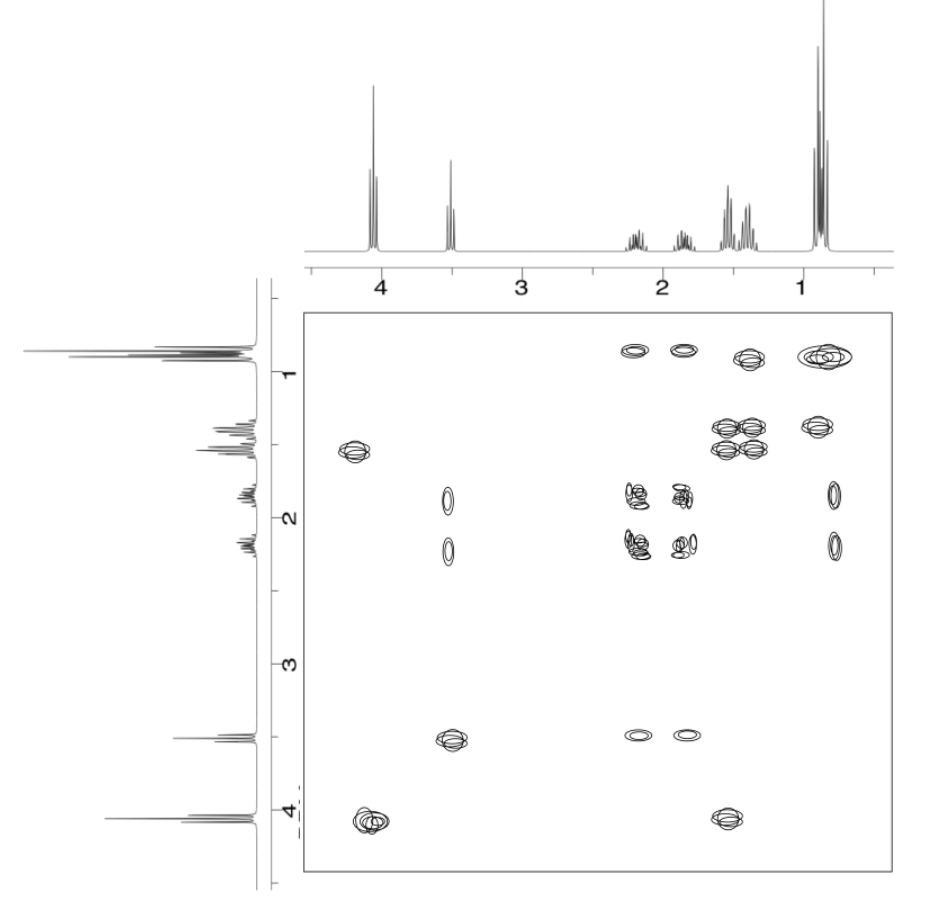
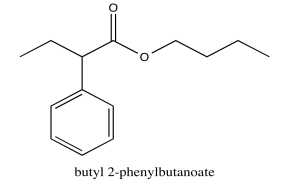
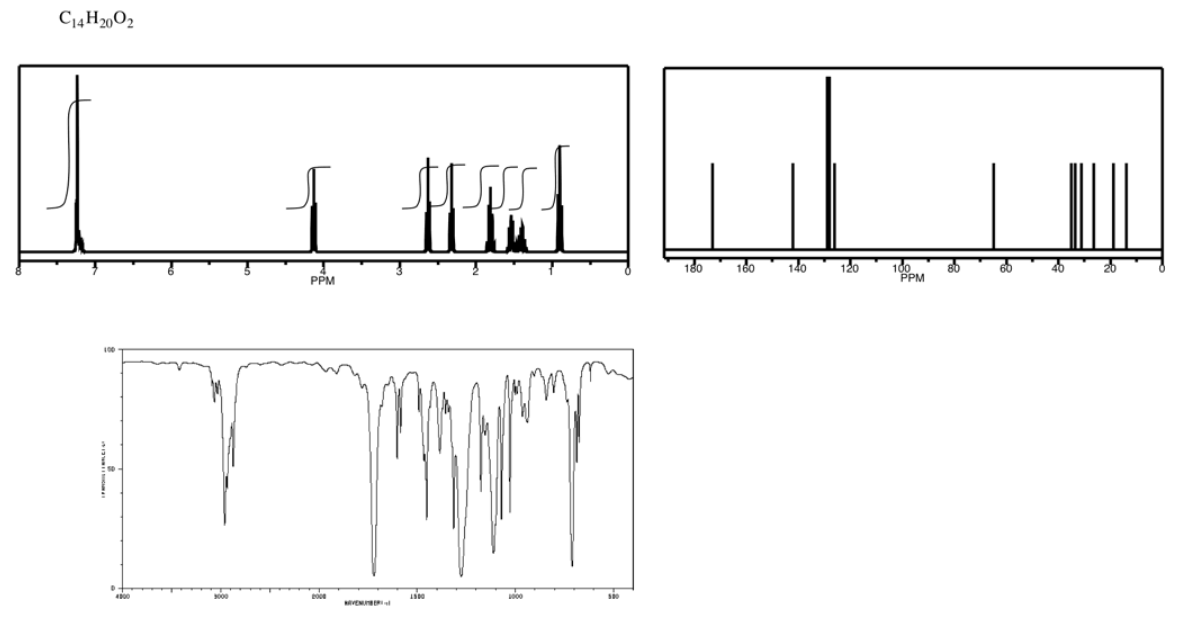
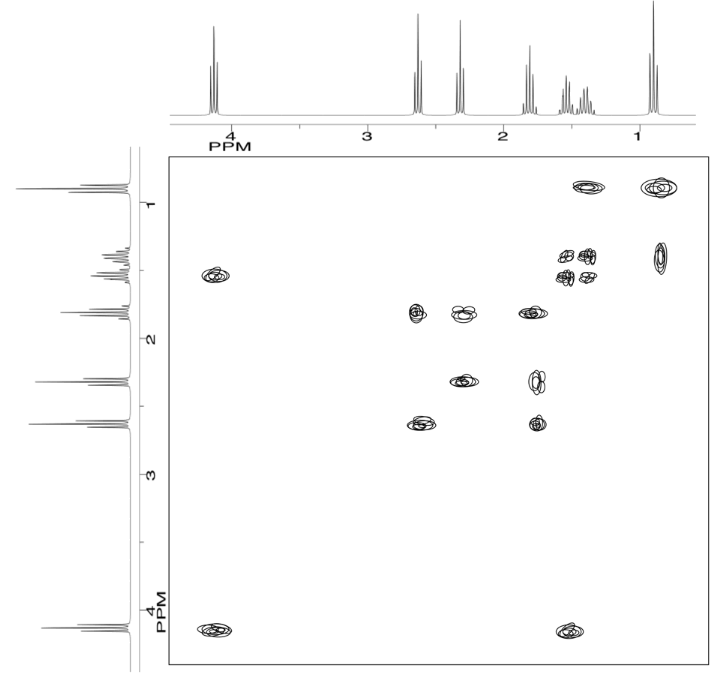
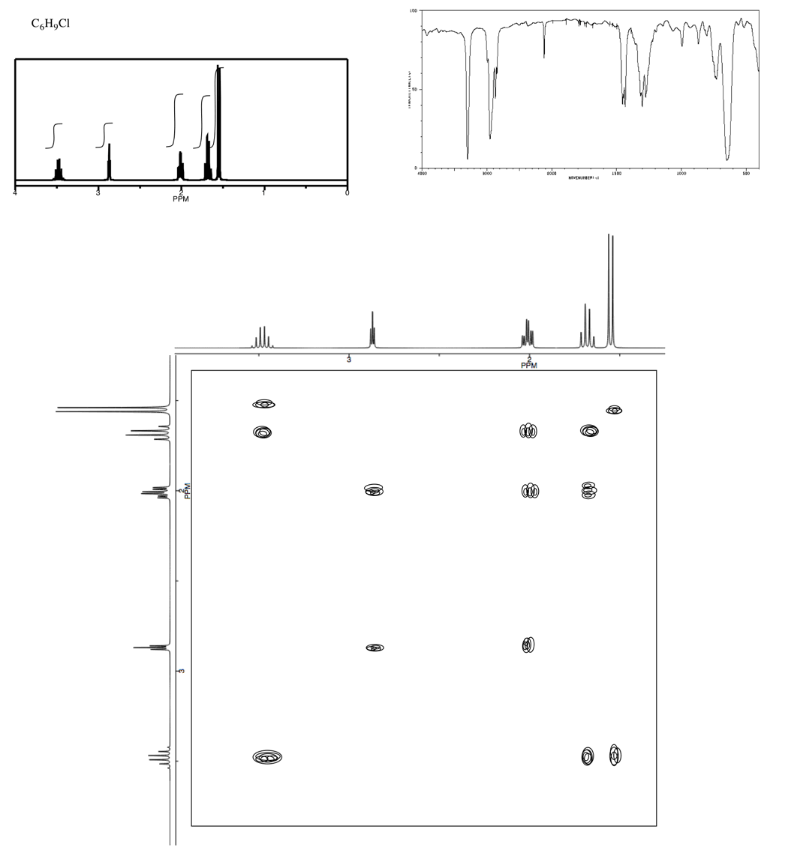
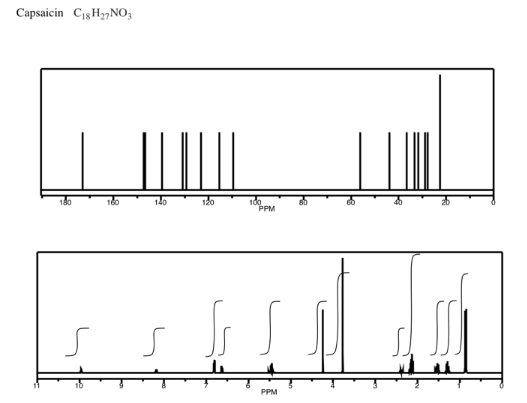
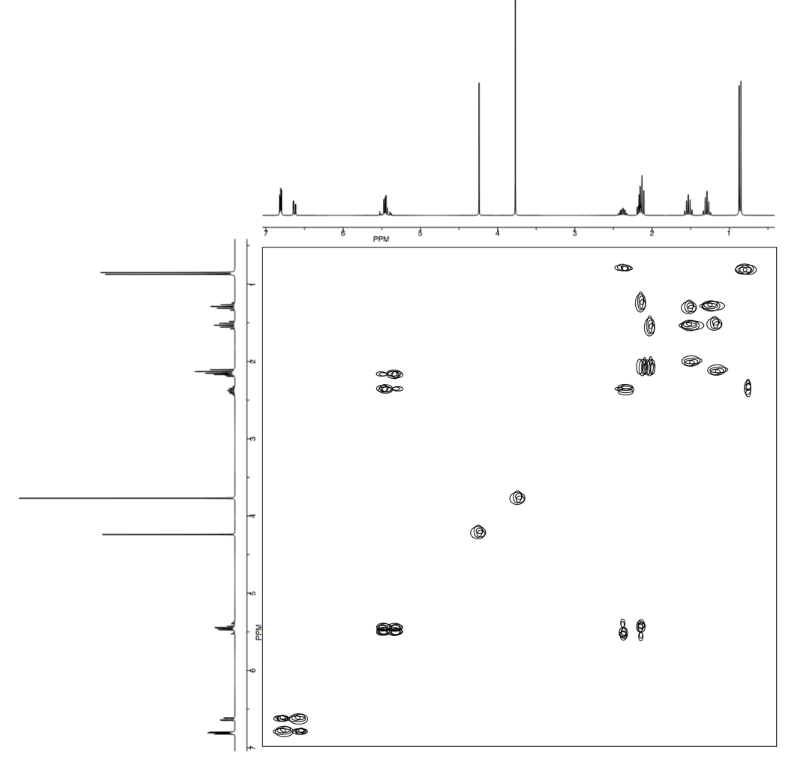
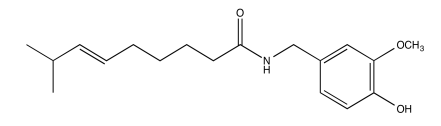
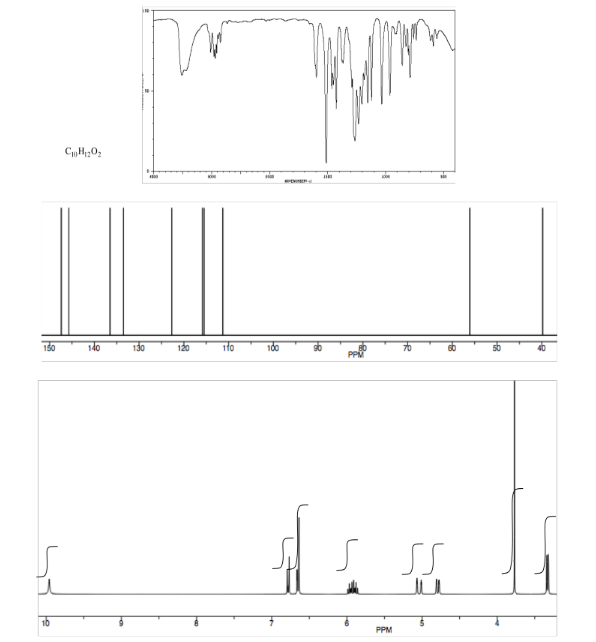
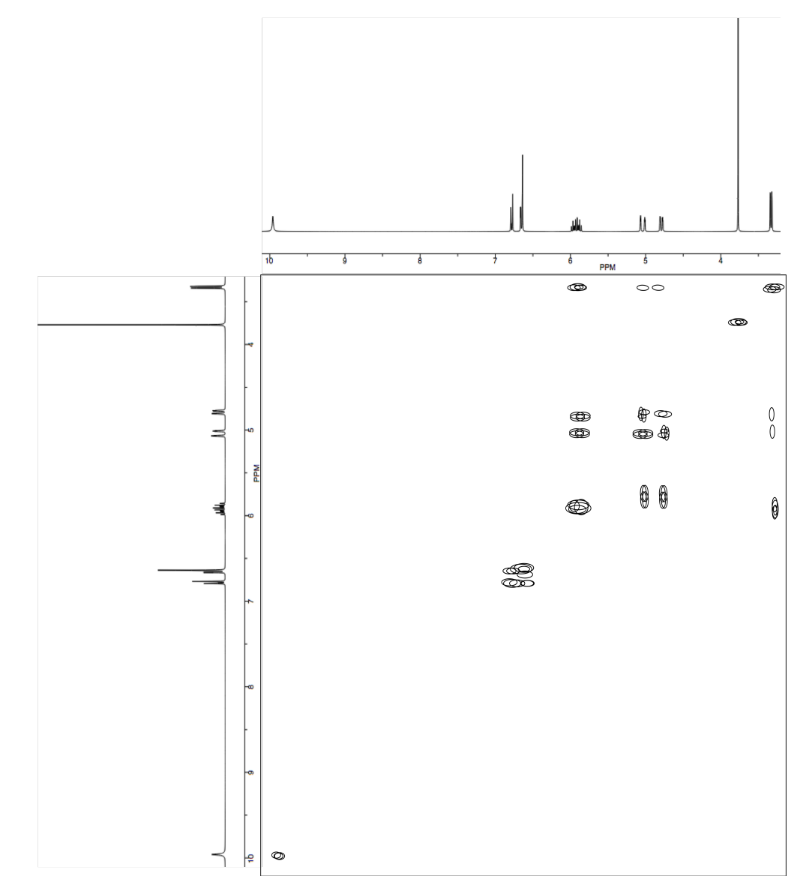
Provide analyses of the following spectra and propose a structure for the compound.

- Answer
-
ethyl butanoate
Exercise \(\PageIndex{2}\)
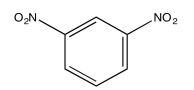
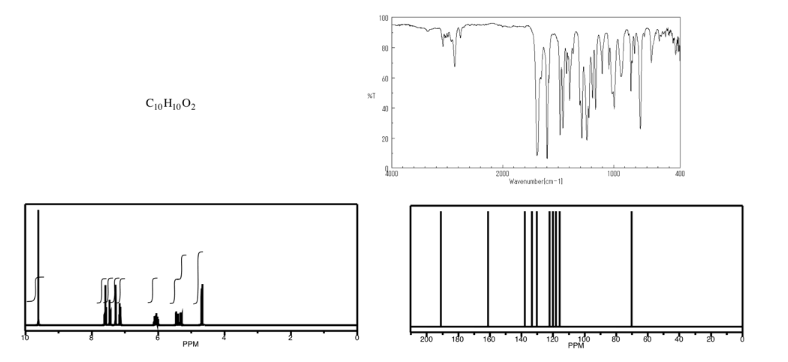
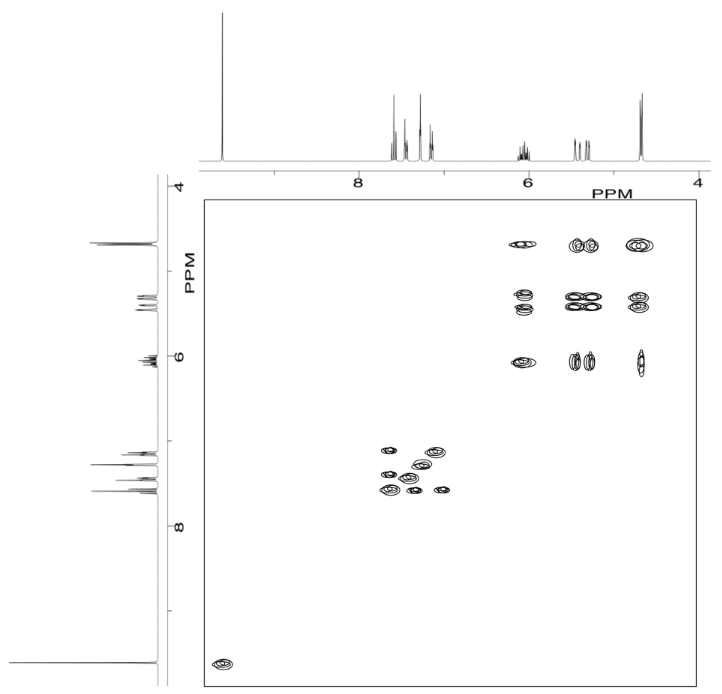
The following COSY spectrum is for an isomer of dinitrobenzene. Which isomer is it?
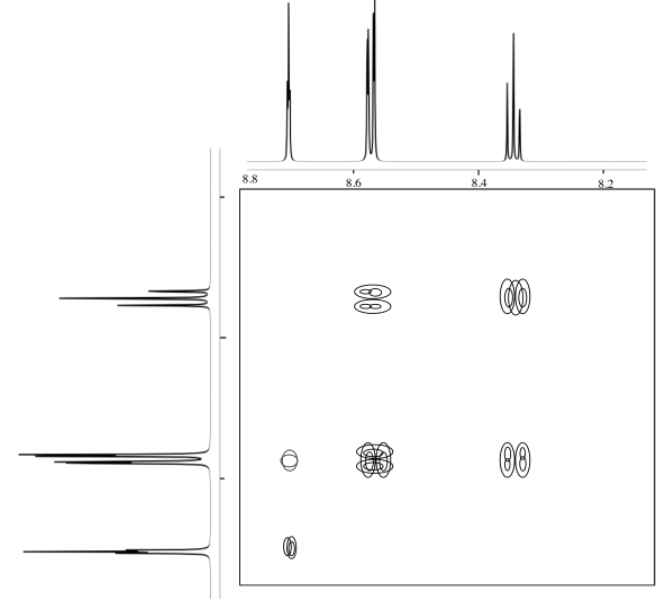
- Answer
-
Exercise \(\PageIndex{3}\)
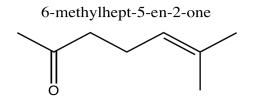
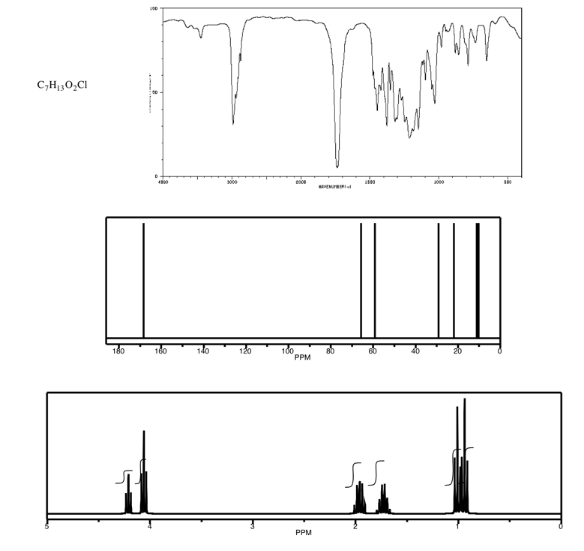
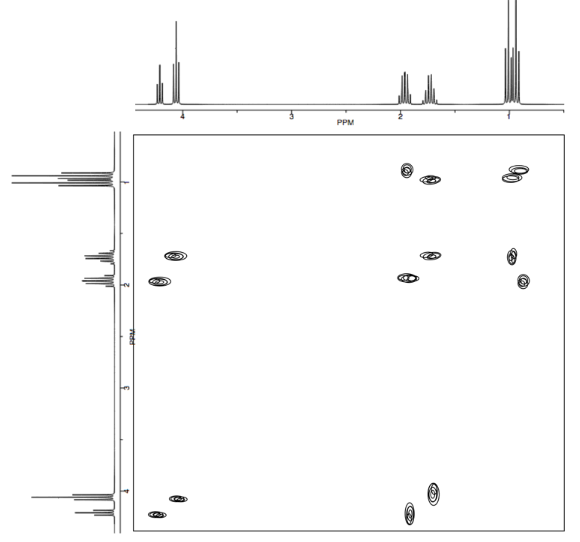
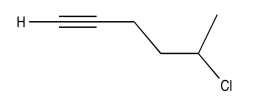
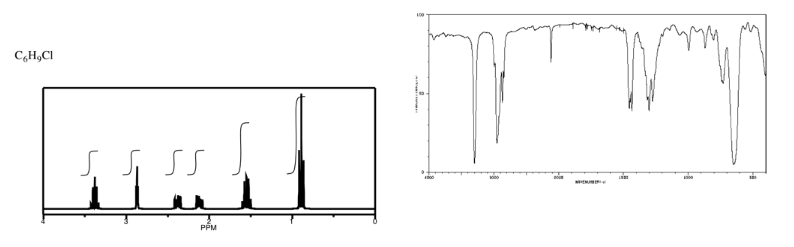
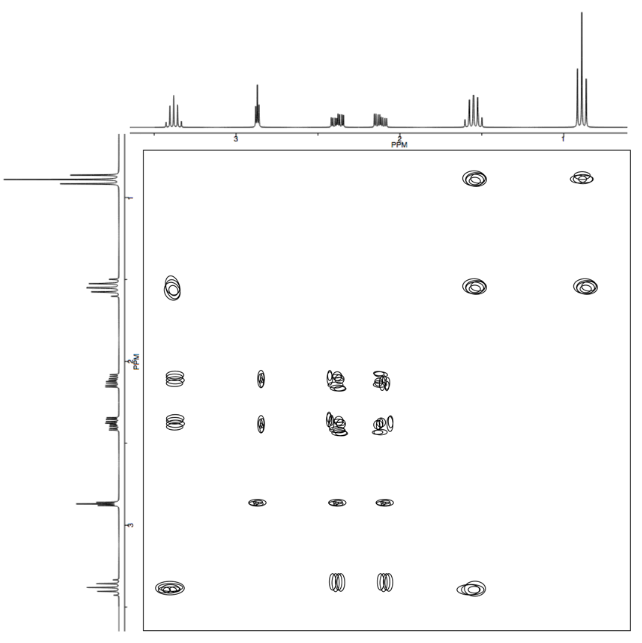
Analyse the data in the following spectra and propose a structure for the compound.
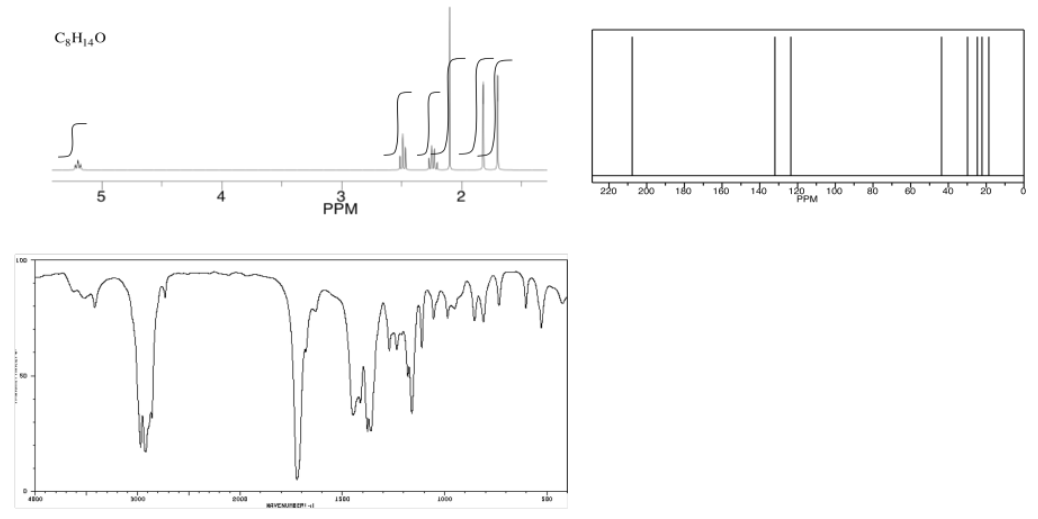
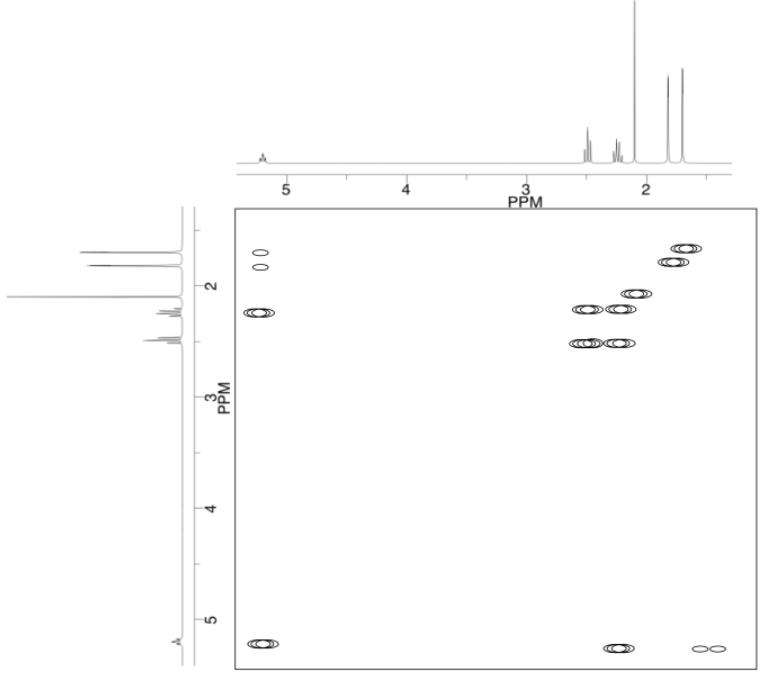
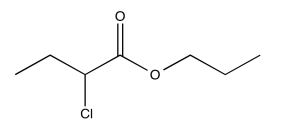
- Answer
-
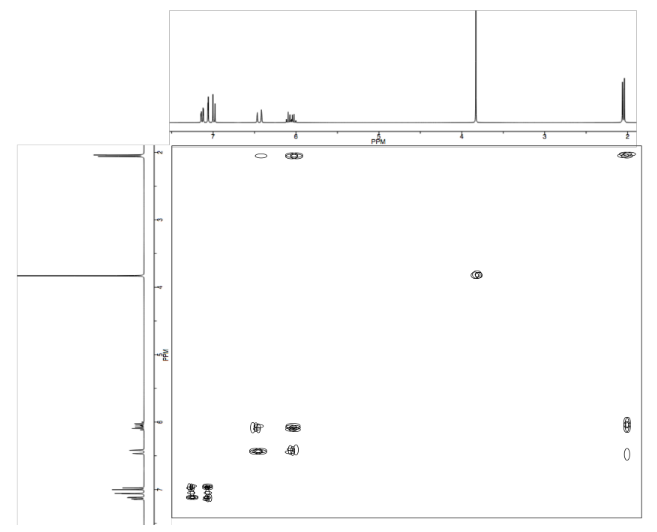
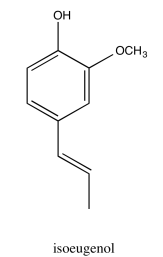
Exercise \(\PageIndex{4}\)
Analyse the data in the following spectra and propose a structure for the compound.
- Answer
-
Exercise \(\PageIndex{5}\)
Analyse the data in the following spectra and propose a structure for the compound.
- Answer
-
Exercise \(\PageIndex{6}\)
Analyse the data in the following spectra and propose a structure for the compound.
- Answer
-
Exercise \(\PageIndex{7}\)
Analyse the data in the following spectra and propose a structure for the compound.
- Answer
-
Exercise \(\PageIndex{8}\)
Analyse the data in the following spectra and propose a structure for the compound.
- Answer
-
Exercise \(\PageIndex{9}\)
Analyse the data in the following spectra and propose a structure for the compound.
- Answer
-
Exercise \(\PageIndex{10}\)
Analyse the data in the following spectra and propose a structure for the compound.
- Answer
-
Exercise \(\PageIndex{11}\)
Analyse the data in the following spectra and propose a structure for the compound.
- Answer
-
Exercise \(\PageIndex{12}\)
Analyse the data in the following spectra and propose a structure for the compound.
- Answer
-
* Sources:
Selected IR and 13C NMR spectra from SDBS (National Institute of Advanced Industrial Science and Technology, Japan, Spectral Database for Organic Compounds, http://sdbs.db.aist.go.jp/sdbs/cgi-bin/cre_index.cgi, accessed December, 2015).
1H NMR and COSY spectra simulated.