
18.3: The Rate Equation
- Page ID
- 49583

\( \newcommand{\vecs}[1]{\overset { \scriptstyle \rightharpoonup} {\mathbf{#1}} } \)
\( \newcommand{\vecd}[1]{\overset{-\!-\!\rightharpoonup}{\vphantom{a}\smash {#1}}} \)
\( \newcommand{\dsum}{\displaystyle\sum\limits} \)
\( \newcommand{\dint}{\displaystyle\int\limits} \)
\( \newcommand{\dlim}{\displaystyle\lim\limits} \)
\( \newcommand{\id}{\mathrm{id}}\) \( \newcommand{\Span}{\mathrm{span}}\)
( \newcommand{\kernel}{\mathrm{null}\,}\) \( \newcommand{\range}{\mathrm{range}\,}\)
\( \newcommand{\RealPart}{\mathrm{Re}}\) \( \newcommand{\ImaginaryPart}{\mathrm{Im}}\)
\( \newcommand{\Argument}{\mathrm{Arg}}\) \( \newcommand{\norm}[1]{\| #1 \|}\)
\( \newcommand{\inner}[2]{\langle #1, #2 \rangle}\)
\( \newcommand{\Span}{\mathrm{span}}\)
\( \newcommand{\id}{\mathrm{id}}\)
\( \newcommand{\Span}{\mathrm{span}}\)
\( \newcommand{\kernel}{\mathrm{null}\,}\)
\( \newcommand{\range}{\mathrm{range}\,}\)
\( \newcommand{\RealPart}{\mathrm{Re}}\)
\( \newcommand{\ImaginaryPart}{\mathrm{Im}}\)
\( \newcommand{\Argument}{\mathrm{Arg}}\)
\( \newcommand{\norm}[1]{\| #1 \|}\)
\( \newcommand{\inner}[2]{\langle #1, #2 \rangle}\)
\( \newcommand{\Span}{\mathrm{span}}\) \( \newcommand{\AA}{\unicode[.8,0]{x212B}}\)
\( \newcommand{\vectorA}[1]{\vec{#1}} % arrow\)
\( \newcommand{\vectorAt}[1]{\vec{\text{#1}}} % arrow\)
\( \newcommand{\vectorB}[1]{\overset { \scriptstyle \rightharpoonup} {\mathbf{#1}} } \)
\( \newcommand{\vectorC}[1]{\textbf{#1}} \)
\( \newcommand{\vectorD}[1]{\overrightarrow{#1}} \)
\( \newcommand{\vectorDt}[1]{\overrightarrow{\text{#1}}} \)
\( \newcommand{\vectE}[1]{\overset{-\!-\!\rightharpoonup}{\vphantom{a}\smash{\mathbf {#1}}}} \)
\( \newcommand{\vecs}[1]{\overset { \scriptstyle \rightharpoonup} {\mathbf{#1}} } \)
\(\newcommand{\longvect}{\overrightarrow}\)
\( \newcommand{\vecd}[1]{\overset{-\!-\!\rightharpoonup}{\vphantom{a}\smash {#1}}} \)
\(\newcommand{\avec}{\mathbf a}\) \(\newcommand{\bvec}{\mathbf b}\) \(\newcommand{\cvec}{\mathbf c}\) \(\newcommand{\dvec}{\mathbf d}\) \(\newcommand{\dtil}{\widetilde{\mathbf d}}\) \(\newcommand{\evec}{\mathbf e}\) \(\newcommand{\fvec}{\mathbf f}\) \(\newcommand{\nvec}{\mathbf n}\) \(\newcommand{\pvec}{\mathbf p}\) \(\newcommand{\qvec}{\mathbf q}\) \(\newcommand{\svec}{\mathbf s}\) \(\newcommand{\tvec}{\mathbf t}\) \(\newcommand{\uvec}{\mathbf u}\) \(\newcommand{\vvec}{\mathbf v}\) \(\newcommand{\wvec}{\mathbf w}\) \(\newcommand{\xvec}{\mathbf x}\) \(\newcommand{\yvec}{\mathbf y}\) \(\newcommand{\zvec}{\mathbf z}\) \(\newcommand{\rvec}{\mathbf r}\) \(\newcommand{\mvec}{\mathbf m}\) \(\newcommand{\zerovec}{\mathbf 0}\) \(\newcommand{\onevec}{\mathbf 1}\) \(\newcommand{\real}{\mathbb R}\) \(\newcommand{\twovec}[2]{\left[\begin{array}{r}#1 \\ #2 \end{array}\right]}\) \(\newcommand{\ctwovec}[2]{\left[\begin{array}{c}#1 \\ #2 \end{array}\right]}\) \(\newcommand{\threevec}[3]{\left[\begin{array}{r}#1 \\ #2 \\ #3 \end{array}\right]}\) \(\newcommand{\cthreevec}[3]{\left[\begin{array}{c}#1 \\ #2 \\ #3 \end{array}\right]}\) \(\newcommand{\fourvec}[4]{\left[\begin{array}{r}#1 \\ #2 \\ #3 \\ #4 \end{array}\right]}\) \(\newcommand{\cfourvec}[4]{\left[\begin{array}{c}#1 \\ #2 \\ #3 \\ #4 \end{array}\right]}\) \(\newcommand{\fivevec}[5]{\left[\begin{array}{r}#1 \\ #2 \\ #3 \\ #4 \\ #5 \\ \end{array}\right]}\) \(\newcommand{\cfivevec}[5]{\left[\begin{array}{c}#1 \\ #2 \\ #3 \\ #4 \\ #5 \\ \end{array}\right]}\) \(\newcommand{\mattwo}[4]{\left[\begin{array}{rr}#1 \amp #2 \\ #3 \amp #4 \\ \end{array}\right]}\) \(\newcommand{\laspan}[1]{\text{Span}\{#1\}}\) \(\newcommand{\bcal}{\cal B}\) \(\newcommand{\ccal}{\cal C}\) \(\newcommand{\scal}{\cal S}\) \(\newcommand{\wcal}{\cal W}\) \(\newcommand{\ecal}{\cal E}\) \(\newcommand{\coords}[2]{\left\{#1\right\}_{#2}}\) \(\newcommand{\gray}[1]{\color{gray}{#1}}\) \(\newcommand{\lgray}[1]{\color{lightgray}{#1}}\) \(\newcommand{\rank}{\operatorname{rank}}\) \(\newcommand{\row}{\text{Row}}\) \(\newcommand{\col}{\text{Col}}\) \(\renewcommand{\row}{\text{Row}}\) \(\newcommand{\nul}{\text{Nul}}\) \(\newcommand{\var}{\text{Var}}\) \(\newcommand{\corr}{\text{corr}}\) \(\newcommand{\len}[1]{\left|#1\right|}\) \(\newcommand{\bbar}{\overline{\bvec}}\) \(\newcommand{\bhat}{\widehat{\bvec}}\) \(\newcommand{\bperp}{\bvec^\perp}\) \(\newcommand{\xhat}{\widehat{\xvec}}\) \(\newcommand{\vhat}{\widehat{\vvec}}\) \(\newcommand{\uhat}{\widehat{\uvec}}\) \(\newcommand{\what}{\widehat{\wvec}}\) \(\newcommand{\Sighat}{\widehat{\Sigma}}\) \(\newcommand{\lt}{<}\) \(\newcommand{\gt}{>}\) \(\newcommand{\amp}{&}\) \(\definecolor{fillinmathshade}{gray}{0.9}\)As was mentioned in the section on reaction rate, the rate of reaction depends upon the concentrations of the reactants. Let us now look at the iodine clock reaction as an example. Two reactions actually occur in the iodine clock:
\[\text{ H}_{\text{2}}\text{O}_2 + \text{3I}^{-}\rightarrow \text{I}_{\text{3}}^{-} + \text{ 2H}_{\text{2}}\text{O} \nonumber \]
and
\[\text{I}_{\text{3}}^{-} + \text{ 2S}_{\text{2}}\text{O}_3^{2-}\rightarrow \text{3I}^{-} + \text{ S}_{\text{4}}\text{O}_6^{2-} \nonumber \]
The solution changes color as soon as all of the thiosulfate has been consumed. In the following video, we see how the concentration of the iodide ion affects the rate of reaction.
In this video, four iodine clock reactions are run with iodide concentrations in ratios of 1 : 0.75 : 0.5 : 0.375 from left to right. All other reactants are the same concentration. The video demonstrates that higher iodide ion concentrations increase the rate of the first reaction, meaning that thiosulfate is depleted more quickly. This causes the change in color signaling the end of the reaction to occur more quickly.
The iodide ion is not the only chemical which will effect the rate of reaction though. In the next video, H2SO4 concentration is varied to demonstrate this reagent's affect on the reaction rate:
In this video, four iodine clock reaction are run in four vials, with concentration ratios of H2SO4 going as 1 : 0.83 : 0.67 : 0.51 from left to right. Again, all other concentrations are kept constant including the iodide concentration. We see that, as was shown for the iodide ion before, the concentration of H2SO4 affects the reaction rate, with higher concentrations of H2SO4 producing a quicker reaction.
We now see that the concentration of two reactants in the iodine clock can modulate the rate of the reaction. Does hydrogen peroxide, H2O2, have an affect upon the iodine clock reaction rate? The following video tests whether this is true:
As in the first two videos, four iodine clock reactions are run, with H2O2 concentrations in the ratio of 1 : 0.8 : 0.6 : 0.4 respectively. For a third time, we see that increasing the concentration of one of the reactants, in this case, H2O2 increases the rate of the first reaction, and thus cause the thiosulfate to be more quickly.
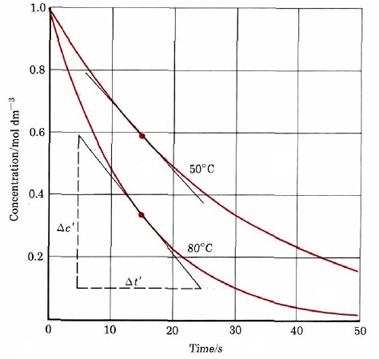
These three examples show that the rate of a reaction can depend on the concentration of one or more of the reactants. The rate of reaction for the Iodine Clock reaction is dependent upon the concentration of hydrogen peroxide, iodide ions, as well as sulfuric acid. The rate can be related mathematically to the concentrations of the reactants. Before we look at a reaction dependent upon multiple reactants, let us look at a simpler example. A good choice is the decomposition of the dye that we have already seen in Figure 1 and Figure 2 in the section on the rate of reaction. In this case it can be shown that the rate is directly proportional to the concentration of dye, ΔcD. That is,
\[\text{Rate} = k_{1}c_D\label{3} \]
The constant of proportionality k1 is called the rate constant. It is independent of the concentration of dye, but increases as temperature increases. This accounts for the greater rate of reaction at 80°C than at 50°C, as well as the greater rate of the iodine clock reaction at 20°C compared to 8°C.
In the example in the rate of reaction section average rates were calculated for three 10-s time intervals for the decomposition of a dye at 80°C. Using the following graph from that example, obtain concentrations of the dye at various times, show that Eq. \(\ref{3}\) is valid for this dye.
Solution
Our previous discussion has indicated that the average reaction rate over a small time interval is very close to the actual rate at the midpoint of that interval. Thus we obtain the following table:
| Average Rate/mol dm–3 s–1 | Time Interval | Time from Start to Midpoint of Interval/s | Concentration of Dye/mol dm–3 |
|---|---|---|---|
|
.051 |
0 – 10 s |
5 |
0.70 |
|
0.025 |
10 – 20 s |
15 |
0.34 |
|
0.013 |
20 – 30 s |
25 |
0.18 |
If Eq. \(\ref{3}\) is valid, k1 should not depend on the concentration of dye. Rearranging Eq. (1) to calculate the rate constant, we find that at 5 s,
\(k_{\text{1}}=\dfrac{\text{rate}}{c_{D}}=\dfrac{\text{0}\text{.051 mol dm}^{-\text{3}}\text{ s}^{-\text{1}}}{\text{0}\text{.70 mol dm}^{-\text{3}}}=\text{0}\text{.073 s}^{-\text{1}}\)
At 15 s, \(k_{\text{1}}=\dfrac{\text{rate}}{c_{D}}=\dfrac{\text{0}\text{.025 mol dm}^{-\text{3}}\text{ s}^{-\text{1}}}{\text{0}\text{.34 mol dm}^{-\text{3}}}=\text{0}\text{.074 s}^{-\text{1}}\) At 25 s, \(k_{\text{1}}=\dfrac{\text{rate}}{c_{D}}=\dfrac{\text{0}\text{.013 mol dm}^{-\text{3}}\text{ s}^{-\text{1}}}{\text{0}\text{.18 mol dm}^{-\text{3}}}=\text{0}\text{.072 s}^{-\text{1}}\) Thus the rate constant is constant to two significant digits. This is within the accuracy of the measurements.
The rate of a reaction may depend on the concentration of one or more products as well as reactants. In some cases it may even be influenced by the concentration of a substance which is neither a reactant nor a product in the overall stoichiometric equation for the reaction. An example of this latter situation is provided by the conversion of cis-2-butene to trans-2-butene:
![]() (2)
(2)
If some iodine is present, this reaction goes faster, and the rate law is found to be
Rate = k2(ccis-2-butene)(cI2)1/2 (3)
Although iodine does not appear in Eq. (2), its concentration does affect the reaction rate. Consequently iodine is called a catalyst for the reaction. The section on catalysis shows how this catalytic effect of iodine actually works.
It should be clear from the examples we have just given that we cannot tell from a stoichiometric equation like Eq. (2) which reactants, products, or catalysts will affect the rate of a given reaction. Such information must be obtained from experiments in which the concentrations of various species are altered, and the effects of those alterations on the rate of reaction are served. The results of such experiments are usually summarized in a rate equation or rate law for a given reaction. Equations (1) and (3), for example, are the rate laws for decomposition of a dye and for cis-trans isomerization of 2-butene (in the presence of the catalyst, I2). In general a rate equation has the form
Rate = k(cA)a(cB)b . . . (4)
It is necessary to determine experimentally which substances (A, B, etc.) affect the rate and to what powers (a, b, etc.) their concentrations must be raised. Then the rate constant k can be calculated. The exponents a, b, etc., are usually positive integers, but they may sometimes be fractions [as in Eq. (3)] or negative numbers. We say that the order of the reaction with respect to component A is a, while the order with respect to B is b. The overall order of the reaction is a + b.
For each reaction and experimentally measured rate equation listed below determine the order with respect to each reactant and the overall order:
a) \(\ce{14H3O^+ + 2HCrO4^- + 6I^- -> 2Cr^{3+} + 3I2 + 22H2O}\)Rate = k(CHCrO4-)(CI-)2(CH3O+)2
b) \(\ce{2I^- + H2O2 + 2H3O^+ -> I2 + 4H2O}\)
Rate = k(CH2O2)(CI–) 3 ≤ pH ≤ 5
Solution
a) The reaction is second order in H3O+ ion, second order in I– ion, and first order in HCrO4–. The overall order is 2 + 2 + 1 = 5.
b) The rate law is first order in I– and first order in H2O2, and so the overall order is 2. The concentration of H3O+ does not appear at all. When this happens the reaction is said to be zero order in H3O+, because (cH3O+)0 = 1, and a factor of 1 in the rate law has no effect.
How is the order of a reaction experimentally obtained? In the next example, we will return to the iodine clock and determine the order of each reactant considered at the beginning of this section. Remember that in this reaction the same quantity of thiosulfate ions was added to each reaction mixture so the time taken for the color change to occur is inversely proportional to the rate of the reaction. Therefore 1/t—the reciprocal of the time for the concentration of thiosulfate ions to go to zero—is proportional to the initial rate of the reaction. Then each concentration can be plotted against 1/t to find the relationship between rate and concentration.
The next table gives the time(t) and 1/t for the completion of the iodine clock reactions seen at the beginning of the section for each of the experimental conditions in those three videos. Determine the order of each reactant by plotting initial concentration versus 1/t (which is proportional to the initial rate).
| Reactant | Relative Concentration |
Time to Complete Reaction (s) |
1/t (s-1) |
|---|---|---|---|
|
I- |
1 |
24 |
0.041 |
|
0.75 |
33 |
0.031 |
|
|
0.5 |
46 |
0.022 |
|
|
0.375 |
59 |
0.017 |
|
|
H2SO4 |
1 |
17 |
0.058 |
|
0.83 |
20 |
0.050 |
|
|
0.67 |
24 |
0.042 |
|
|
0.51 |
28 |
0.035 |
|
|
H2O2 |
1 |
24 |
0.041 |
|
0.8 |
31 |
0.032 |
|
|
0.6 |
43 |
0.023 |
|
|
0.4 |
68 |
0.015 |
|
|
I- |
1 |
24 |
0.041 |
Solution
irst, determine how plotting concentration versus 1/t will determine the order of the reactant in question. If we break down equation 4 into a proportionality, and think of the rate as 1/t, we can find the relationship:
\[frac{1}{t}\propto {c_A}^a \nonumber \]
Thus, if a = 1, the graph will be linear, if a=2, the graph will look like a quadratic function, and so on. In the graph below, the data from above is plotted.
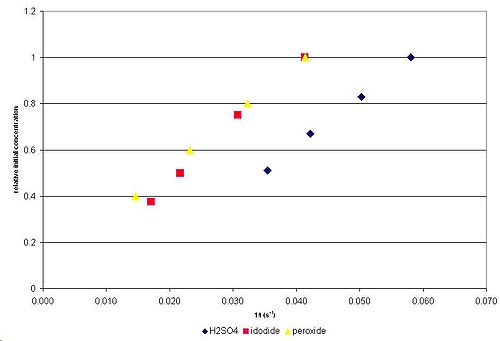
As can bee seen, all three reactants are linear on the concentration versus 1/t plot. Thus all three reactants, I-, H2SO4, and H2O2 have an order of 1.
In the last example, it was possible to obtain the order of the three reactants, but not the full rate law. How can a rate law be obtained from experimental measurements? One way has already been illustrated in Example \(\PageIndex{1}\). There we guessed a rate law and then used it to calculate the rate constant k. Since k remained the same at various points during the reaction, we concluded that the rate equation was correct. Another way of obtaining a rate equation is illustrated in the next example.
The rate of the reaction
-
- \[\ce{2NO + O2 -> 2NO2} \nonumber \]
was measured at 25°C, with various initial concentrations of NO and O2. The following results were obtained for the initial rate of the reaction:
| Experiment Number | cNO/mol dm-3 | cO2/mol dm-3 | Initial rate/mol dm-3 s-1 |
| 1 | 0.0020 | 0.0010 | 0.028 |
| 2 | 0.0020 | 0.0020 | 0.057 |
| 3 | 0.0020 | 0.0040 | 0.114 |
| 4 | 0.0040 | 0.0020 | 0.227 |
| 5 | 0.0010 | 0.0020 | 0.014 |
Find the order of this reaction with respect to each reactant, the overall order, and the rate constant.
Solution
In experiments 1, 2, and 3 the concentration of NO remains constant while the concentration of O2 increases from 0.010 to 0.020 to 0.040 mol dm–3. Each doubling of cO2 also doubles the rate (from 0.028 to 0.057 to 0.114 mol dm–3 s–1). Therefore the rate is proportional to cO2.
In experiments 2, 4, and 5 the concentration of O2 remains constant. Comparing experiments 2 and 4, we find that doubling cNO increases the rate from 0.057 to 0.227 mol dm–3 s–1. This is a factor of 4, or 22. The same factor is observed comparing experiment 5 to experiment 2. Thus we conclude that the rate is proportional to the square of cNO, and the rate equation must be
Rate = k(cO2)(cNO)2
The reaction is third-order overall—first order in O2 and second order in NO.The rate constant can be calculated by rearranging the rate equation and substituting the concentrations and rate from any one of the five experiments. From experiment 3
\[k = \frac{\text{rate}}{\text{(}c_{\text{O}_{\text{2}}}\text{)(}c_{\text{NO}}\text{)}^{\text{2}}} = \frac{\text{0}\text{.114 mol dm}^{-\text{3}}\text{ s}^{-\text{1}}}{\text{(0}\text{.040 mol dm}^{-\text{3}}\text{)(0}\text{.020 mol dm}^{-\text{3}}\text{)}^{\text{2}}} = \frac{\text{0}\text{.114 mol dm}^{-\text{3}}\text{ s}^{-\text{1}}}{\text{1}\text{.6 }\times \text{ 10}^{-\text{5}}\text{ mol}^{\text{3}}\text{ dm}^{-\text{9}}} \nonumber \] = 7.1 × 10³ mol–2 dm6 s–1 A better value of the rate constant could be obtained by calculating for all five experiments and averaging the results.The reaction described in the previous example is of considerable importance in the air above cities. As we mentioned in the section on Group VA elements, automobile engines emit NO which is then oxidized to brown NO2, an important precursor of photochemical air pollution. As we have just seen, this oxidation is second order in NO, and so when heavy traffic increases the concentration of NO by a factor of 10, the rate of production of NO2 goes up by the considerably larger factor of 102, or 100.