
Introduction to Mass Spectrometry
- Page ID
- 287441

\( \newcommand{\vecs}[1]{\overset { \scriptstyle \rightharpoonup} {\mathbf{#1}} } \)
\( \newcommand{\vecd}[1]{\overset{-\!-\!\rightharpoonup}{\vphantom{a}\smash {#1}}} \)
\( \newcommand{\id}{\mathrm{id}}\) \( \newcommand{\Span}{\mathrm{span}}\)
( \newcommand{\kernel}{\mathrm{null}\,}\) \( \newcommand{\range}{\mathrm{range}\,}\)
\( \newcommand{\RealPart}{\mathrm{Re}}\) \( \newcommand{\ImaginaryPart}{\mathrm{Im}}\)
\( \newcommand{\Argument}{\mathrm{Arg}}\) \( \newcommand{\norm}[1]{\| #1 \|}\)
\( \newcommand{\inner}[2]{\langle #1, #2 \rangle}\)
\( \newcommand{\Span}{\mathrm{span}}\)
\( \newcommand{\id}{\mathrm{id}}\)
\( \newcommand{\Span}{\mathrm{span}}\)
\( \newcommand{\kernel}{\mathrm{null}\,}\)
\( \newcommand{\range}{\mathrm{range}\,}\)
\( \newcommand{\RealPart}{\mathrm{Re}}\)
\( \newcommand{\ImaginaryPart}{\mathrm{Im}}\)
\( \newcommand{\Argument}{\mathrm{Arg}}\)
\( \newcommand{\norm}[1]{\| #1 \|}\)
\( \newcommand{\inner}[2]{\langle #1, #2 \rangle}\)
\( \newcommand{\Span}{\mathrm{span}}\) \( \newcommand{\AA}{\unicode[.8,0]{x212B}}\)
\( \newcommand{\vectorA}[1]{\vec{#1}} % arrow\)
\( \newcommand{\vectorAt}[1]{\vec{\text{#1}}} % arrow\)
\( \newcommand{\vectorB}[1]{\overset { \scriptstyle \rightharpoonup} {\mathbf{#1}} } \)
\( \newcommand{\vectorC}[1]{\textbf{#1}} \)
\( \newcommand{\vectorD}[1]{\overrightarrow{#1}} \)
\( \newcommand{\vectorDt}[1]{\overrightarrow{\text{#1}}} \)
\( \newcommand{\vectE}[1]{\overset{-\!-\!\rightharpoonup}{\vphantom{a}\smash{\mathbf {#1}}}} \)
\( \newcommand{\vecs}[1]{\overset { \scriptstyle \rightharpoonup} {\mathbf{#1}} } \)
\( \newcommand{\vecd}[1]{\overset{-\!-\!\rightharpoonup}{\vphantom{a}\smash {#1}}} \)
Part 1. The mass spectrum
Learning Objectives
At the completion of this activity, you should be able to…
- describe the relationship between the peak height in the mass spectrum and the natural abundance of isotopes
- differentiate between average mass, isotopic mass and nominal mass; identify the appropriate use of each in the analysis of mass spectrometric data
- identify the molecular ion in the mass spectrum
- identify the base peak in the mass spectrum
Mass spectrometry is routinely used for the identification and quantitation of small organic molecules composed of carbon, hydrogen and oxygen.
Consider this…
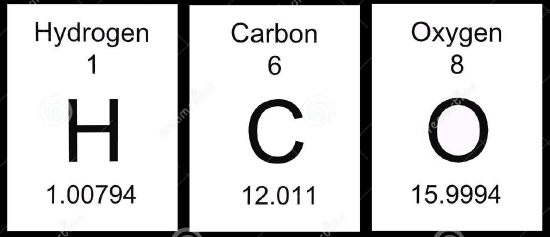
Table 1 – Isotopic Masses
|
Element |
Isotopic Mass (Da) |
% Abundance |
|---|---|---|
|
1H |
1.00782 |
99.99 |
|
12C |
12.0000 |
98.93 |
|
16O |
15.9949 |
99.76 |
Compare the masses of hydrogen, carbon and oxygen from the periodic table (above) to the masses in Table 1.
- Calculate the differences between the masses in the periodic table and the masses in Table 1.
- What correlation exists between the differences calculated in Q1 and the percent abundance in Table 1?
- Use your knowledge from general chemistry to explain how the masses on the periodic table are different from the masses in Table 1.
- A simulated mass spectrum of carbon is shown in Figure 1. What mass (average or isotopic) is useful in mass spectrometry? Explain.
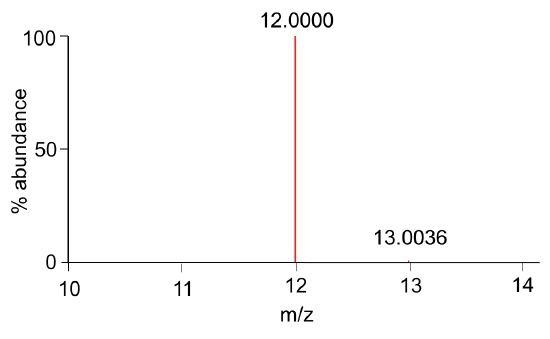
Figure 1. Mass spectrum of carbon.
Now let’s look at the axes in the mass spectrum…
- What is the y-axis? What correlation exists between peak heights in Figure 1 and the relative abundances in Table 1?
- What is the x-axis? Compare the expected mass (Table 1) and the observed mass (Figure 1). What is implied about “z”?
Consider this… The peak with the greatest abundance in the mass spectrum is called the base peak.
- What is the base peak in Figure 1?
Consider this…
Table 2. Benzoic Acid
|
Formula |
Average mass |
122.1234 Da |
|
C7H6O2 |
Isotopic mass |
122.0367 Da |
|
Nominal mass |
122 Da |
- Use Table 1 with the most abundant isotopes of carbon, hydrogen and oxygen to calculate the isotopic mass for benzoic acid, C7H6O2. Check your answer in Table 2.
- Calculate the difference between the mass calculated in Q8 and the mass observed for the most abundant peak in Figure 2. This data was “collected” on a high mass accuracy instrument.
Consider this… for an analyte to be detected by a mass spectrometer, it must be in the gas phase and have charge. The analyte is charged (ionized) in the ionization source of the mass spectrometer. In Figure 2, benzoic acid was ionized by electron ionization (EI). In this process, an electron is lost to form a radical cation (M+•). The mass difference calculated in Q9 corresponds to the mass of the electron lost. This process is shown generically:
\[\ce{M → M^{+•} + e-}\nonumber\]
- Assign a formula to both ions observed in Figure 2. Be sure to represent the ions as charged species.
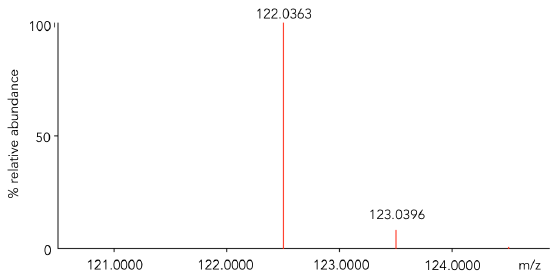
Figure 2. Zoomed mass inset of benzoic acid obtained on a high mass accuracy instrument with an EI source.
Consider this… Only the highest mass accuracy instruments can accurately measure the loss of an electron. Therefore, for most applications we assume
\[\mathbf{M^{+•} = M}\nonumber\]
and call the M+• peak the molecular ion. It provides the molecular mass of the analyte.
To date, most of the mass spectra that you have seen were collected on a low resolution, low mass accuracy GC/MS. An example is shown below in Figure 3.
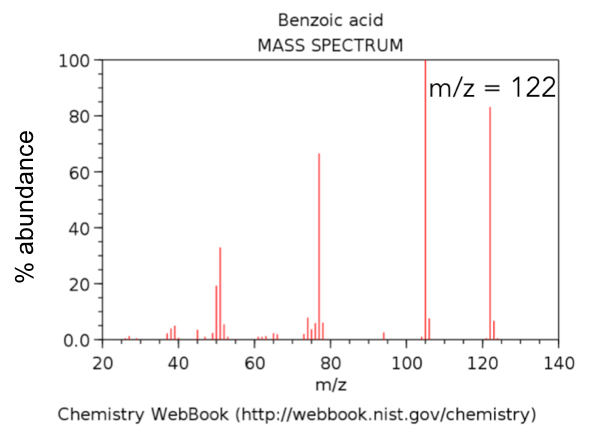
- Circle the molecular ion of benzoic acid in Figure 3. Use Table 2 to classify the observed mass as the average mass, the isotopic mass or the nominal mass.
- Explain how nominal mass is determined.
- When interpreting mass spectra, when is it appropriate to use the average mass, the isotopic mass or the nominal mass?
Part 2. Figures of merit in mass spectrometry
Learning Objectives
At the completion of this activity, you should be able to…
- calculate mass accuracy from mass spectral data
- classify mass analyzers as low or high mass accuracy
- calculate mass resolving power from mass spectral data
- classify mass analyzers as low, medium or high resolving power
Consider this…
The heart of a mass spectrometer is the mass analyzer, which differentiates analytes based on their mass-to-charge ratios (m/z). Numerous figures of merit are used to describe the performance of a mass analyzer, including scan speed, mass range, linear dynamic range, sensitivity, mass accuracy, mass resolving power and mass resolution. Typical figures of merit for mass accuracy and mass resolving power are given in Table 3.
Table 3. Approximate figures of merit for different mass analyzers.*
|
Mass Analyzer |
Mass accuracy (ppm) |
Mass resolving power (m/Δm) |
|---|---|---|
|
quadrupole |
1000 ppm |
1,000 |
|
ion trap |
1000 ppm |
1,000 |
|
time of flight |
~ 10 ppm |
10,000 |
|
high res time of flight |
~ 10 ppm |
60,000 |
|
Orbitrap |
~ 3 ppm |
100,000 – 500,000 |
|
Fourier transform ion cyclotron resonance (FT-ICR) |
< 1 ppm |
200,000 – 1,000,000 |
*Manufacturers continuously improve instruments. These figures are ball-park estimates.
Mass Accuracy
- You are familiar with the concept of “accuracy.” Give the formula used to calculate accuracy.
- Most mass spectrometers measure mass very accurately. Therefore, the difference between measured and observed mass is quite small. For this reason, mass accuracy is often expressed in parts per million (ppm). Rewrite the equation in Q1 so that the calculated result will have a unit of ppm.
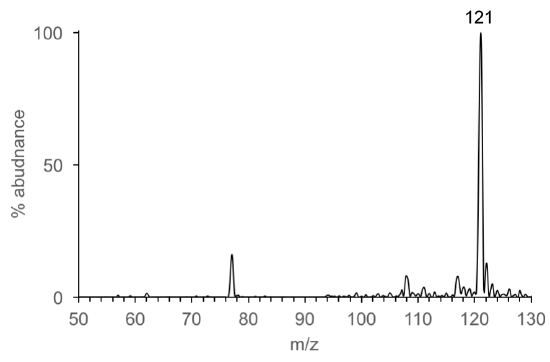
- Using the equation in Q2, calculate the mass accuracy of benzoic acid from the mass spectral data shown in Figure 4. Recall that you calculated in theoretical mass of benzoic acid in Part 1, Q8.
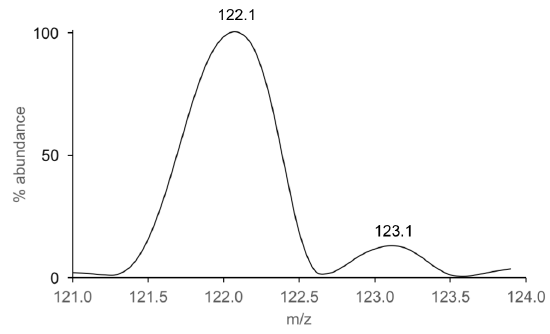
Figure 4. Zoomed mass inset of benzoic acid obtained on an instrument with an EI source.
- Based on your answer in Q4, what instrument was likely used to collect the data in Figure 4?
- In Part 1 of this module, we saw that molecular ions are formed by loss an electron (mass = 0.0004 Da). Which mass spectrometer(s) listed in Table 3 has/have the mass accuracy needed to detect the loss of a single electron from benzoic acid?
- Classify the mass analyzers in Table 3 as low or high mass accuracy instruments.
|
Low Mass Accuracy Instruments |
High Mass Accuracy Instruments |
|---|---|
|
|
|
Mass Resolving Power
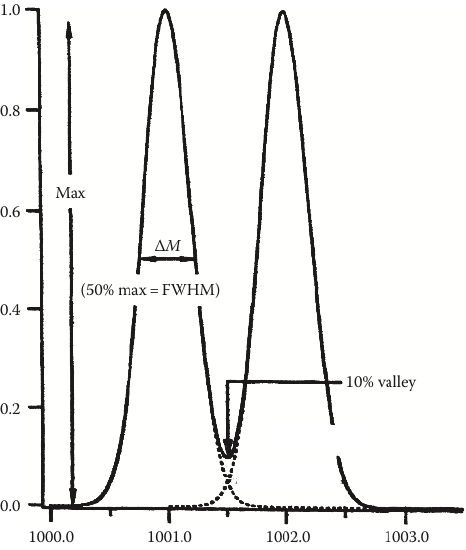
Consider this… Mass resolving power (RP) describes the separation between two adjacent peaks whose overlap is 10% (see the dotted lines in Figure 5). It is calculated using:
\[\textit{mass resolving power} = \dfrac{m}{Δm}\nonumber\]
There are numerous ways to calculate mass resolving power with this equation. We are going to utilize the most straightforward method, where m is the mass of the ion (e.g., 1000) and Δm is the width of the peak at full width half-height (or width at 50% of maximum peak height). Using the left-most peak in Figure 5, the RP is
\[\textit{mass resolving power} = \dfrac{1000.0\: Da}{\sim 0.5\: Da} = {\sim 2000}\nonumber\]
Note that mass resolving power is a unitless value.
- Use the molecular ion of benzoic acid (Figure 4) to estimate the mass resolving power of that mass analyzer.
- When reporting mass resolving power, the analyst must specify the m/z used in the calculation. Why do you think this is important? Support your answer with evidence.
- An FT-ICR with a 11T magnet can achieve a mass resolving power of 1,000,000 at m/z 400. What is the smallest mass difference that can be resolved?
- Classify the mass analyzers in Table 3 as low, medium or high mass resolving power.
Low RP
Med RP
High RP
- Table 4 lists the approximate cost for different mass analyzers. Describe the relationship that exists between mass accuracy, resolving power and cost.
Table 4. costs for different mass analyzers.*
Mass Analyzer
Cost
quadrupole
$75,000
ion trap
$75,000
time of flight
$150,000
high res time of flight
$400,000
Orbitrap
$750,000
Fourier transform ion cyclotron resonance
$1,000,000
*These are ball-park figures. Cost vary considerably by manufacturer.
Part 3. Hard vs. soft ionization
Learning Objectives
At the completion of this activity, you should be able to…
- identify the types of ions formed by EI and ESI
- use mass spectral data to classify ionization sources as soft ionization or hard ionization
- describe the advantages and disadvantages of soft and hard ionization
Consider this… There are MANY different types of ionization sources. Electron ionization is the most common source coupled to GC. Electrospray ionization (ESI) is the common most source coupled to LC. (We will discuss why later). Let’s look the types of ions produced by EI and ESI by comparing mass spectra of benzoic acid.
- Identify the mass and type of ion that corresponds to benzoic acid (C7H6O2) in each mass spectrum. Explain how the mass of benzoic acid is determined from the EI mass spectrum and from the ESI mass spectrum.
- The most abundant ions (>20% abundance) observed in the EI and ESI mass spectra are listed in Table 5. How are the EI and ESI spectra different? How are they the same?
Table 5. Most abundant ions in EI and ESI
EI Mass Spectrum
ESI Mass Spectrum
122
105
77
51
50
121
77
-
- Draw the structure of benzoic acid.
-
Use the structure to propose the identity of the peaks in the mass spectra.
- Draw the structure of benzoic acid.
- EI is classified as a “hard ionization” source, while ESI is classified as a “soft ionization” source. Use your answers in Q1-3 to construct a definition for hard ionization and soft ionization.
- Chemical ionization (CI) is a soft ionization technique used with GC. From the mass spectra of 1-decanol, determine the advantages and disadvantages of hard and soft ionization.
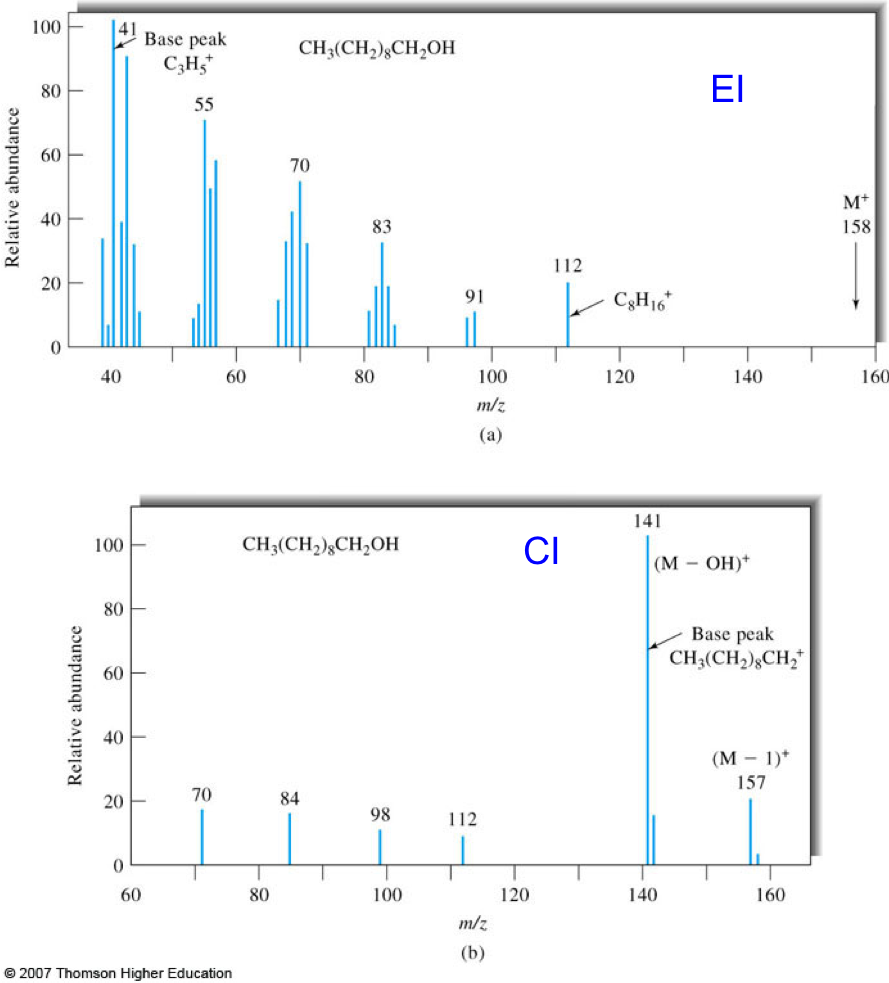
Figure 7. Mass spectra of 1-decanol obtained by EI (top) and CI (bottom) GC/MS. Figures taken from Skoog.2
References
- Skoog, D.A., Holler, F.J., Crouch, S.R. Principles of Instrumental Analysis, 6th edition; Cengage Learning, Boston, 2006.
- Robinson, J. W., Frame, E.M.S, Frame, G.M. Undergraduate Instrumental Analysis, 7th edition, CRC Press, Boca Raton, 2014.
Contributors and Attributions
- Chrisi Hughey, James Madison University (hugheyca@jmu.edu)
- Sourced from the Analytical Sciences Digital Library