
Calibration Methods (Hunter)
- Page ID
- 281390

Principles of Calibration
Learning Objectives:
At the conclusion of this activity, students will be able to:
- explain the differences between external standard and standard addition calibration.
- identify when the use of an internal standard is necessary.
- discuss the merits and drawbacks of each type of calibration.
- calculate the concentration of an analyte given raw data using any combination of calibration methods (external standard, standard addition, and/or internal standard).
- develop an appropriate calibration method when faced with a real world analytical problem.
Why does concentration matter? Why must we calibrate?
Accurately knowing the amount, in terms of concentration, of a particular substance (analyte) is important in fundamental research and also in many applied fields of study, and is the foundation of quantitative chemical analysis. When using classical analytical methods (e.g., gravimetry), the measured value (e.g., mass) is a direct representation of quantity of analyte. However, with more modern analytical techniques this is not always the case.
In order to determine the concentration of a particular analyte in a sample using a specific instrument we must perform a procedure known as “concentration calibration.” While analytes themselves sometimes cannot be measured directly, specific properties of the analyte are measurable. Many analysis techniques provide a response (signal) to a solution containing some concentration of an analyte. For example, the light absorption properties of a chemical may be measured to determine its concentration in a sample (recall Beer’s Law). Calibration is the process of determining the response of an instrument to a particular analyte, or the relationship between the signal and the amount of analyte in a sample.
Q1. As a group, devise a way in which you could determine how the signal from an unknown amount of analyte corresponds to its concentration. What materials would you need to do this?
PART I.
To determine the concentration of 2,3-butanedione (diacetyl, boiling point 88 °C) in beer, a headspace gas chromatography method is utilized to separate the various components in beer. A series of standard solutions are created to define the instrument response to varying concentrations of analyte.
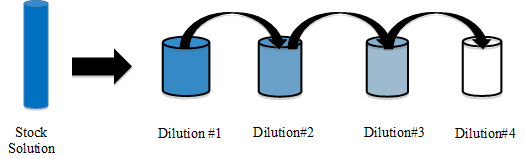
Specifically, a stock solution is created by adding a specific amount of diacetyl primary standard to a solution of 5% (v/v) ethanol in water. This stock solution is then diluted to give a series of lower concentrations of the analyte; this is most commonly done using the serial dilution method as shown below. For the dilution of diacetyl, an aliquot of the stock solution is transferred into a new volumetric flask, diluted (with 5% ethanol in water) and mixed well to produce diluted solution 1. Then, the same aliquot amount from diluted solution 1 is transferred into a new volumetric flask, diluted to the mark, and mixed well to prepare diluted solution 2. The process is repeated in this manner until a series of solutions have been prepared in which each successive solution is more dilute than the previous. The figure below illustrates preparation of four dilutions starting with the stock solution. This is known as an external standard calibration.
Calculations are performed using the dilution equation
\[\mathrm{C_1V_1 = C_2V_2}\nonumber\]
where C is concentration, V is solution volume, and the subscripts 1 and 2 refer to the initial solution and the more dilute final solution, respectively.
When each standard, along with a blank (no diacetyl added), is run on the gas chromatograph, a signal (peak area) is recorded for each concentration of diacetyl, as given in Table 1.
|
Diacetyl (ppm) |
Signal (peak area) |
|---|---|
|
0 |
0 |
|
25 |
330 |
|
50 |
793 |
|
100 |
1442 |
|
200 |
2367 |
|
250 |
2945 |
|
300 |
3762 |
Table 1. Signal generated for each standard solution of diacetyl.
Q2. For the series of diacetyl standard solutions in Table 1, plot the concentration values on the x-axis and the signal values on the y-axis using Excel.
If you need a refresher on plotting graphs using Excel, visit the following website:
www.ncsu.edu/labwrite/res/gt/gt-reg-home.html
Regression lines are a visual way to depict the relationship between independent (x) and dependent (y) variables in a graph like the one generated in Q2. In this case (but not always), the equation that best represents the relationship between x and y is called the linear regression equation; it is the equation that is a best fit to a straight line, y = mx + b, where y values represent the detector responses to some physical property of the analyte at different concentrations, m is the slope of the line, x values represent the different concentrations of the standard analyte, and b is the y-intercept. Linear regression models are often fitted using the Least Squares method. How well the resulting regression equation describes the data is expressed as a correlation coefficient, R2. The closer R2 is to 1.00, the better the fit because the data will more closely fit the equation for a straight line.
Q3. Determine the regression equation and R2 value for the graph in Q2.
Visit the website below for a refresher on how to determine this information.
www.ncsu.edu/labwrite/res/gt/gt-reg-home.html
Q4. Use the equation information generated in Q3 to calculate the concentration of diacetyl that would yield a peak area of 2598.
The general steps involved in using standard analyte concentration and detector response data to calculate an unknown analyte concentration using linear regression and the method of least squares is as follows:
- Create a scatter plot of the data
- Create a linear regression line (trend line)
- Obtain a regression equation and R-squared value
- Rearrange the regression equation to calculate the unknown analyte concentration (software can automatically perform this calculation)
Q5. Referring to the calibration curve you determined for diacetyl in Q4, what could be done to obtain the concentration of diacetyl in a solution that has an signal beyond the linear range of the calibration curve (for example, a peak are of 4519)?
PART II.
For the determination of diacetyl using headspace gas chromatography, the standards and beer samples are heated in special vials at 60 °C for 45 min. Once heated, a 500-μL sample is collected from the headspace (above the liquid) of each vial using a gas-tight syringe and injected onto the instrument.
Q6. What is the purpose of heating the samples?
Q7. List some factors that may impact the amount of diacetyl collected in the syringe and/or injected onto the instrument. For each item listed, indicate how it would impact the signal; be prepared to explain your reasoning.
A research student runs diacetyl standards and constructs the following calibration curve:
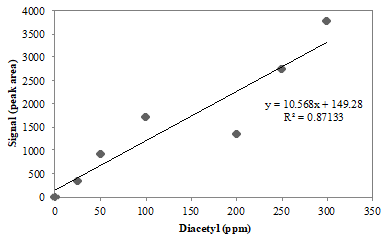
Q8. Describe the relationship of the data points to the trend line in Figure 1. Is it a good calibration curve (i.e., would you feel confident using it to determine the concentration of an unknown)?
Q9. Would you use the calibration curve in Figure 1 to calculate the concentration of diacetyl in the beer samples? Why or why not?
Q10. Some of the items you listed in Q7 may be contributing to the signal fluctuations in Figure 1. As a group, brainstorm a way you could correct for the error observed in this calibration curve.
An internal standard (I.S.) in analytical chemistry is a substance similar to the analyte that is added in a constant, known quantity to the blank, the standards, and the samples. They are useful to compensate for changes in extraction efficiency, detector response due to sample loss during preparation steps, fluctuations in sample analyzed, or changes in detector response due to different flow rates. Internal standards are widely used in chromatography because of differences in the reproducibility of sample injected into the chromatograph. All of these changes should affect the internal standard to the same degree as the analyte so that the relative ratio of the standard to analyte remains constant.
For the quantification of diacetyl in beer, 2,3-hexanedione is most commonly utilized as an internal standard.
Q11. Draw the chemical structures of diacetyl (2,3-butanedione) and 2,3-hexanedione. What are their boiling points?
Q12. Based on your answer to Q11, is 2,3-hexanedione a good choice as an internal standard for the analysis of diacetyl? Why or why not?
If a multi-point calibration curve is created, one must determine the signal from both the analyte and internal standard and plot the relative signal vs. the relative concentration, as shown in the data in Table 2.
|
Diacetyl (analyte, ppm) |
2,3-hexanedione (I.S., ppm) |
Analyte peak area |
I.S. peak area |
Conc. ratio (analyte/I.S.) |
Signal ratio (analyte/I.S.) |
|---|---|---|---|---|---|
|
0 |
0.05 |
0 |
58 |
|
|
|
25 |
0.05 |
330 |
59 |
|
|
|
50 |
0.05 |
911 |
82 |
|
|
|
100 |
0.05 |
1720 |
74 |
|
|
|
200 |
0.05 |
1352 |
28 |
|
|
|
250 |
0.05 |
2745 |
48 |
|
|
|
300 |
0.05 |
3762 |
55 |
|
|
Table 2. Signal collected for diacetyl standards in 5% (v/v) ethanol in water, spiked with a 2,3-hexanedione I.S.
Q13. Table 2 shows the composition of the standards run on the instrument. What is the same between each standard? What is different? Is this an external standard calibration? Explain why or why not.
Q14. Calculate the concentration and signal ratios for each standard and fill in the results in the empty columns of Table 2.
Q15. Using the data in Table 2, construct a calibration curve for diacetyl with the internal standard. Think carefully about what should be plotted on each axis.
Q16. Describe the relationship of the data points to the trend line for the calibration curve your group constructed. Does the trend line adequately fit the data?
Q17. A beer sample spiked with 0.05 ppm internal standard has a diacetyl peak area of 1497 and an I.S. peak area of 63. What is the concentration of diacetyl in the beer?
Q18. What types of errors can the addition of an internal standard be used to correct for? What types of errors will the use of an internal standard not fix? Explain.
PART III.
Iso-alpha-acid content in beer is the main contributor to its bitter taste. The concentrations of various types of iso-alpha-acids are commonly determined using a liquid chromatography method to quantify each of them separately. Iso-alpha-acid standards can be purchased and diluted in water to construct an external standard calibration curve.
Q19. The matrix of a sample or standard includes everything except the analyte of interest. What is the matrix of the standard samples described above for constructing the external standard calibration curve?
Q20. What is the matrix of beer sample? Based on your knowledge of beer, what compounds may be present that are not present in the standards described above?
Sometimes, components of the matrix may interact with the analyte and alter its response in the measurement technique. Matrix effects can sometimes enhance the response, whereas other times they may decrease the response, but either may lead to an incorrect determination of analyte concentration.
Q21. What type of error is being introduced if the matrix changes the instrument response to an analyte?
Since the components that make up the matrix are often complex, not completely known, and may vary from sample to sample, an external standard may not exhibit an identical matrix effect to that of the analyte.
Q22. As a group, brainstorm and describe a procedure that would allow you to account for a possible matrix effect on the measurement of iso-alpha-acids in beer. (Hint: how can you make the matrix of the standards more similar to that of the sample?)
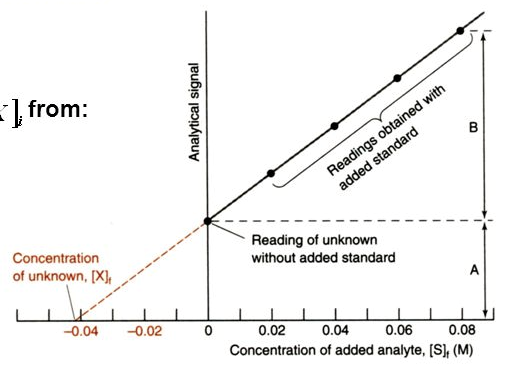
The standard addition method is similar to the external calibration method in that the concentration of an analyte is determined by comparison to a set of standard solutions of the analyte. However, in the standard addition method, increasing quantities of the standard are added directly to the sample to correct for matrix effects. This is called “spiking.” When plotted as analytical signal vs. concentration of analyte added, the concentration of the analyte is obtained by extrapolating back to the x-intercept, the absolute value of which gives the concentration of analyte in the sample. If the samples were diluted with some additional solvent (as is often the case), this dilution will have to be taken into account to determine the original analyte concentration in the sample.
A series of standard addition samples were prepared by adding increasing amounts of iso-humulone standard to 15 mL of beer and diluting to 25 mL total volume with water. After separating the components via liquid chromatography, the data in Table 3 was obtained for iso-humulone.
|
Iso-humulone added (analyte, ppm) |
Analyte peak area (mAU·s) |
|---|---|
|
0.0 |
90.3 |
|
15 |
219.6 |
|
46 |
531.7 |
|
79 |
823.6 |
|
113 |
1104.6 |
|
143 |
1459.9 |
|
177 |
1755.5 |
Table 3. Signal collected for beer samples spiked with various amounts of a iso-humulone standard.
Q23. Using the data in Table 3, construct a calibration curve and calculate the concentration of the iso-humulone in the original beer sample using the standard addition method described above.
Q24. Thinking back to the analysis of diacetyl in beer and your general chemistry knowledge, how would the amount of diacetyl in the headscape of the vial change if the amount of ethanol varied between beer samples? Explain.
Q25. If you anticipated that ethanol concentration may have in impact on the vapor pressure of diacetyl, could a standard addition be used to correct for this? Would an internal standard still be required?
References
- ASBC Methods of Analysis, online. Method Beer-25. Diacetyl. Approved 1958, rev. 2011. American Society of Brewing Chemists, St. Paul, MN, U.S.A.
- Baker, G. A.; Danenhower, T.M.; Force, L.J.; Petersen, K.J.; Betts, T.A. “HPLC Analysis of α- and β-Acids in Hops.” J. Chem. Educ. 2008, 85, 954-956.
- Barnes, S.; Thompson, D. “Concentration Calibration.” Analytical Sciences Digital Library, 2014. community.asdlib.org/activelearningmaterials/concentration-calibration/ Accessed July 2017.
- Jaskula, B.; Goiris, K.; Rouck, G.D.; Aerts, G.; Cooman, L.D. “Enhanced Quantitative Extraction and HPLC Determination of Hop and Beer Bitter Acids.” J. Inst. Brew. 2007. 113, 381 – 390.
- Krogerus, K.; Gibson, B.; Hytönen, E.; “An Improved Model for the Prediction of Wort Fermentation Progress and Total Diacetyl Profile.” J. Am. Soc. Brew. 2015, 73(1), 90-99.
- Schneider, S. “On-site Quality Control of Beer: Quantification of Isohumulones and Reduced Isohumulones Using the Agilent 1220 Infinity Mobile LC Solution.” Application Note, Food Testing & Agriculture. Agilent Technologies, Inc. Waldbronn, Germany.
Contributors and Attributions
- Dr. Rebecca A. Hunter, The Citadel (rhunter1@citadel.edu)
- The author would also like to thank Dr. Tom Wenzel, Bates College, and the ASDL workshop group members for their valuable feedback on this module.
- Sourced from the Analytical Sciences Digital Library