
Calibration Methods (Harris)
- Page ID
- 281067

For many analytical methods it is possible to run a series of standards, construct a calibration curve and then determine unknown samples from that curve. This is called external calibration. There are situations however where this approach does not work well.
A common problem that can occur in chemical analysis is known as a matrix effect. The matrix is everything else in the sample except the analyte. Components of the matrix may interact with the analyte and alter its response in the measurement technique. Matrix effects can sometimes enhance the response, whereas other times they can decrease the response. For example, when analyzing lead in soil there may be other chemicals present that will effect the signal for lead. Since the components that make up the soil matrix are often complex, not completely known, and possibly vary from sample to sample it would be impossible to replicate these matrix effects in an external standard.
Standard Addition Method
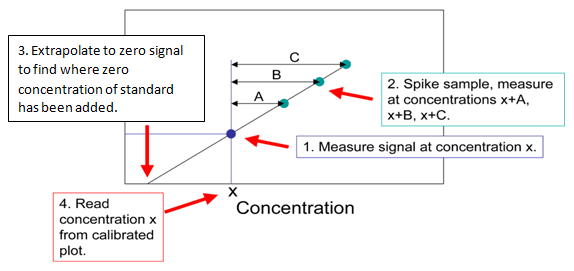
The standard addition method is similar to the external calibration method in that the concentration of an analyte is determined by comparison to a set of standard solutions of the analyte. However, in the standard addition method, the standard is added to the sample to correct for ‘matrix effects’ (a change in the analytical signal caused by anything in the sample other than the analyte). This is called “spiking.” This can be done for a single sample or for a calibration curve.
When using a calibration curve increasing amounts of analyte are added to a constant amount of sample. Then the concentration of the analyte is obtained by extrapolating back to the x-intercept; the absolute value of the x-intercept is the concentration of the unknown as shown below:
Lead in river sediment is measured using the technique of standard addition. The chart below shows the signal from the original sample and the signals obtained by adding increasing amounts of standard to the sample. The graph is shown below. Use the equation to answer the question below.
|
Concentration of Lead standard in the sample (ppb) |
Signal |
|---|---|
|
0 |
1.10 |
|
2 |
1.66 |
|
4 |
2.20 |
|
6 |
2.81 |
|
8 |
3.41 |
|
10 |
4.00 |
|
15 |
5.51 |
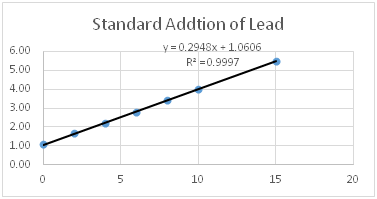
- Calculate the x-intercept of the graph shown (include units).
- What does the negative concentration you found in question 1 mean?
When standard addition is performed with only one sample, the sample is analyzed alone and then reanalyzed after the standard addition is preformed. Once the spike has been performed, the total concentration of the analyte (from the standard addition and from the sample) is directly proportional to concentration.
\[\dfrac{\textrm{Concentration of analyte in initial solution}}{\textrm{Concentration of analyte plus standard in final solution}} = \dfrac{\textrm{signal from initial solution}}{\textrm{signal from final solution}}\nonumber\]
\[\textit{Standard addition equation:} \hspace{40px} \dfrac{[X]_\textrm i}{[S]_\textrm f + [X]_\textrm f} = \dfrac{I_\textrm X}{I_\textrm{S+X}} \tag{5-7}\]
In the equation above X represents the concentration of analyte from the sample and S the concentration of analyte from the standard. It is important to remember that with standard addition these are chemically the same species. You also must keep in mind that when the standard addition solution is added to the sample the sample is diluted. The i subscript in the equation above stands for initial or the concentration of the analyte before the standard spike is made. The f stands for final which is the concentration after the spike has been added.
Researchers can use the amount of Strontium in tooth enamel found in archeological specimens to understand more about ancient cultures and diets. A 10.0 mL sample is prepared by dissolving 0.750 mg of tooth enamel and analyzed by atomic absorption spectroscopy. This analysis gives a signal of 28.0 units. Next 5.00 mL of the original sample is combined with 2.00 mL of standard strontium solution that has a concentration of 25 ng/mL. This new sample is diluted to a final volume of 10.00 mL and analyzed by AA spectroscopy. The sample with this standard addition has a signal of 42.8 units.
- What is the concentration (ng/mL) of Strontium from the standard addition spike in the second sample analyzed?
- Plug the given numbers and the number you calculated in question 3 in equation 5-7 and show it below.
At this point you have one equation with two unknowns so you can not solve it as is. However there is a relationship between [X]i and [X]f.
- Write an equation showing the relationship between [X]i and [X]f.
- Combine the equations from questions 4 and 5 to get an equation with only one unknown [X]i.
- What was the concentration of strontium (ng/mL) in the first sample analyze ([X]i)?
- What is the concentration (in ppm) of strontium in the tooth enamel analyzed?
Internal Standard Method
An internal standard (I.S.) in analytical chemistry is a substance that is similar to the analyte that is added in a constant amount to the blank, the standards, and the samples. Internal standards should be a primary standard just as external standards should. They are useful to compensate for changes in extraction efficiency, detector response due to sample loss during other sample preparation steps, fluctuations in sample analyzed, or changes in detector response due to different flow rates. Internal standards are widely used in chromatography because of differences in the reproducibility of sample injected into the chromatograph. All of these changes should affect the internal standard to the same degree as the analyte so that the ratio of the standard to analyte remains constant.
The fatty acid lauric acid (dodecanoic acid C12H24O2) is found in coconut oil and many other plants. It can be quantitated by gas chromatography. The method involves injecting a few microliters of each sample into the instrument. This is difficult to do precisely especially because the sample solvent is highly volatile and is evaporating as it is transferred from the sample vial to the instrument.
- Explain how the use of an internal standard can compensate for the variability in injection volume?
For the analysis of lauric acid the internal standard (nonanoic acid C9H19O2) is added to each sample.
The response factor or response ratio (F) controls for the fact that the internal standard is chemically different than the analyte and may a respond differently to the assay. F can be calculated using the following equation a:
\[\dfrac{Ax}{[X]}=F\left(\dfrac{As}{[S]}\right)\nonumber\]
Where [X] and [S] are the concentrations of X and S in moles per liter and Ax and As represent the response of the analyte and the standard respectively.
- A standard solution is prepared by combining 2.00 mL of a 0.100 M lauric acid standard and 4.00 mL of a 0.100 M nonanoic acid and diluting the 10.00 mL. The sample is analyzed by GC and a signal of 5467 counts is obtained for the nonanoic acid and 8675 counts for the lauric acid. What are the concentrations of the two chemicals in the sample?
- Use the equation above to calculate the response factor (F) for this assay.
- Based on your value for F, is this assay more sensitive for Lauric or nonanoic acid? Explain.
- 4.00 mL of the 0.100 M nonanoic acid was combined with 4.00 mL of a sample containing an unknown lauric acid concentration. The sample was diluted to 10.00 mL and analyzed by GC. The analysis gave a peak with 7654 counts for nonanoic acid and 7922 counts for lauric acid. What is the concentration of lauric acid in the injected sample?
- What is the concentration of lauric acid in the undiluted unknown lauric acid solution?
Contributors and Attributions
- Amanda Harris, Virginia Commonwealth University (harrisal@vcu.edu)
- Sourced from the Analytical Sciences Digital Library