
Internal Standard
- Page ID
- 280724

When the instrumental signal or experimental procedure may produce changes in the results, an internal standard may be used to compensate for those problems. This method is based on the fact that the ratio of concentration between the internal standard and the analyte remains constant, even when instrument drift or sample is lost during treatment or not completely introduced in the instrument, for example. Under those circumstances, both the sample and the internal standard are lost, but the ratio of concentrations (analyte concentration / internal standard concentration) remain the constant, and so the ratio of signals remain constant (analyte signal/internal standard signal).
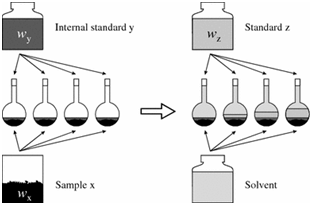
To use the internal standard method:
- Solutions of known concentration of the analyte are prepared (standards z).
- To each of those standards a known and similar amount of the internal standard solution
- Similar amount of the internal standard is added to the samples too.
- Volume is completed with the solvent.
- Instrumental signal of the analyte and the internal standard are recorded.
- Ratio of analyte signal/internal standard signal are plotted against the concentration of the analyte in the standard solutions.
- Ratio of analyte signal in the sample / internal standard is calculated.
- A linear equation (y=mx + b) is obtained. Concentration of the analyte is calculated by solving for x when y is the ratio of analyte signal/internal standard signal in the unknown sample
- Either one standard or several standards, to create a calibration curve, may be used.
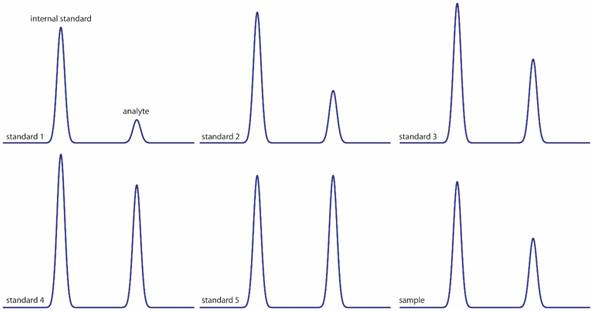
The previous image shows six chromatograms of two compounds for a calibration curve with an internal standard.
- The first peak is the internal standard. What happens to its height through the figures?
- The second peak is the one for the analyte. What happens to its height through the figures?
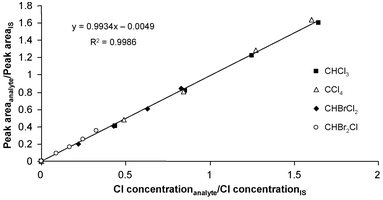
When plotting the peak area of the analyte divided by the peak area of the internal standard (IS), vs the concentration of the analyte divided the concentration of the internal standard, a calibration curve is obtained.
Internal Standard – one point
- Another spectrophotometric method for the determination of Pb2+ in blood uses Cu2+ as internal standard. A standard with 1.75 ppb Pb2+ and 2.25 of Cu2+ gives a signal ratio of 2.37. A blood sample, to which the same amount of internal standard was added, gave a SA/SEI of 1.80.
- Which compound is the internal standard? Which one is the analyte standard?
- Should you add the same amount of internal standard to the sample?
- What advantages does this calibration method have when compared to a direct calibration?
- What disadvantages does this calibration method have when compared calibration?
- When would you recommend using an internal standard calibration?
- What characteristics should the internal standard have?
- What is the concentration of lead in the blood sample?
- Could you use the same results for the standard with the internal standard ratio for other blood samples?
- Which compound is the internal standard? Which one is the analyte standard?
ADDITIONAL EXERCISE…
- In a chromatographic analysis, a solution was prepared with 0.0837 M Octane (A) and 0.0666 M nonane (B). Each one produced a peak area of AA = 423 and AB = 347.
10.0 ml of 0.146 M nonane was added to 10 ml of an unknown sample, and the sample diluted to 25 ml. The peak areas obtained were: AA = 553 and AB = 582.
- Which one is the internal standard? Octane or Nonane?
- What is the concentration of Octane in the unknown sample?
- Which one is the internal standard? Octane or Nonane?

Internal Standard – Multiple standard solutions – calibration curve
- Another spectrophotometric method to determine Pb2+ in blood uses a calibration curve with internal standard. Several solutions were prepared with different concentrations of Pb2+, the same amount of internal standard Cu2+ was added to each one. A calibration curve was obtained:
\[\dfrac{S_\textrm A}{S_\textrm{EI}}=2.11\: ppb^{-1}\times C_A-0.006 \nonumber\]
When the same amount of internal standard was added to the sample, the ratio of signals was: SA/SEI of 2.80.
-
What is the concentration of lead in the blood sample?
- What advantages does this calibration method have when compared to other calibration methods?
- What disadvantages does this calibration method have when compared to other calibration methods?
- Could you use the results of the calibration curve for other blood samples? What would you need to do to those new samples?
-