
Acids and Bases
- Page ID
- 282034

\( \newcommand{\vecs}[1]{\overset { \scriptstyle \rightharpoonup} {\mathbf{#1}} } \)
\( \newcommand{\vecd}[1]{\overset{-\!-\!\rightharpoonup}{\vphantom{a}\smash {#1}}} \)
\( \newcommand{\id}{\mathrm{id}}\) \( \newcommand{\Span}{\mathrm{span}}\)
( \newcommand{\kernel}{\mathrm{null}\,}\) \( \newcommand{\range}{\mathrm{range}\,}\)
\( \newcommand{\RealPart}{\mathrm{Re}}\) \( \newcommand{\ImaginaryPart}{\mathrm{Im}}\)
\( \newcommand{\Argument}{\mathrm{Arg}}\) \( \newcommand{\norm}[1]{\| #1 \|}\)
\( \newcommand{\inner}[2]{\langle #1, #2 \rangle}\)
\( \newcommand{\Span}{\mathrm{span}}\)
\( \newcommand{\id}{\mathrm{id}}\)
\( \newcommand{\Span}{\mathrm{span}}\)
\( \newcommand{\kernel}{\mathrm{null}\,}\)
\( \newcommand{\range}{\mathrm{range}\,}\)
\( \newcommand{\RealPart}{\mathrm{Re}}\)
\( \newcommand{\ImaginaryPart}{\mathrm{Im}}\)
\( \newcommand{\Argument}{\mathrm{Arg}}\)
\( \newcommand{\norm}[1]{\| #1 \|}\)
\( \newcommand{\inner}[2]{\langle #1, #2 \rangle}\)
\( \newcommand{\Span}{\mathrm{span}}\) \( \newcommand{\AA}{\unicode[.8,0]{x212B}}\)
\( \newcommand{\vectorA}[1]{\vec{#1}} % arrow\)
\( \newcommand{\vectorAt}[1]{\vec{\text{#1}}} % arrow\)
\( \newcommand{\vectorB}[1]{\overset { \scriptstyle \rightharpoonup} {\mathbf{#1}} } \)
\( \newcommand{\vectorC}[1]{\textbf{#1}} \)
\( \newcommand{\vectorD}[1]{\overrightarrow{#1}} \)
\( \newcommand{\vectorDt}[1]{\overrightarrow{\text{#1}}} \)
\( \newcommand{\vectE}[1]{\overset{-\!-\!\rightharpoonup}{\vphantom{a}\smash{\mathbf {#1}}}} \)
\( \newcommand{\vecs}[1]{\overset { \scriptstyle \rightharpoonup} {\mathbf{#1}} } \)
\( \newcommand{\vecd}[1]{\overset{-\!-\!\rightharpoonup}{\vphantom{a}\smash {#1}}} \)
\(\newcommand{\avec}{\mathbf a}\) \(\newcommand{\bvec}{\mathbf b}\) \(\newcommand{\cvec}{\mathbf c}\) \(\newcommand{\dvec}{\mathbf d}\) \(\newcommand{\dtil}{\widetilde{\mathbf d}}\) \(\newcommand{\evec}{\mathbf e}\) \(\newcommand{\fvec}{\mathbf f}\) \(\newcommand{\nvec}{\mathbf n}\) \(\newcommand{\pvec}{\mathbf p}\) \(\newcommand{\qvec}{\mathbf q}\) \(\newcommand{\svec}{\mathbf s}\) \(\newcommand{\tvec}{\mathbf t}\) \(\newcommand{\uvec}{\mathbf u}\) \(\newcommand{\vvec}{\mathbf v}\) \(\newcommand{\wvec}{\mathbf w}\) \(\newcommand{\xvec}{\mathbf x}\) \(\newcommand{\yvec}{\mathbf y}\) \(\newcommand{\zvec}{\mathbf z}\) \(\newcommand{\rvec}{\mathbf r}\) \(\newcommand{\mvec}{\mathbf m}\) \(\newcommand{\zerovec}{\mathbf 0}\) \(\newcommand{\onevec}{\mathbf 1}\) \(\newcommand{\real}{\mathbb R}\) \(\newcommand{\twovec}[2]{\left[\begin{array}{r}#1 \\ #2 \end{array}\right]}\) \(\newcommand{\ctwovec}[2]{\left[\begin{array}{c}#1 \\ #2 \end{array}\right]}\) \(\newcommand{\threevec}[3]{\left[\begin{array}{r}#1 \\ #2 \\ #3 \end{array}\right]}\) \(\newcommand{\cthreevec}[3]{\left[\begin{array}{c}#1 \\ #2 \\ #3 \end{array}\right]}\) \(\newcommand{\fourvec}[4]{\left[\begin{array}{r}#1 \\ #2 \\ #3 \\ #4 \end{array}\right]}\) \(\newcommand{\cfourvec}[4]{\left[\begin{array}{c}#1 \\ #2 \\ #3 \\ #4 \end{array}\right]}\) \(\newcommand{\fivevec}[5]{\left[\begin{array}{r}#1 \\ #2 \\ #3 \\ #4 \\ #5 \\ \end{array}\right]}\) \(\newcommand{\cfivevec}[5]{\left[\begin{array}{c}#1 \\ #2 \\ #3 \\ #4 \\ #5 \\ \end{array}\right]}\) \(\newcommand{\mattwo}[4]{\left[\begin{array}{rr}#1 \amp #2 \\ #3 \amp #4 \\ \end{array}\right]}\) \(\newcommand{\laspan}[1]{\text{Span}\{#1\}}\) \(\newcommand{\bcal}{\cal B}\) \(\newcommand{\ccal}{\cal C}\) \(\newcommand{\scal}{\cal S}\) \(\newcommand{\wcal}{\cal W}\) \(\newcommand{\ecal}{\cal E}\) \(\newcommand{\coords}[2]{\left\{#1\right\}_{#2}}\) \(\newcommand{\gray}[1]{\color{gray}{#1}}\) \(\newcommand{\lgray}[1]{\color{lightgray}{#1}}\) \(\newcommand{\rank}{\operatorname{rank}}\) \(\newcommand{\row}{\text{Row}}\) \(\newcommand{\col}{\text{Col}}\) \(\renewcommand{\row}{\text{Row}}\) \(\newcommand{\nul}{\text{Nul}}\) \(\newcommand{\var}{\text{Var}}\) \(\newcommand{\corr}{\text{corr}}\) \(\newcommand{\len}[1]{\left|#1\right|}\) \(\newcommand{\bbar}{\overline{\bvec}}\) \(\newcommand{\bhat}{\widehat{\bvec}}\) \(\newcommand{\bperp}{\bvec^\perp}\) \(\newcommand{\xhat}{\widehat{\xvec}}\) \(\newcommand{\vhat}{\widehat{\vvec}}\) \(\newcommand{\uhat}{\widehat{\uvec}}\) \(\newcommand{\what}{\widehat{\wvec}}\) \(\newcommand{\Sighat}{\widehat{\Sigma}}\) \(\newcommand{\lt}{<}\) \(\newcommand{\gt}{>}\) \(\newcommand{\amp}{&}\) \(\definecolor{fillinmathshade}{gray}{0.9}\)Acids and Bases
Reading and Homework: separated by type below
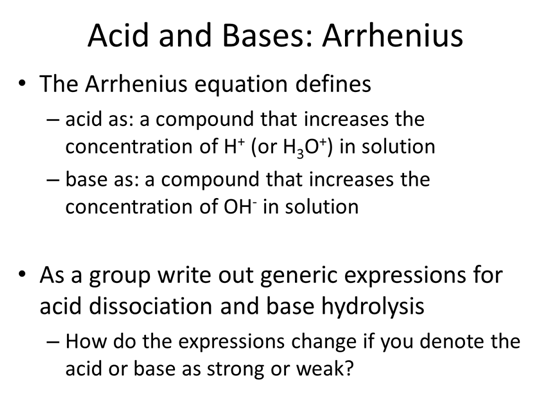
- As a group write out generic expressions for acid dissociation and base hydrolysis including the appropriate equilibrium expression
- How do the expressions change if you denote the acid or base as strong or weak?
STOP
Strong Acid or Strong Base
Reading: Chapter 8 (sections 1-4), Chapter 10 (sections 1, 4), Exploring Chemical Analysis 5th ed., D. Harris
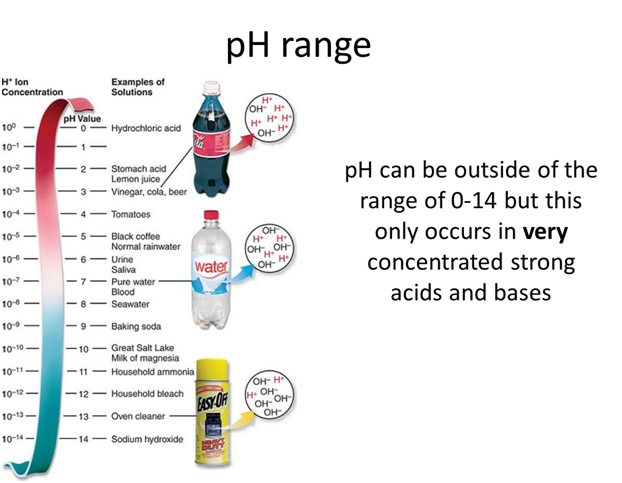
- What is the pH of concentrated (11.6 M) hydrochloric acid?
STOP
Through the rest of this unit we are going to use an online tool to help us remember what we know about acid-base titrations and expand our understanding to more complex systems. It is important that one person in the group brings a laptop or tablet capable of running the website.
- Open a browser for your group and navigate to https://dthdpu.shinyapps.io/TitrationApp/
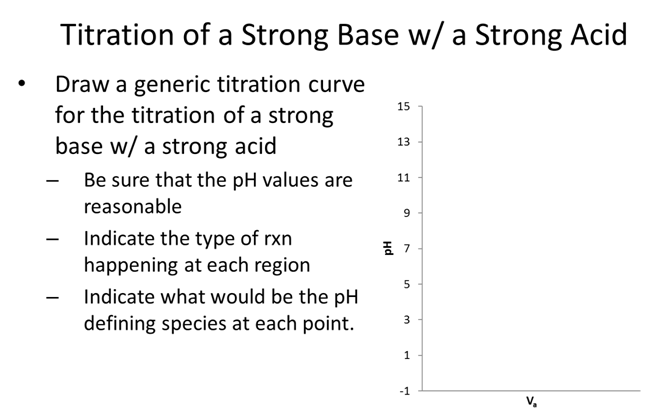
- Write a generic equation representing the titration of a strong acid with a strong base.
- Click on Investigation 1
- Uncheck the [titrant] = initial [analyte] box under Titrant before proceeding
- Monitor the change in the titration curve of a strong acid with a strong base and explain the effect of changing the following variables with the slider on the curve. Remember that you should only change one variable at a time.
- Initial analyte concentration (M)
- Titrant concentration (M)
- Initial volume (mL)
- Initial analyte concentration (M)
- Which indicators are suitable for the titration of a strong acid with a strong base?
- How does the titration curve change if the analyte is changed from a strong acid to a strong base?
STOP
- Use the website first to determine the answer to the following questions and then prove them mathematically. Be sure to write the relevant rxn for each of the 3 regions of the titration curve.
- How many mL of 0.05 M NaOH are needed to reach equivalence of the titration of 20 mL 0.01 M HCl?
\(\begin{array}{c}
&\textrm{website}\\
&\begin{array}{|c|}
\hline
\hspace{150px} \\ \\ \\
\hline\end{array}
\end{array}\)
- What pH would be observed at the equivalence point and what is the rxn occurring in the flask?
\(\begin{array}{c}
&\textrm{website}\\
&\begin{array}{|c|}
\hline
\hspace{150px} \\ \\ \\
\hline\end{array}
\end{array}\)
- What is the pH at 2 mL of NaOH added and what is the rxn occurring in the flask?
\(\begin{array}{c}
&\textrm{website}\\
&\begin{array}{|c|}
\hline
\hspace{150px} \\ \\ \\
\hline\end{array}
\end{array}\)
- What is the pH at 6 mL of NaOH added and what is the rxn occurring in the flask?
\(\begin{array}{c}
&\textrm{website}\\
&\begin{array}{|c|}
\hline
\hspace{150px} \\ \\ \\
\hline\end{array}
\end{array}\)
STOP
- Draw the titration curve

- Which indicator would be suitable for this titration?
- How many mL of 0.05 M NaOH are needed to reach equivalence of the titration of 20 mL 0.01 M HCl?
- What is the pH of water (by calc. not memory)?
\[H_2O ⇌ H^+ + OH^- \hspace{20px} K_a=1.0 × 10^{-14}\nonumber\]
STOP
Weak Acid or Weak Base
Reading: Chapter 8 (sections 5-7)
Homework: Chapter 8: 10, 11, 14-16, 19-23, 25, 28, 30, 32, 33
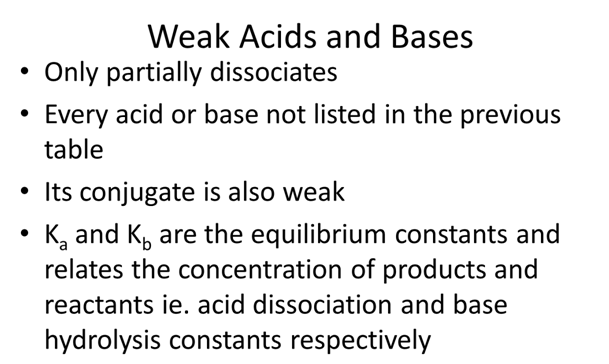
- What is the pH of 0.100 M formic acid solution, Ka= 1.80×10⁻⁴?
STOP
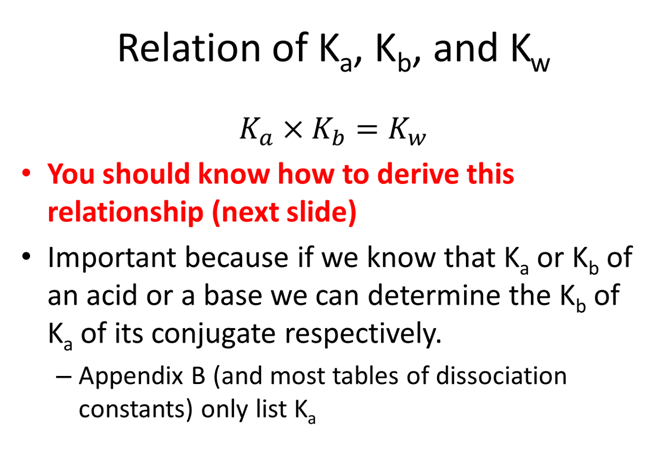
- NH4+ Ka=5.7×10⁻¹⁰ what is Kb for NH3?
STOP
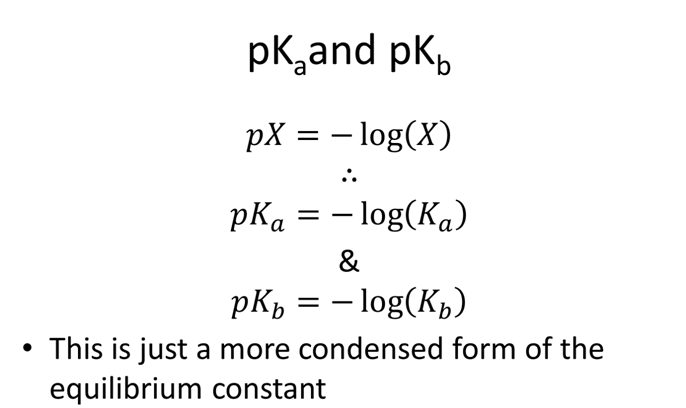
- Which acid is stronger dichloroacetic, Ka=8.00x10⁻², or chloroacetic, Ka=1.36x10⁻³? How does Ka and pKa relate to strength?
STOP
- Find pKa of a weak acid 0.063 M hydrobenzene with a pH=5.60.
STOP
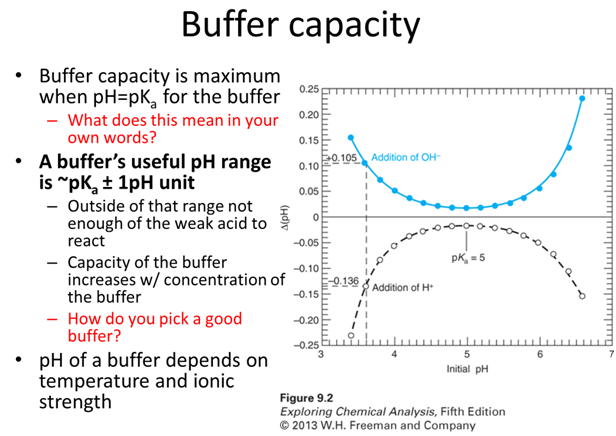
Buffers
Reading: Chapter 9 (sections 1-6), Exploring Chemical Analysis 5th ed., D. Harris
- How would your group define a buffer?
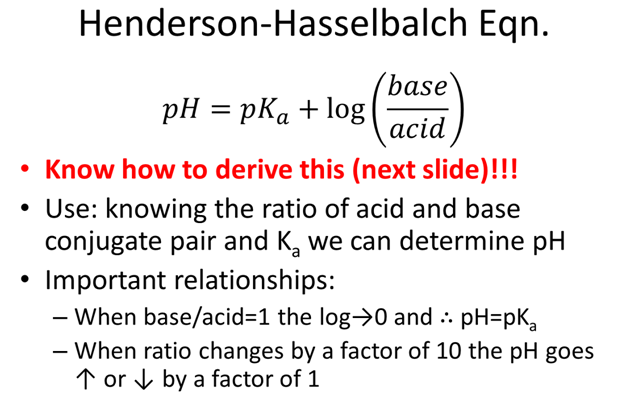
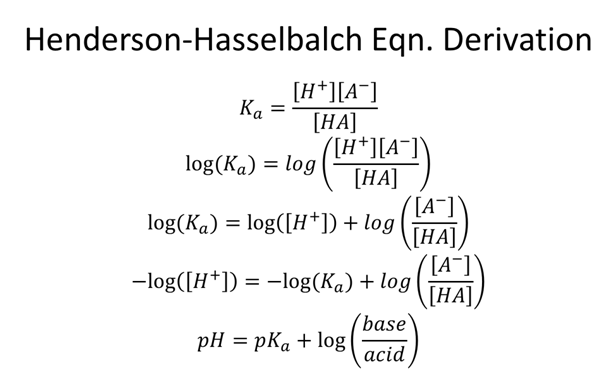
- What ratio of [A-]/[HA] will create an acetic acid (Ka=1.75x10⁻⁵) buffer with a pH=5.0?
STOP
- A buffer is made with 2.402 g of acetic acid (Ka=1.75x10⁻⁵, FW: 60.05) and 3.247 g of its conjugate, acetate ion (FW: 59.04), in 5L H2O what is the pH?
STOP

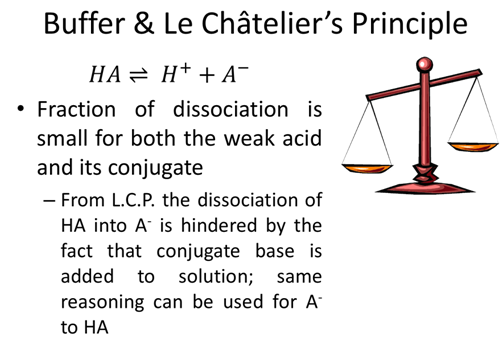
- What happens if a strong acid is added to a buffer soln.?
\[HA ⇌ H^+ + A^- \nonumber\]
- What happens if a strong base is added to a buffer soln.?
\[B + H_2O ⇌ BH^+ + OH^- \nonumber\]
STOP
- Add 1.276 g HCl (FW: 36.4609) to the acetic acid buffer example on the previous page and calculate the new pH. (*hint: ice table)
- How does this relate to the pH before strong acid is added? What would the pH be if 1.276 g HCl was added to water without the buffer solution?
STOP
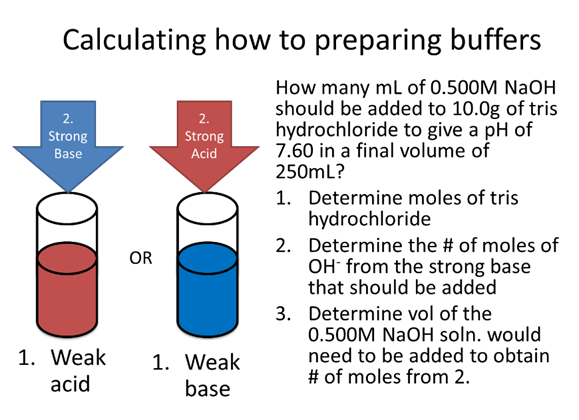
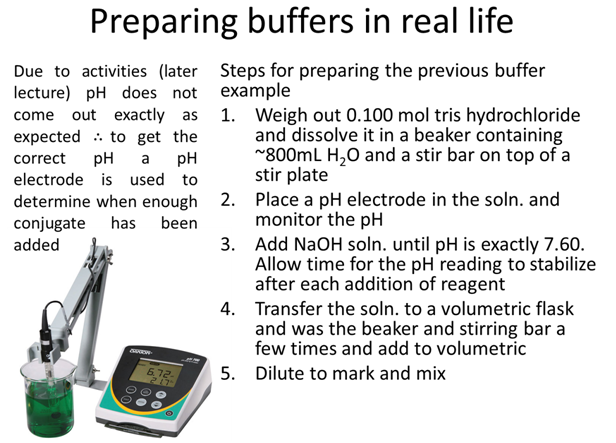
- How many mL of 0.500M NaOH should be added to 10.0g of tris hydrochloride (pKa=8.07, FW=157.60g/mol) to give a pH of 7.60 in a final volume of 250mL?
STOP
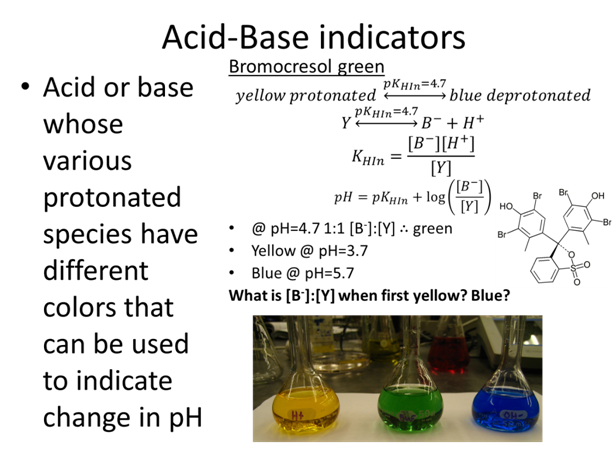
- Yellow @ pH=3.7
- What is [B-]:[Y] when first yellow?
- Blue @ pH=5.7
- What is [B-]:[Y] when first blue?
STOP
Quantitative Analysis: Titrations
The rest of this unit will focus on the use of titrations to determine the quantity of an analyte. That will include acid-base with one equivalence point (monoprotic), acid-base with several equivalence points (polyprotic), and EDTA titrations. Along the way we will also consider how equilibrium can be affected by the presence of different ions.
Learning Objectives
By the end of this students should be able to:
- Perform calculations to determine the quantity of an analyte via the following types of titrations: acid-base monoprotic and polyprotic and EDTA.
- Determine the fractional composition of a system and be able to display that understanding in a principle species diagram.
- Explain the concept of activities and the effect on equilibrium.
- Calculate the activity of ions.
Monoprotic Titrations
Reading: Chapter 10 (sections 1-5), Exploring Chemical Analysis 5th ed., D. Harris
We are going to combine everything we reviewed in the last few chapters on acids, bases, and buffers to determine the quantity of an unknown acid or base. For some of you this chapter will seem so familiar the tendency will be to not practice. However, we are going to do polyprotic titration in the next chapter so you need to be rock solid on this material! So practice practice practice!
We are going to generate a titration curve for each type of titration
- Weak acid with strong base
- Weak base with strong acid
Titration of Weak Acid w/ Strong Base (pg 210-213)
- Open a browser for your group and navigate to https://dthdpu.shinyapps.io/TitrationApp/
- Write a generic equation representing the titration of a weak acid with a strong base.
- Click on Investigation 2
- Uncheck the [titrant] = initial [analyte] box under Titrant before proceeding
- Monitor the change in the titration curve of a weak acid with a strong base and explain the effect of changing the following variables with the slider on the curve. Remember that you should only change one variable at a time.
- pKa
- Initial analyte concentration (M)
- Titrant concentration (M)
- Initial volume (mL)
- pKa
- Why was pKa considered a variable for a weak-strong titration but not a strong-strong?
- How does the titration curve change if the analyte is changed from a weak acid to a weak base?
STOP
- Use the website first to determine the answer to the following questions and then prove them mathematically. Be sure to write the relevant rxn for each of the 3 regions of the titration curve.
- Generate the titration curve for the titration of 25.00 mL of 0.20 M HF (Ka = 6.6×10⁻⁴) with 0.15 M NaOH.
- How many mL of 0.15 M NaOH are needed to reach equivalence of the titration of 25.00 mL 0.20 M HF?
\(\begin{array}{c}
&\textrm{website}\\
&\begin{array}{|c|}
\hline
\hspace{150px} \\ \\ \\
\hline\end{array}
\end{array}\)
- What pH would be observed at the equivalence point and what is the rxn occurring in the flask?
\(\begin{array}{c}
&\textrm{website}\\
&\begin{array}{|c|}
\hline
\hspace{150px} \\ \\ \\
\hline\end{array}
\end{array}\)
- What is the pH at 20 mL of NaOH added and what is the rxn occurring in the flask?
\(\begin{array}{c}
&\textrm{website}\\
&\begin{array}{|c|}
\hline
\hspace{150px} \\ \\ \\
\hline\end{array}
\end{array}\)
- What is the pH at 60 mL of NaOH added and what is the rxn occurring in the flask?
\(\begin{array}{c}
&\textrm{website}\\
&\begin{array}{|c|}
\hline
\hspace{150px} \\ \\ \\
\hline\end{array}
\end{array}\)
STOP
- Draw the titration curve
- Which indicator would be suitable for this titration?
STOP
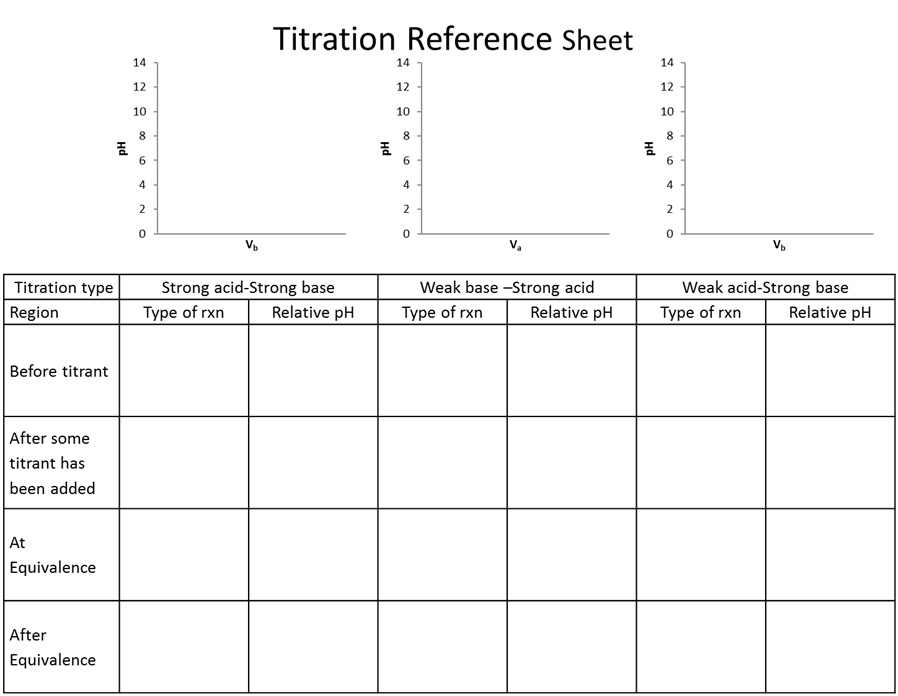
- Fill out table
- How many mL of 0.15 M NaOH are needed to reach equivalence of the titration of 25.00 mL 0.20 M HF?
| Region | pH defining species and type of rxn |
|---|---|
| Before any titrant | |
| Before eq. pt. | |
| At eq. pt. | |
| After eq. pt. |
Titration of Weak Base w/ Strong Acid (pg 214-215)
| Region | pH defining species and type of rxn |
|---|---|
| Before any titrant | |
| Before eq. pt. | |
| At eq. pt. | |
| After eq. pt. |
- Based on what we just learned can we predict the 4 regions and draw the curve?
Polyprotic Titrations
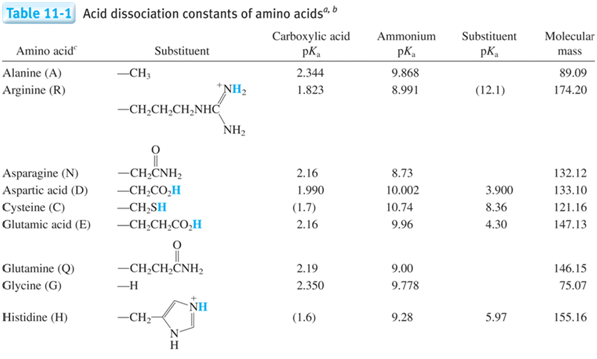
Reading: Chapter 11 (sections 1,2, 4), Exploring Chemical Analysis 5th ed., D. Harris
Many molecules have many proton donor or acceptor sites (such as amino acids and thus proteins!). Therefore, we need to know how they react, what can we know about concentrations when we know pH, and what would a titration look like. Often in biochemistry you will not look at the full titration only a piece, but you can’t understand a part unless you understand the whole!
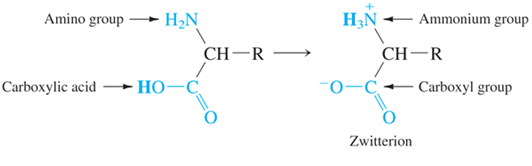
- There is a pKa for both groups on the molecule (amino acid in this case), which group is going to act more like and acid and therefore which should have a lower pKa?
STOP
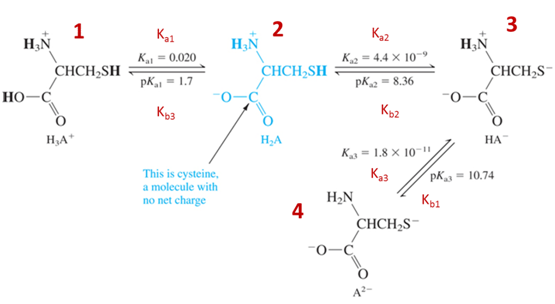
- Which species above is the strongest acid? \(\underset{\textrm{circle one}}{\underline{\textrm{1, 2, 3, or 4}}}\)
- Which species above is the strongest base? \(\underset{\textrm{circle one}}{\underline{\textrm{1, 2, 3, or 4}}}\)
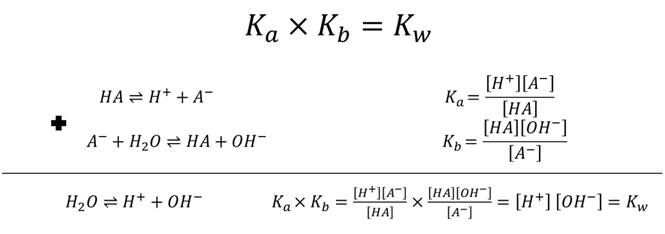
- What is the corresponding relation when you have multiple Ka and Kb such as polyprotic systems?
- Derive the relation between K1a, K3b, and Kw.
STOP
- Click on Investigation 3
- Uncheck the [titrant] = initial [analyte] box under Titrant before proceeding
- Monitor the change in the titration curve of a diprotic weak acid with a strong base and explain the effect of changing the following variables with the slider on the curve. Remember that you should only change one variable at a time.
- pKa1
- pKa2
- Initial analyte concentration (M)
- Titrant concentration (M)
- Initial volume (mL)
- pKa1
- Why do we need to consider more than 1 pKa for a polyprotic titration?
- How does the titration curve change if the analyte is changed from a weak acid to a weak base?
STOP
- Draw a generic titration curve H2A+ with a strong base
Regions where we will identify the pH and the volume:
- Initial
- @ all equivalence points
- @ ½ each equivalence point
- Any point in a buffer region
- After the last equivalence point
- Use the website first to determine the answer to the following questions and then prove them mathematically. Be sure to write the relevant rxn for each region of the titration curve.
- Generate the titration curve for the titration of 10 mL of 0.200 M alanine (pKa1 = 2.344, pKa2 = 9.868) with 0.100 M NaOH by walking through the following questions.
- What is the pH before any base is added?
Initially (before any base added) the pH defining rxn is
\(\begin{array}{c}
&\textrm{website}\\
&\begin{array}{|c|}
\hline
\hspace{150px} \\ \\ \\
\hline\end{array}
\end{array}\)
- What is the volume to the 1st and 2nd equivalence?
\(\begin{array}{c}
&\textrm{website}\\
&\begin{array}{|c|}
\hline
\hspace{150px} \\ \\ \\
\hline\end{array}
\end{array}\)
- What is the pH at the first equivalence point?
At the first equivalence point the pH is defined by \(\underset{fill\: in}{\underline{\hspace{200px}}}\) and the approximation \(\underset{fill\: in}{\underline{\hspace{200px}}}\).
\(\begin{array}{c}
&\textrm{website}\\
&\begin{array}{|c|}
\hline
\hspace{150px} \\ \\ \\
\hline\end{array}
\end{array}\)
- What is the pH at the last equivalence point?
At the last equivalence points the pH is defined by \(\underset{fill\: in}{\underline{\hspace{200px}}}\).
\(\begin{array}{c}
&\textrm{website}\\
&\begin{array}{|c|}
\hline
\hspace{150px} \\ \\ \\
\hline\end{array}
\end{array}\) - What is the pH at halfway to each equivalence point?
½ way to each equivalence point the pH is defined by \(\underset{fill\: in}{\underline{\hspace{200px}}}\) and the approximation \(\underset{fill\: in}{\underline{\hspace{200px}}}\).
\(\begin{array}{c}
&\textrm{website}\\
&\begin{array}{|c|}
\hline
\hspace{150px} \\ \\ \\
\hline\end{array}
\end{array}\)
- What is the pH after 23.00 mL of NaOH has been added?
Any point before an equivalence point the pH is defined by \(\underset{fill\: in}{\underline{\hspace{200px}}}\).
\(\begin{array}{c}
&\textrm{website}\\
&\begin{array}{|c|}
\hline
\hspace{150px} \\ \\ \\
\hline\end{array}
\end{array}\)
- What is the pH after \(\underset{insert\: volume}{\underline{\hspace{100px} mL}}\) of NaOH has been added?
Any point after the last equivalence point the pH is defined by \(\underset{fill\: in}{\underline{\hspace{200px}}}\).
\(\begin{array}{c}
&\textrm{website}\\
&\begin{array}{|c|}
\hline
\hspace{150px} \\ \\ \\
\hline\end{array}
\end{array}\)
- What is the pH before any base is added?
From last semester’s second exam; worth 25% of the exam
Titration of 12.00 mL of fumaric acid requires 26.00 mL of 0.0300 M potassium hydroxide to reach the first equivalence point.
Disregard significant figures and give all pH and volumes values with 2 decimal places.
Fill in the empty boxes on the titration curve and show the work in the space provided on this page and the next with the corresponding letter. A value provided without sufficient work shown will receive no credit.
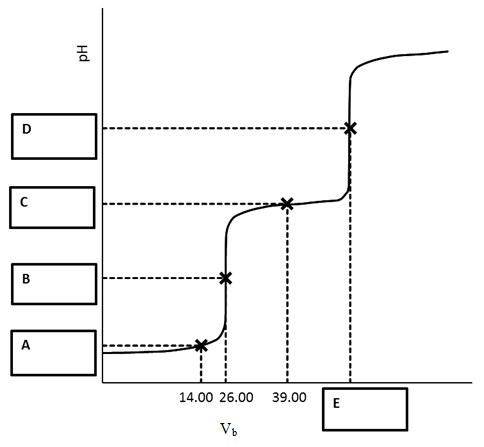
- pH at A
- pH at B
- pH at C
- pH at D
- Volume at E
Contributors and Attributions
- Allyson Fry-Petit, California State University Fullerton (afry@fullerton.edu)
- NOTE: This exercise is a modification of a module on the Active Learning site titled Designing an Acid-Base Titration written by David Harvey. http://community.asdlib.org/activelearningmaterials/designing-an-acid-base-titration/
- Sourced from the Analytical Sciences Digital Library