
Mass Spectrometry: Fruit Fly Proteomics and Aging
- Page ID
- 89048

\( \newcommand{\vecs}[1]{\overset { \scriptstyle \rightharpoonup} {\mathbf{#1}} } \)
\( \newcommand{\vecd}[1]{\overset{-\!-\!\rightharpoonup}{\vphantom{a}\smash {#1}}} \)
\( \newcommand{\dsum}{\displaystyle\sum\limits} \)
\( \newcommand{\dint}{\displaystyle\int\limits} \)
\( \newcommand{\dlim}{\displaystyle\lim\limits} \)
\( \newcommand{\id}{\mathrm{id}}\) \( \newcommand{\Span}{\mathrm{span}}\)
( \newcommand{\kernel}{\mathrm{null}\,}\) \( \newcommand{\range}{\mathrm{range}\,}\)
\( \newcommand{\RealPart}{\mathrm{Re}}\) \( \newcommand{\ImaginaryPart}{\mathrm{Im}}\)
\( \newcommand{\Argument}{\mathrm{Arg}}\) \( \newcommand{\norm}[1]{\| #1 \|}\)
\( \newcommand{\inner}[2]{\langle #1, #2 \rangle}\)
\( \newcommand{\Span}{\mathrm{span}}\)
\( \newcommand{\id}{\mathrm{id}}\)
\( \newcommand{\Span}{\mathrm{span}}\)
\( \newcommand{\kernel}{\mathrm{null}\,}\)
\( \newcommand{\range}{\mathrm{range}\,}\)
\( \newcommand{\RealPart}{\mathrm{Re}}\)
\( \newcommand{\ImaginaryPart}{\mathrm{Im}}\)
\( \newcommand{\Argument}{\mathrm{Arg}}\)
\( \newcommand{\norm}[1]{\| #1 \|}\)
\( \newcommand{\inner}[2]{\langle #1, #2 \rangle}\)
\( \newcommand{\Span}{\mathrm{span}}\) \( \newcommand{\AA}{\unicode[.8,0]{x212B}}\)
\( \newcommand{\vectorA}[1]{\vec{#1}} % arrow\)
\( \newcommand{\vectorAt}[1]{\vec{\text{#1}}} % arrow\)
\( \newcommand{\vectorB}[1]{\overset { \scriptstyle \rightharpoonup} {\mathbf{#1}} } \)
\( \newcommand{\vectorC}[1]{\textbf{#1}} \)
\( \newcommand{\vectorD}[1]{\overrightarrow{#1}} \)
\( \newcommand{\vectorDt}[1]{\overrightarrow{\text{#1}}} \)
\( \newcommand{\vectE}[1]{\overset{-\!-\!\rightharpoonup}{\vphantom{a}\smash{\mathbf {#1}}}} \)
\( \newcommand{\vecs}[1]{\overset { \scriptstyle \rightharpoonup} {\mathbf{#1}} } \)
\(\newcommand{\longvect}{\overrightarrow}\)
\( \newcommand{\vecd}[1]{\overset{-\!-\!\rightharpoonup}{\vphantom{a}\smash {#1}}} \)
\(\newcommand{\avec}{\mathbf a}\) \(\newcommand{\bvec}{\mathbf b}\) \(\newcommand{\cvec}{\mathbf c}\) \(\newcommand{\dvec}{\mathbf d}\) \(\newcommand{\dtil}{\widetilde{\mathbf d}}\) \(\newcommand{\evec}{\mathbf e}\) \(\newcommand{\fvec}{\mathbf f}\) \(\newcommand{\nvec}{\mathbf n}\) \(\newcommand{\pvec}{\mathbf p}\) \(\newcommand{\qvec}{\mathbf q}\) \(\newcommand{\svec}{\mathbf s}\) \(\newcommand{\tvec}{\mathbf t}\) \(\newcommand{\uvec}{\mathbf u}\) \(\newcommand{\vvec}{\mathbf v}\) \(\newcommand{\wvec}{\mathbf w}\) \(\newcommand{\xvec}{\mathbf x}\) \(\newcommand{\yvec}{\mathbf y}\) \(\newcommand{\zvec}{\mathbf z}\) \(\newcommand{\rvec}{\mathbf r}\) \(\newcommand{\mvec}{\mathbf m}\) \(\newcommand{\zerovec}{\mathbf 0}\) \(\newcommand{\onevec}{\mathbf 1}\) \(\newcommand{\real}{\mathbb R}\) \(\newcommand{\twovec}[2]{\left[\begin{array}{r}#1 \\ #2 \end{array}\right]}\) \(\newcommand{\ctwovec}[2]{\left[\begin{array}{c}#1 \\ #2 \end{array}\right]}\) \(\newcommand{\threevec}[3]{\left[\begin{array}{r}#1 \\ #2 \\ #3 \end{array}\right]}\) \(\newcommand{\cthreevec}[3]{\left[\begin{array}{c}#1 \\ #2 \\ #3 \end{array}\right]}\) \(\newcommand{\fourvec}[4]{\left[\begin{array}{r}#1 \\ #2 \\ #3 \\ #4 \end{array}\right]}\) \(\newcommand{\cfourvec}[4]{\left[\begin{array}{c}#1 \\ #2 \\ #3 \\ #4 \end{array}\right]}\) \(\newcommand{\fivevec}[5]{\left[\begin{array}{r}#1 \\ #2 \\ #3 \\ #4 \\ #5 \\ \end{array}\right]}\) \(\newcommand{\cfivevec}[5]{\left[\begin{array}{c}#1 \\ #2 \\ #3 \\ #4 \\ #5 \\ \end{array}\right]}\) \(\newcommand{\mattwo}[4]{\left[\begin{array}{rr}#1 \amp #2 \\ #3 \amp #4 \\ \end{array}\right]}\) \(\newcommand{\laspan}[1]{\text{Span}\{#1\}}\) \(\newcommand{\bcal}{\cal B}\) \(\newcommand{\ccal}{\cal C}\) \(\newcommand{\scal}{\cal S}\) \(\newcommand{\wcal}{\cal W}\) \(\newcommand{\ecal}{\cal E}\) \(\newcommand{\coords}[2]{\left\{#1\right\}_{#2}}\) \(\newcommand{\gray}[1]{\color{gray}{#1}}\) \(\newcommand{\lgray}[1]{\color{lightgray}{#1}}\) \(\newcommand{\rank}{\operatorname{rank}}\) \(\newcommand{\row}{\text{Row}}\) \(\newcommand{\col}{\text{Col}}\) \(\renewcommand{\row}{\text{Row}}\) \(\newcommand{\nul}{\text{Nul}}\) \(\newcommand{\var}{\text{Var}}\) \(\newcommand{\corr}{\text{corr}}\) \(\newcommand{\len}[1]{\left|#1\right|}\) \(\newcommand{\bbar}{\overline{\bvec}}\) \(\newcommand{\bhat}{\widehat{\bvec}}\) \(\newcommand{\bperp}{\bvec^\perp}\) \(\newcommand{\xhat}{\widehat{\xvec}}\) \(\newcommand{\vhat}{\widehat{\vvec}}\) \(\newcommand{\uhat}{\widehat{\uvec}}\) \(\newcommand{\what}{\widehat{\wvec}}\) \(\newcommand{\Sighat}{\widehat{\Sigma}}\) \(\newcommand{\lt}{<}\) \(\newcommand{\gt}{>}\) \(\newcommand{\amp}{&}\) \(\definecolor{fillinmathshade}{gray}{0.9}\)Article: R.A. Sowell, K.E. Hersberger, T.C. Kaufman, and D.E. Clemmer, “Examining the proteome of Drosophila across organism lifespan,” J. Proteome Res., 2007, 6, 3637-3647.
This article describes an in-depth study of the changes in the identity and abundance of the proteins present in fruit fly heads as a function of fly age. Three methodologies, LC-MS/MS, SCX-LC-MS/MS, and LC-IMS-MS, were used, and the article discusses the relative sequence coverage obtained by each technique. The assignment assumes prior knowledge of ESI, common mass analyzers, and peptide fragmentation patterns (i.e., b and y ions). The article by Gary L. Glish and Richard W.Vachet, “The basics of mass spectrometry in the twenty first century,” Nature Rev. Drug Discov. 2003, 2, 140-150 is a good resource. No previous knowledge of IMS is required, as briefly researching this technique is part of the assignment. The LC-IMS-MS is a home-built instrument, which gives students an opportunity to identify components in an instrument block diagram. Additionally, the 2D separations demonstrate the “Big Data” obtainable by shotgun proteomics and provide opportunities for students to practice interpreting complex data plots. The latter part of the discussion requires more biological background knowledge, and the assignment has been designed to focus more heavily on the earlier section of the paper describing the separations and MS instrumentation. However, questions could be added on the later sections in a class for biochemistry majors.
Out-of-Class Questions
Q1. In the paper, the authors focus solely on proteins expressed in the fly’s head.
- The authors give two reasons to focus on the flies’ heads as opposed to the bodies (p. 3638). First, previous studies of the transcriptome demonstrated an observable difference between fly heads and bodies. Second, studying the head makes the work more applicable to studies of neurology. [On p. 3637, the authors list many reasons to study fruit flies, but none of these explanations are specific to studies of the head.]
- From p. 3638: “Briefly, heads are obtained as follows: animals were anesthetized by exposure to CO2 gas, transferred to Nalgene tubes, and frozen by submerging the tube in liquid nitrogen; tubes were shaken by hand several times to separate body parts, and heads were collected over a bed of dry ice and stored at -80 °C until further use.”
Q2. Based on the details in the sample preparation section, about how many flies were used in this study?
From p. 3638: The authors pooled 175 heads/time point for 8 time points. This pooling strategy was conducted twice, for a total of 2*175*8 = 2800 flies. The authors state that “time-point 9 includes only 100 heads due to the lack of living animals that remained at later ages.” So the total number of flies can be estimated as 2900.
Q3. Review or research the chromatographic method SCX. What is SCX, and how does it work?
SCX stands for strong cation exchange chromatography, which is a separation method based on the affinity of the cations in the sample for an anionic resin (e.g., with sulfonic acid residues) as the stationary phase. Retention times depend on ionic interactions, and therefore on the charge and size of the ions.
If students have not covered ion exchange chromatography previously, they can be directed to p. 635 in the 8th edition Harris text, p. 839 in the 6th edition Skoog text, or "12.6.2 Ion-Exchange Chromatography" in Chapter 12 of the freely available Harvey text, Analytical Chemistry 2.0.
Q4. What ionization method was used for these experiments? What is one advantage of this ionization method for these experiments?
Electrospray ionization (ESI) was used for the LC-IMS-MS experiments (see Figure 1). Although unspecified, it is most likely that ESI was also used for the LC-MS/MS experiments and SCX-LC-MS/MS experiments.
Advantages of ESI for this application include its easy coupling to condensed phase effluent from LC, soft ionization with minimal fragmentation for easy database searching, and multiple charges for MS analysis of heavier analytes (although singly-charged tryptic peptides would typically be within the mass range of both a quadrupole and a TOF).
Q5. Look up ion mobility spectrometry (IMS). How does this technique work? How does it differ from TOF-MS in the experimental parameters and the separation of analytes?
In IMS, the drift tube is filled with a low pressure of buffer gases (~2.6 Torr He and 0.1 Torr N2 in this work), and the ions are separated in a weak electric field (~11.67 V/cm in this work) based on ion mobility, which depends on mass, cross-sectional area, and charge. Cross-sectional area influences the drift time of the ions because ions with larger cross-sectional areas will experience more collisions with the buffer gas, resulting in longer drift times. The conditions in the drift tube are in contrast to those of a TOF flight tube, which consists of a field-free region kept at high vacuum (~10-6 Torr). As a result, TOF analyzers separate ions based on mass and charge. Cross-sectional area has a negligible influence on flight time because the probability of collisions is low.
Q6. What is the total pressure in the IMS drift tube? Calculate the mean free path of an ion in an IMS drift tube and compare it to the mean free path of an ion in the mass analyzer used for the MS analysis part of the IMS-MS experiments.
The total pressure in the IMS drift tube is 2.6 Torr + 0.1 Torr = 2.7 Torr or 2.7×10³ mTorr.
Mean free path, λ, can be determined by the equation
\(\lambda= \dfrac{k_B T}{\sqrt{2} \pi d^2 P}\approx \dfrac{5\: cm}{P\: (mTorr)}\) for a small molecule at room temperature
where kB is Boltzmann’s constant, T is the temperature, d is the diameter of the molecule, and P is the pressure. [I present this simplified version of the equation in class before this assignment is due.]
For the IMS, \(\lambda \approx 5\: cm/(2.7\times 10^3) = 2\times 10^{-3}\: cm\)
For the TOF, \(\lambda \approx 5\: cm/(10^{-3}) = 5\times 10^3\: cm\)
The much shorter mean free path in the IMS results in collisions which separate ions in drift time based on cross-sectional area.
Q7. Consider Figure 1.
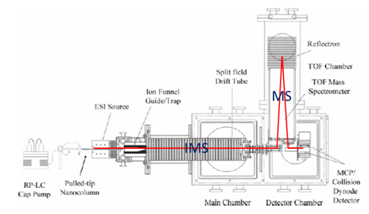
- The mass analyzer on the IMS-MS instrument is a time-of-flight (see Figure 1).
- The mass analyzer on the LC-MS-MS is a quadrupole.
- A TOF has higher mass resolving power than a quadrupole. A TOF typically has a value of R in the thousands or even above 10,000, while a quadrupole usually has unit resolution (Δm = 1 with R = m/Δm depending on mass).
Q8. Briefly and in your own words describe how mass spectra were assigned (matched) to specific peptides.
In evaluating student responses, I look for correct application of the underlined concepts:
The spectra were matched against a database (the National Center for Biotechnology Information Drosophila protein database) using an algorithm (MASCOT). At least one unique peptide hit was required for assignment of a protein, and results from IMS-MS experiments were confirmed visually to reduce the false positive rate. (See p. 3639).
Q9. What “semi-quantitative” methods were used to measure changes in protein abundance with fly age in this work?
Changes in protein abundance were estimated based on (1) the number of unique peptide hits identified for each protein and (2) the integration of peaks from the LC-IMS-MS data sets. In method (1), the number of hits was normalized to the number of hits at time point 2 (ages of 8-14 days). Method (2) was used to validate or further investigate trends identified by method (1), and the integration values were normalized to the total ion signal at each time point.
Q10. The bottom part of Figure 2 shows the base peak chromatograms for three separations. Define base peak. What is a base peak chromatogram?
The base peak is the most intense peak in the mass spectrum. (The other peak intensities are often normalized to this peak, which is assigned an intensity of 100.)
A base peak chromatogram plots the intensity of the base peak in each mass spectrum (y-axis) versus the separation time (x-axis).
Q11. How effective was the SCX-LC-MS/MS method at identifying peptides compared to the LC-MS/MS method? What do you think is the reason for this difference in performance when an SCX step is added?
The addition of the SCX step greatly increased the number of peptides (and therefore proteins) identified from 1102 peptides assigned to 367 proteins to 5430 peptides assigned to 1437 proteins.
The improved performance is likely due to the increased peak capacity with the two-dimensional separation. By further separating the samples before MS analysis the data are cleaner and mass spectra are easier to match.
Q12. Which proteins in Figure 6 change with the flies’ age? What biological processes are associated with these proteins?
Prophenoloxidase and CG4784 both decrease with age. “[P]rophenoloxidase is an enzyme that catalyzes the synthesis of melanin as a defense response and part of wound healing” (p. 4643). CG4784 is a component of the cuticle (exoskeleton).
Q13. How do the authors’ results compare to results obtained by more traditional methods used to study proteins?
[For this section, students who do not have a biology background will benefit from an explanation of the central dogma of biology: DNA \(\rightarrow\) RNA \(\rightarrow\) protein and the information that Western blotting is a traditional method of assessing protein expression in molecular biology.]
The authors’ data for certain proteins agree with previous Western blotting results. For example, data on heat shock protein 22 and larval serum protein 2 are consistent with previous studies (p. 3644).
The authors’ results show mixed comparisons to previous data on transcript levels. They note significant disagreement with reference 15 in terms of whether changes were observed with age and in which direction (p. 3644-3645). The authors suggest that fly strain, sex, or temperature of growth could account for some of these differences. [There is also precedent in the literature to suggest that transcript levels and protein levels are not always tightly correlated due to additional regulatory components.] In a few cases, the authors’ data on protein levels corresponded to the transcript data. For example, CG15093 and Punch were down-regulated with age in both studies, while Cyp28a5 and S-adenosyl-L-homocysteine hydrolase were up-regulated.
In general, the biological trends observed in this study seem reasonable: down-regulation of metabolic components and reproductive proteins with age and changes to proteins involved in defense response (p. 3645-3646).
In-Class Questions
Q1. Consider your answer to out-of-class question 7c. How are tandem MS experiments achieved on the LC-MS-MS system? How does fragmentation occur, and what types of fragments are formed? How do these fragments yield information about the peptides in the sample?
As noted in out-of-class question 7c, the mass analyzer is a quadrupole. Because this is a single quadrupole (rather than a triple quad), the instrument is being operated as a tandem-in-time MS-MS instrument. The precursor ion is selected and fragmented by collision-induced dissociation (CID) in the mass analyzer. The product ions are then scanned out to obtain the MS-MS spectrum. For peptides, CID typically produces b and y ions. A series of b or y ions can be used to de novo sequence the peptide or matched to a database mass spectrum for identification of the peptide and corresponding protein.
[I spend a class period discussing MS-based proteomics before assigning this article. The article by Ruedi Aebersold & Matthias Mann, “Mass spectrometry-based proteomics,” Nature, 2003, 422, 198-207 is a good resource for this.]
Q2. Proteomics experiments often produce vast quantities of data.
- The panels on the far left are heat maps showing the LC-IMS results. The false color indicates the peak intensity for each retention time, drift time pair. Each panel on the right is a mass spectrum from the TOF analyzer and corresponds to a single pixel in one of the three left-hand panels. In other words, each pixel in each panel on the right has a corresponding mass spectrum – a huge quantity of data.
- It is often productive to have students discuss this question along with question (c) since few students think that no raw data should be shared. If the discussion is foundering, I find it helpful to point out how little biological interpretation has been done of the results in this paper (considering the huge number of proteins identified). As a results, future targeted biological studies may wish to cross-reference results with proteomics studies like these.
- Some possibilities include individual researchers through their grants, government organizations like the National Science Foundation and National Institutes of Health, the publishers of the journals the data appears in, or other researchers who choose to access the data. You may think of others.
The duration of data availability and the need to make data formats compatible with new software versions or programs are additional considerations. I have sometimes assigned an article by Julie Manoharan, “Thank you for sharing,” Biotechniques, 2011 as a follow-up reading.
Q3. Quantitation by mass spectrometry in proteomics is challenging because the wide variety of peptide chemistries result in variable MS signal between peptides, and ionization efficiency can also change over the course of an LC run.
- For complex mixtures like these protein digests, numerous internal standards would be needed to accurately reflect all the analytes. Additionally, these internal standards would need to be readily separated from the analytes during the chromatographic or mass spectrometric steps. This would be difficult and likely expensive. [Quantitative mass spectrometry experiments for proteomics often used isotope labeling of some kind to introduce internal standards.]
Although internal standards were not used, the authors were still able to compare results semi-quantitatively using peptide hits and peak integration as proxies for protein abundance. To improve the quality of their data interpretation, the authors only looked at changes in abundance with age for proteins that had a difference of at least 5 peptide hits between time points. The authors also separated the proteins out by the magnitude of change in their peptide hits (≥1.5, ≥2.0, or >10) to separate small and large changes in expression. (See p. 3644 for detail.)
- The open symbols are from the normalized peak intensities (integrated as described on p. 3640). The closed symbols are the normalized number of peptide hits.
- Based on Figure 6, the semi-quantitative methods agree with one another, which suggests that they are at least reasonably reliable. As discussed in out-of-class question 13, the results from these semi-quantitative method often (but not always) agree with results of more traditional measures of protein expression, further suggesting that the methods are reliable.
The comparisons are limited in that they are semi-quantitative, relative for each protein, and may not capture changes in protein abundance near the detection limit accurately. While imperfect, these methods are practical with current technology and seem to provide useful biological information.