10.6: Information Obtained from IR Spectra
- Page ID
- 213356

\( \newcommand{\vecs}[1]{\overset { \scriptstyle \rightharpoonup} {\mathbf{#1}} } \)
\( \newcommand{\vecd}[1]{\overset{-\!-\!\rightharpoonup}{\vphantom{a}\smash {#1}}} \)
\( \newcommand{\id}{\mathrm{id}}\) \( \newcommand{\Span}{\mathrm{span}}\)
( \newcommand{\kernel}{\mathrm{null}\,}\) \( \newcommand{\range}{\mathrm{range}\,}\)
\( \newcommand{\RealPart}{\mathrm{Re}}\) \( \newcommand{\ImaginaryPart}{\mathrm{Im}}\)
\( \newcommand{\Argument}{\mathrm{Arg}}\) \( \newcommand{\norm}[1]{\| #1 \|}\)
\( \newcommand{\inner}[2]{\langle #1, #2 \rangle}\)
\( \newcommand{\Span}{\mathrm{span}}\)
\( \newcommand{\id}{\mathrm{id}}\)
\( \newcommand{\Span}{\mathrm{span}}\)
\( \newcommand{\kernel}{\mathrm{null}\,}\)
\( \newcommand{\range}{\mathrm{range}\,}\)
\( \newcommand{\RealPart}{\mathrm{Re}}\)
\( \newcommand{\ImaginaryPart}{\mathrm{Im}}\)
\( \newcommand{\Argument}{\mathrm{Arg}}\)
\( \newcommand{\norm}[1]{\| #1 \|}\)
\( \newcommand{\inner}[2]{\langle #1, #2 \rangle}\)
\( \newcommand{\Span}{\mathrm{span}}\) \( \newcommand{\AA}{\unicode[.8,0]{x212B}}\)
\( \newcommand{\vectorA}[1]{\vec{#1}} % arrow\)
\( \newcommand{\vectorAt}[1]{\vec{\text{#1}}} % arrow\)
\( \newcommand{\vectorB}[1]{\overset { \scriptstyle \rightharpoonup} {\mathbf{#1}} } \)
\( \newcommand{\vectorC}[1]{\textbf{#1}} \)
\( \newcommand{\vectorD}[1]{\overrightarrow{#1}} \)
\( \newcommand{\vectorDt}[1]{\overrightarrow{\text{#1}}} \)
\( \newcommand{\vectE}[1]{\overset{-\!-\!\rightharpoonup}{\vphantom{a}\smash{\mathbf {#1}}}} \)
\( \newcommand{\vecs}[1]{\overset { \scriptstyle \rightharpoonup} {\mathbf{#1}} } \)
\( \newcommand{\vecd}[1]{\overset{-\!-\!\rightharpoonup}{\vphantom{a}\smash {#1}}} \)
• IR is most useful in providing information about the presence or absence of specific functional groups.
• IR can provide a molecular fingerprint that can be used when comparing samples. If two pure samples display the same IR spectrum it can be argued that they are the same compound.
• IR does not provide detailed information or proof of molecular formula or structure. It provides information on molecular fragments, specifically functional groups.
• Therefore it is very limited in scope, and must be used in conjunction with other techniques to provide a more complete picture of the molecular structure
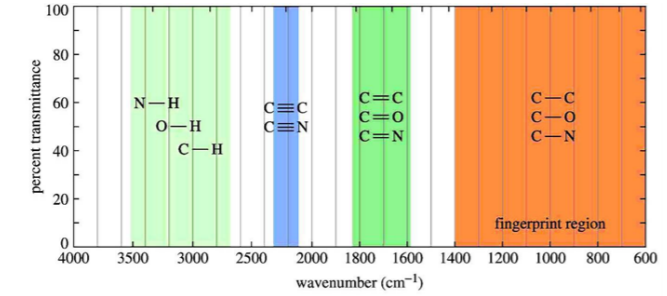
IR ABSORPTION RANGE
The typical IR absorption range for covalent bonds is 600 - 4000 cm-1. The graph shows the regions of the spectrum where the following types of bonds normally absorb. For example a sharp band around 2200-2400 cm-1 would indicate the possible presence of a C-N or a C-C triple bond.
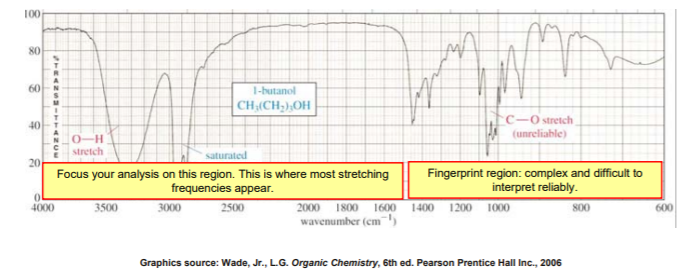
THE FINGERPRINT REGION
Although the entire IR spectrum can be used as a fingerprint for the purposes of comparing molecules, the 600 - 1400 cm-1 range is called the fingerprint region. This is normally a complex area showing many bands, frequently overlapping each other. This complexity limits its use to that of a fingerprint, and should be ignored by beginners when analyzing the spectrum. As a student, you should focus your analysis on the rest of the spectrum, that is the region to the left of 1400 cm-1.