
2: The Densities of Solutions and Solids (Experiment)
- Page ID
- 95884
\( \newcommand{\vecs}[1]{\overset { \scriptstyle \rightharpoonup} {\mathbf{#1}} } \)
\( \newcommand{\vecd}[1]{\overset{-\!-\!\rightharpoonup}{\vphantom{a}\smash {#1}}} \)
\( \newcommand{\dsum}{\displaystyle\sum\limits} \)
\( \newcommand{\dint}{\displaystyle\int\limits} \)
\( \newcommand{\dlim}{\displaystyle\lim\limits} \)
\( \newcommand{\id}{\mathrm{id}}\) \( \newcommand{\Span}{\mathrm{span}}\)
( \newcommand{\kernel}{\mathrm{null}\,}\) \( \newcommand{\range}{\mathrm{range}\,}\)
\( \newcommand{\RealPart}{\mathrm{Re}}\) \( \newcommand{\ImaginaryPart}{\mathrm{Im}}\)
\( \newcommand{\Argument}{\mathrm{Arg}}\) \( \newcommand{\norm}[1]{\| #1 \|}\)
\( \newcommand{\inner}[2]{\langle #1, #2 \rangle}\)
\( \newcommand{\Span}{\mathrm{span}}\)
\( \newcommand{\id}{\mathrm{id}}\)
\( \newcommand{\Span}{\mathrm{span}}\)
\( \newcommand{\kernel}{\mathrm{null}\,}\)
\( \newcommand{\range}{\mathrm{range}\,}\)
\( \newcommand{\RealPart}{\mathrm{Re}}\)
\( \newcommand{\ImaginaryPart}{\mathrm{Im}}\)
\( \newcommand{\Argument}{\mathrm{Arg}}\)
\( \newcommand{\norm}[1]{\| #1 \|}\)
\( \newcommand{\inner}[2]{\langle #1, #2 \rangle}\)
\( \newcommand{\Span}{\mathrm{span}}\) \( \newcommand{\AA}{\unicode[.8,0]{x212B}}\)
\( \newcommand{\vectorA}[1]{\vec{#1}} % arrow\)
\( \newcommand{\vectorAt}[1]{\vec{\text{#1}}} % arrow\)
\( \newcommand{\vectorB}[1]{\overset { \scriptstyle \rightharpoonup} {\mathbf{#1}} } \)
\( \newcommand{\vectorC}[1]{\textbf{#1}} \)
\( \newcommand{\vectorD}[1]{\overrightarrow{#1}} \)
\( \newcommand{\vectorDt}[1]{\overrightarrow{\text{#1}}} \)
\( \newcommand{\vectE}[1]{\overset{-\!-\!\rightharpoonup}{\vphantom{a}\smash{\mathbf {#1}}}} \)
\( \newcommand{\vecs}[1]{\overset { \scriptstyle \rightharpoonup} {\mathbf{#1}} } \)
\(\newcommand{\longvect}{\overrightarrow}\)
\( \newcommand{\vecd}[1]{\overset{-\!-\!\rightharpoonup}{\vphantom{a}\smash {#1}}} \)
\(\newcommand{\avec}{\mathbf a}\) \(\newcommand{\bvec}{\mathbf b}\) \(\newcommand{\cvec}{\mathbf c}\) \(\newcommand{\dvec}{\mathbf d}\) \(\newcommand{\dtil}{\widetilde{\mathbf d}}\) \(\newcommand{\evec}{\mathbf e}\) \(\newcommand{\fvec}{\mathbf f}\) \(\newcommand{\nvec}{\mathbf n}\) \(\newcommand{\pvec}{\mathbf p}\) \(\newcommand{\qvec}{\mathbf q}\) \(\newcommand{\svec}{\mathbf s}\) \(\newcommand{\tvec}{\mathbf t}\) \(\newcommand{\uvec}{\mathbf u}\) \(\newcommand{\vvec}{\mathbf v}\) \(\newcommand{\wvec}{\mathbf w}\) \(\newcommand{\xvec}{\mathbf x}\) \(\newcommand{\yvec}{\mathbf y}\) \(\newcommand{\zvec}{\mathbf z}\) \(\newcommand{\rvec}{\mathbf r}\) \(\newcommand{\mvec}{\mathbf m}\) \(\newcommand{\zerovec}{\mathbf 0}\) \(\newcommand{\onevec}{\mathbf 1}\) \(\newcommand{\real}{\mathbb R}\) \(\newcommand{\twovec}[2]{\left[\begin{array}{r}#1 \\ #2 \end{array}\right]}\) \(\newcommand{\ctwovec}[2]{\left[\begin{array}{c}#1 \\ #2 \end{array}\right]}\) \(\newcommand{\threevec}[3]{\left[\begin{array}{r}#1 \\ #2 \\ #3 \end{array}\right]}\) \(\newcommand{\cthreevec}[3]{\left[\begin{array}{c}#1 \\ #2 \\ #3 \end{array}\right]}\) \(\newcommand{\fourvec}[4]{\left[\begin{array}{r}#1 \\ #2 \\ #3 \\ #4 \end{array}\right]}\) \(\newcommand{\cfourvec}[4]{\left[\begin{array}{c}#1 \\ #2 \\ #3 \\ #4 \end{array}\right]}\) \(\newcommand{\fivevec}[5]{\left[\begin{array}{r}#1 \\ #2 \\ #3 \\ #4 \\ #5 \\ \end{array}\right]}\) \(\newcommand{\cfivevec}[5]{\left[\begin{array}{c}#1 \\ #2 \\ #3 \\ #4 \\ #5 \\ \end{array}\right]}\) \(\newcommand{\mattwo}[4]{\left[\begin{array}{rr}#1 \amp #2 \\ #3 \amp #4 \\ \end{array}\right]}\) \(\newcommand{\laspan}[1]{\text{Span}\{#1\}}\) \(\newcommand{\bcal}{\cal B}\) \(\newcommand{\ccal}{\cal C}\) \(\newcommand{\scal}{\cal S}\) \(\newcommand{\wcal}{\cal W}\) \(\newcommand{\ecal}{\cal E}\) \(\newcommand{\coords}[2]{\left\{#1\right\}_{#2}}\) \(\newcommand{\gray}[1]{\color{gray}{#1}}\) \(\newcommand{\lgray}[1]{\color{lightgray}{#1}}\) \(\newcommand{\rank}{\operatorname{rank}}\) \(\newcommand{\row}{\text{Row}}\) \(\newcommand{\col}{\text{Col}}\) \(\renewcommand{\row}{\text{Row}}\) \(\newcommand{\nul}{\text{Nul}}\) \(\newcommand{\var}{\text{Var}}\) \(\newcommand{\corr}{\text{corr}}\) \(\newcommand{\len}[1]{\left|#1\right|}\) \(\newcommand{\bbar}{\overline{\bvec}}\) \(\newcommand{\bhat}{\widehat{\bvec}}\) \(\newcommand{\bperp}{\bvec^\perp}\) \(\newcommand{\xhat}{\widehat{\xvec}}\) \(\newcommand{\vhat}{\widehat{\vvec}}\) \(\newcommand{\uhat}{\widehat{\uvec}}\) \(\newcommand{\what}{\widehat{\wvec}}\) \(\newcommand{\Sighat}{\widehat{\Sigma}}\) \(\newcommand{\lt}{<}\) \(\newcommand{\gt}{>}\) \(\newcommand{\amp}{&}\) \(\definecolor{fillinmathshade}{gray}{0.9}\)- To compare the precision of various types of volumetric glassware.
- To determine, and then compare, the densities of regular and diet de-gassed sodas.
- To determine the density of an unknown metal and use this value to identify the metal.
- To use a common spreadsheet program, Microsoft Excel©, to perform graphical analysis of experimental data.
Density is a fundamental physical property of matter. Physical properties are those characteristics of a substance that can be determined without changing the chemical identity of the substance. Other physical properties include melting point and solubility. In general, since different substances have unique densities, determining the density of an unknown substance can help identify it. Density is specifically defined as the ratio of a substance’s mass to its volume:
\[ Density = \frac{Mass}{Volume} \label{1} \]
The S.I. unit of density is kg/m3, but in chemistry it is more often expressed in units of g/cm3 for solids, and g/mL for liquids and solutions.
In Part A of this lab, a study of density values will be conducted in order to introduce the concept of precision and the statistical nature of experimental data. Specifically, the density of water will be determined using measurements obtained from three different types of volumetric glassware: a buret, a 100-mL graduated cylinder and a volumetric pipet. Multiple measurements will be performed so that a large ensemble of density values is acquired for each type of glassware used. Simple statistical analyses of the three data sets will then be carried out, including calculations of the average density and standard deviation. Note that an average value (\(\bar{x}\)) is defined as the sum (\(\Sigma\)) of each of the measurements (\(x_{i}\)) divided by the number of measurements (\(N\)):
\[\bar{x} = \dfrac{\sum x_i}{N} \label{2}\]
Standard deviation (\(s\)) is defined as:
\[s= \sqrt{ \dfrac{\sum(x_i - \bar{x})^{2}}{N −1}} \label{3}\]
Standard deviation essentially indicates the degree to which a set of measured values deviate from the average value. Data sets with a wide range of values (for example, see VG 2 data in the following figure) will have a larger standard deviation and are associated with less precise measurements than data sets with a narrow range of values. With this information, the precision of the measurements obtained using the three types of volumetric glassware can be compared.
The three density data sets will also be displayed in a Scatter Plot, as shown below:
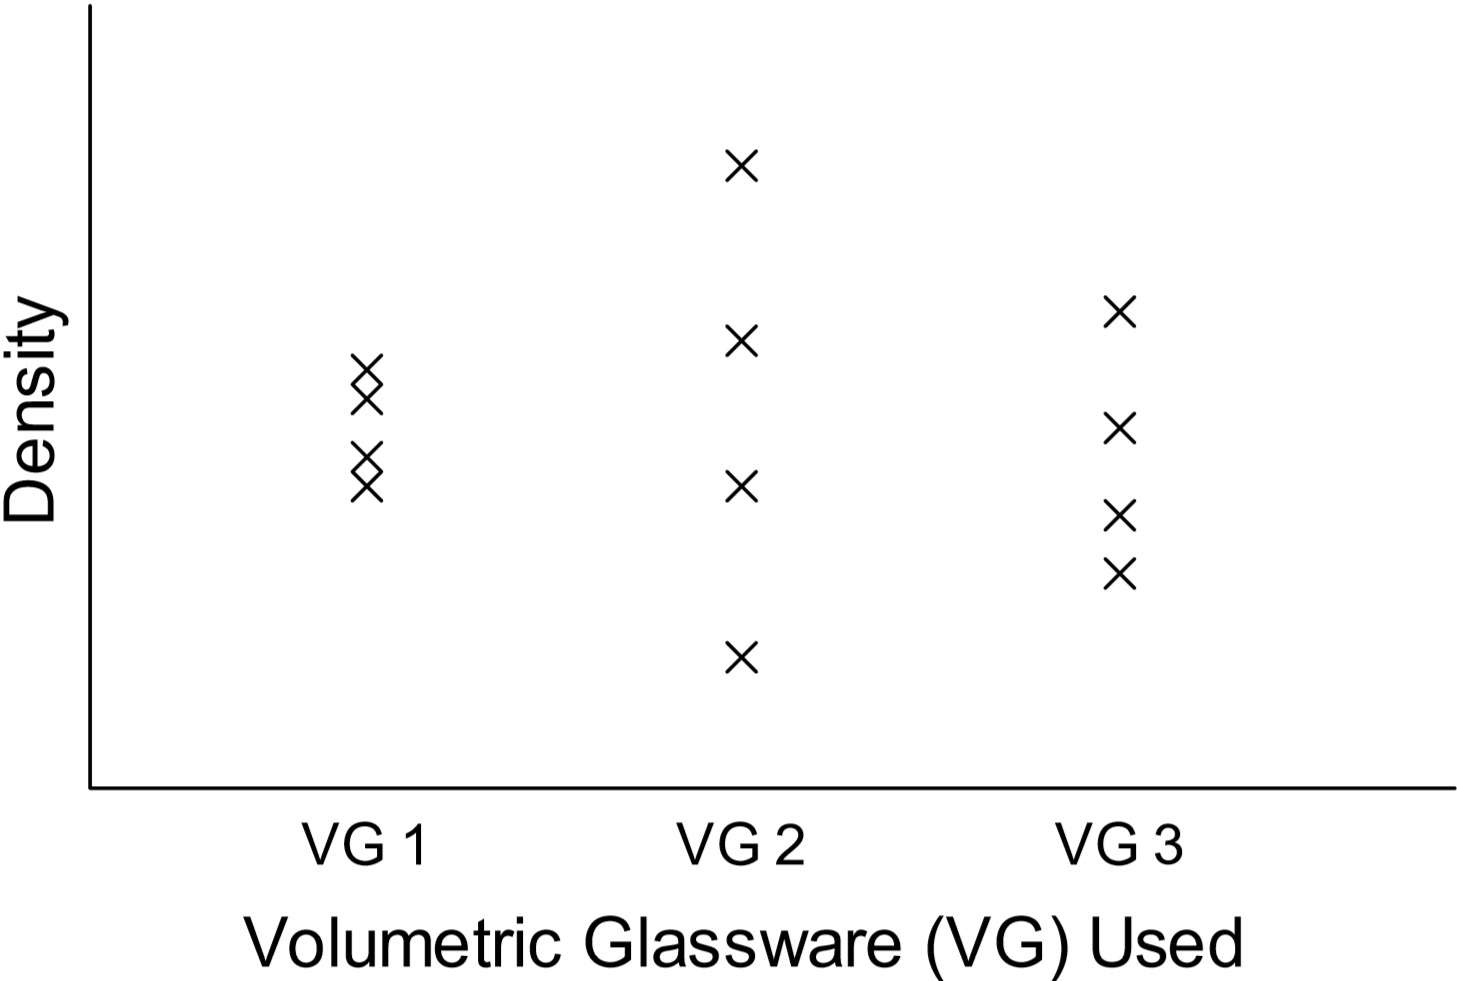
Occasionally one or more measurements in a data set will appear not to “fit in” with the others. This will often be evident upon close examination of a scatter plot. These points are called outliers – values that occur far outside the range defined by the rest of the measurements. One rough criterion for identifying an outlier is that it lies beyond two standard deviations from the average value. Such values may be legitimately excluded from a data set, as they can skew results to a great extent.
In Part B, the densities of two de-gassed sodas (regular and diet) will be determined and compared. Here, a buret will be used to dispense precise soda volumes. The masses of several different volumes of each soda will be measured, and this data will be used to determine the density of each soda.
This section of the lab will also clearly illustrate the intensive nature of density. An intensive property is one that is independent of the amount of matter present. This means that a pure substance will have the same density whether it is a larger sample or a small sample of that substance. In contrast, an extensive property is one that is dependent on the amount of matter present. Note that both mass and volume are extensive, however, since density is a ratio of these properties, density is an intensive property.
In Part C, the density of an unknown metal will be determined, and the metal identified using this value. Since mass can be more precisely measured than volume (due to the limitations of the instrumentation available), the technique employed here will involve mass measurements only. Using a capped glass vial, the following four mass measurements will be obtained:
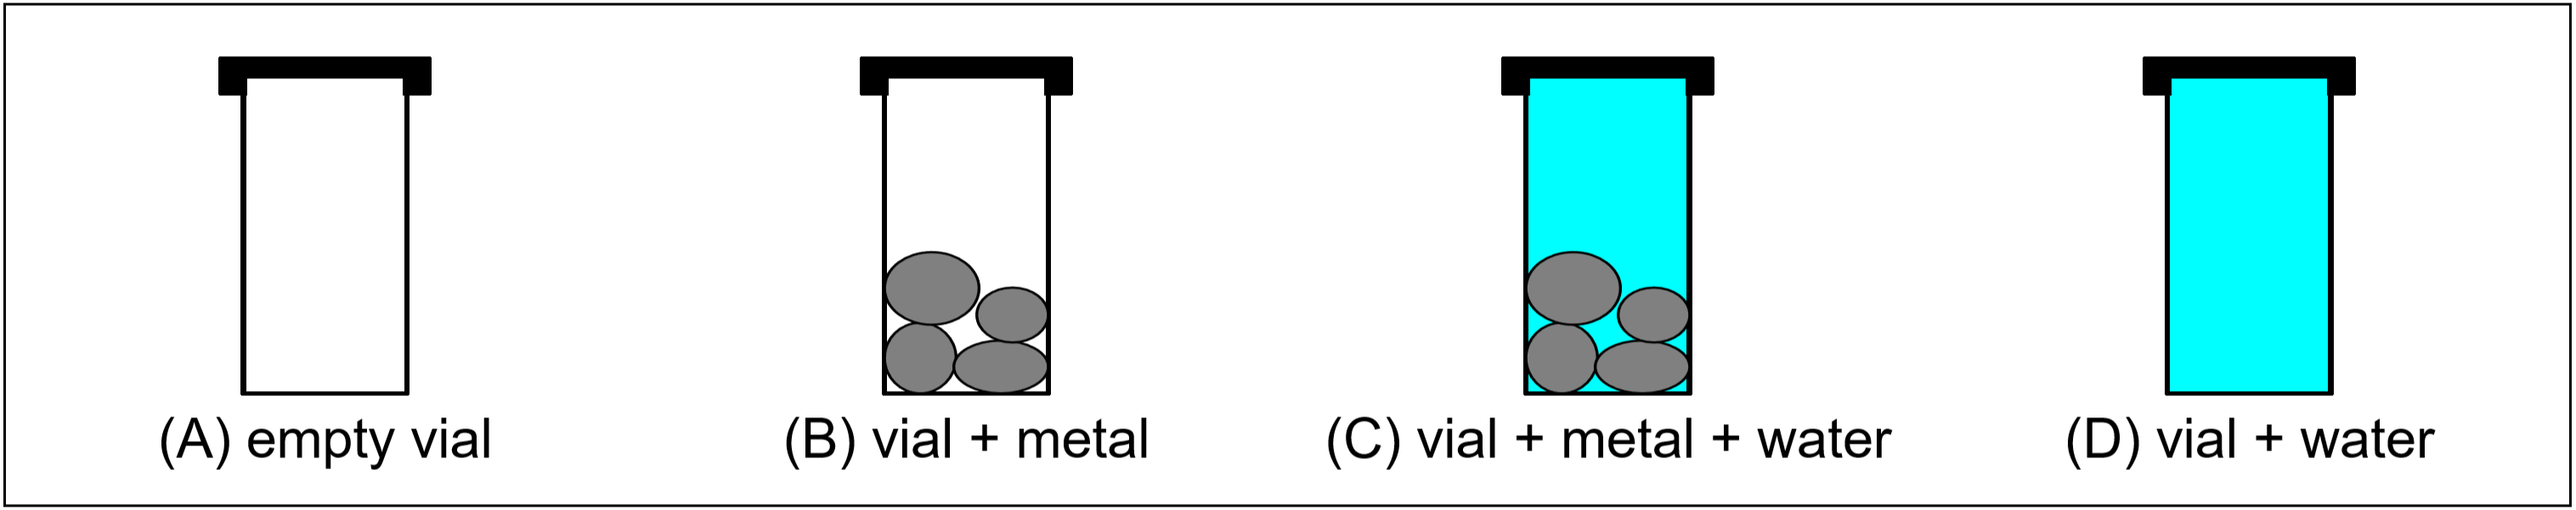
The difference in masses A and B is the mass of the metal sample. The volume of the metal is obtained by taking the difference between the water volumes in C and D. These water volumes will be calculated using the water masses and the known density of water (see table below). Although simple, this method can yield density results accurate to 0.1%.
Once the density is determined, this experimental value will be compared to the true densities of several known metals (obtained from suggested reference sources) in order to identify the assigned unknown metal. The percent error between this experimental value (EV) and the true density value (TV) of the metal will also be calculated.
\[ \text{Percent Error} = \frac{ |EV −TV| }{TV} \times100 \label {4}\]
Note that a more accurate experimental value will yield a lower percent error (< 5% is desirable) than a less accurate value.
|
Temperature (°C) |
Density (g/mL) |
|---|---|
|
16 |
0.9989 |
|
17 |
0.9988 |
|
18 |
0.9986 |
|
19 |
0.9984 |
|
20 |
0.9982 |
|
21 |
0.9980 |
|
22 |
0.9978 |
|
23 |
0.9975 |
|
24 |
0.9973 |
|
25 |
0.9970 |
|
26 |
0.9968 |
|
27 |
0.9965 |
|
28 |
0.9962 |
|
29 |
|
*obtained from the CRC Handbook of Chemistry and Physics, 53rd Edition
Procedure
Materials: De-gassed sodas (regular and diet), unknown metal sample.
Equipment: 10-mL volumetric pipet and pipet bulb*, 50-mL buret*, two 50-mL Erlenmeyer flasks*, 100-mL graduated cylinder, two 100-mL beakers, 50-mL beaker, electronic balance, capped glass vial, thermometer, wash bottle filled with distilled water.
*Items with an asterisk must be checked out from the stockroom.
There are no major safety considerations in this lab.
Part A: The Precision of Volumetric Glassware
All glassware should be cleaned and rinsed with distilled water before use. Pay special attention to significant figures in your recorded measurements.
- Using a medium 100-mL beaker, obtain approximately 50 mL of distilled water from the supply in the lab.
- Weigh a small dry 50-mL beaker on an electronic balance, and record this mass.
- Graduated Cylinder: Fill the 100-mL graduated cylinder with approximately 10 mL of distilled water, and record the actual volume used. To how many significant figures should the volume be recorded? Transfer this distilled water into the small pre-weighed beaker, and measure the combined mass. When finished, empty the distilled water out of the small beaker, then carefully dry it.
- Volumetric Pipet: Your instructor will demonstrate the correct use of the volumetric pipet at the beginning of the lab session. Use the pipet to transfer the exactly 10 mL of distilled water from the medium beaker into the small pre-weighed beaker. Record the volume used and the combined mass of the beaker and water. To how many significant figures should the volume be recorded? Again, empty the water out of the small beaker when finished, then carefully dry it.
- Buret: Your instructor will demonstrate the correct use of the buret at the beginning of the lab session. Fill the buret with the remaining distilled water in your medium beaker and note the initial buret reading. Then drain approximately 10 mL of this water into the small pre- weighed beaker. Record the actual volume used (= final – initial buret reading) and the combined mass of the beaker and water. To how many significant figures should the volume be recorded?
- For each of the three sets of data collected (using the graduated cylinder, volumetric pipet and buret), calculate the density of distilled water to the correct number of significant figures. Then share your three density values with all the students in your lab section, and record the results of the entire class on your report form. You should have at least ten density values for each type of volumetric glassware used in this part of the lab.
Part B: The Densities of Degassed Sodas
The following procedure should be performed for both a regular soda and a diet soda.
- A buret will be used to dispense precise volumes of each of the two sodas used. The buret should first be rinsed with distilled water, and then rinsed with a small quantity of the relevant soda before filling it with that soda.
- Using a medium 100-mL beaker, obtain approximately 40 mL of the regular soda from the stock bottle. Fill the buret with this soda, and record the initial buret reading.
- Weigh a small dry 50-mL Erlenmeyer flask using an electronic balance, and record this mass. Then drain approximately 5 mL of the soda from the buret into this flask, and record the new buret reading. Finally, measure and record the combined mass of the flask and soda.
- Next, add an additional 5 mL of soda from the buret to the flask. Again, note the new buret reading and the new combined mass of the flask and soda. Then repeat this step four more times. You will have obtained a total of six measurements and used approximately 30 mL of the soda when you are finished.
- Now perform the same series of steps 1-4 using the diet soda. Use your second small (dry) Erlenmeyer flask for this soda.
Part C: The Density of an Unknown Metal
- Obtain a capped glass vial and an unknown metal sample from your instructor. The cap on the vial should have a small hole pierced through it. This hole will allow air and excess water to be expelled from the vial. Record the ID Code of the metal on your report form.
- All mass measurements are to be performed on an electronic balance, and should be recorded on your report form. First, weigh the empty, dry capped vial. Then add the entire sample of your unknown metal to the vial, and weigh it again (with cap).
- Now fill the vial (with the metal still in it) to the brim with distilled water. Gently tap the vial to ensure that no air remains between the metal pieces. Place the cap on firmly, pressing out any air or excess water. Wipe off any drops of water on the outside of the vial, and then weigh it.
- Next, remove the metal from the vial and then fill it to the brim with distilled water only. Place the cap on firmly, wipe off excess water, and weigh.
- Finally, using your thermometer, measure and record the temperature of the water in the vial. When finished, dry the metal sample and vial, and return them to your instructor.
Pre-laboratory Assignment: The Densities of Solutions and Solids
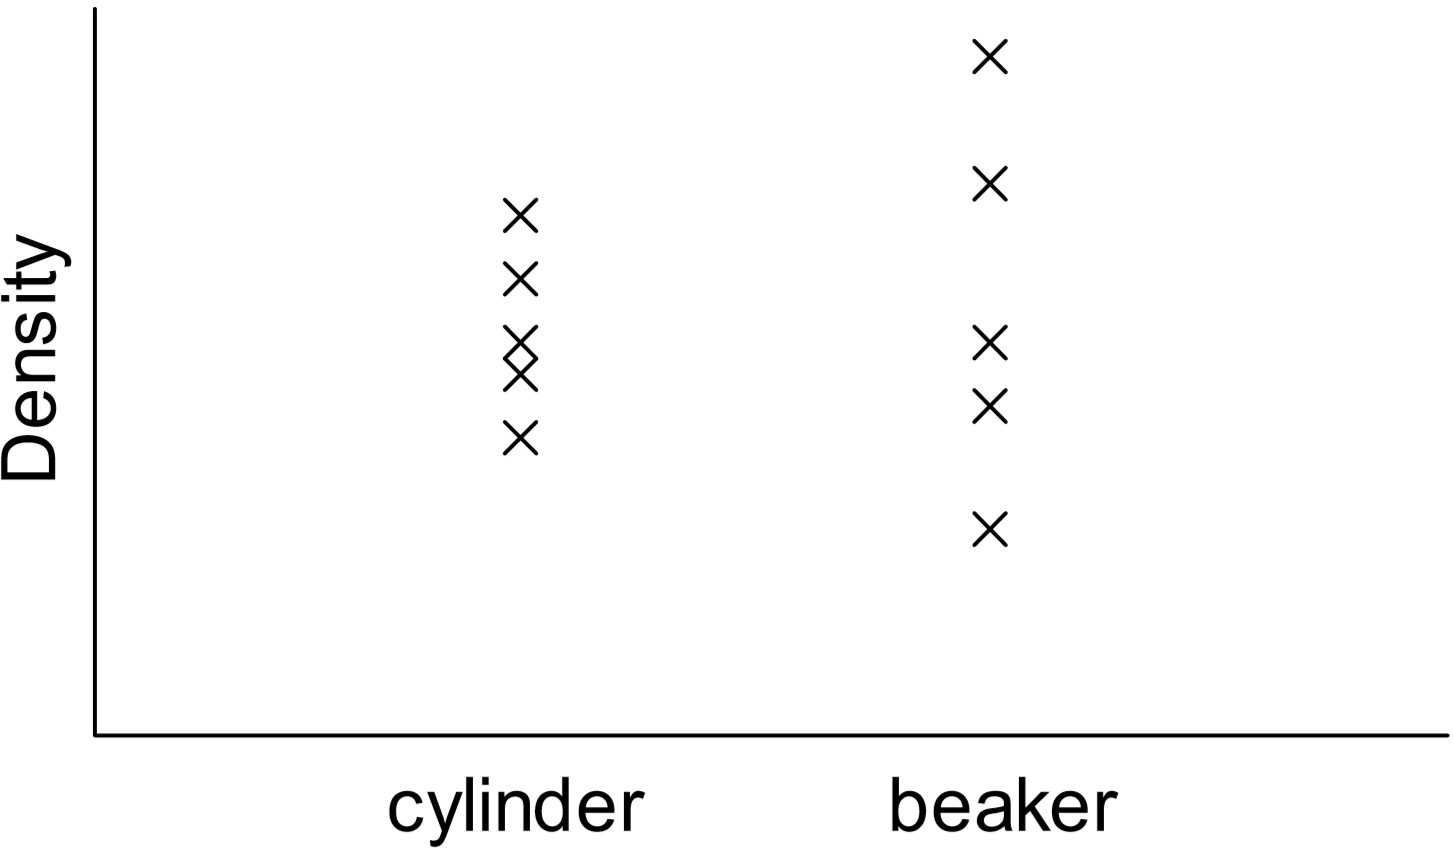
- Five students decide to determine the density of a sample of liquid chloroform. Each student uses a graduated cylinder to obtain the chloroform volume and a balance to obtain the chloroform mass. Their density values are shown in the table below.
| Student | Density (g/mL) |
|---|---|
| 1 | 1.45 |
| 2 | 1.55 |
| 3 | 1.6 |
| 4 | 1.38 |
| 5 | 1.44 |
- Determine the average density and the standard deviation in this density dataset.
Avg:
Std Dev:
- The students then decide to determine the chloroform density using a beaker to measure volume. Their density results are displayed in the graph above, along with those obtained using the cylinder. Which glassware yielded the more precise measurements? Explain.
- In Part A of this lab, you will perform a similar analysis of density data obtained for distilled water. What three types of volumetric glassware will you be using?
- A student decides to use the technique employed in Part B of this lab to determine the density of vodka. He first fills a buret with vodka to an initial volume of 1.52 mL. He then drains out some of the vodka into an empty beaker with a mass of 13.687 g. The final buret volume is 9.62 mL. If the combined mass of the beaker and vodka is 21.123 g, what is the the density of the vodka? Give your answer to the correct number of significant figures.
- Another student decides to use the technique employed in Part C of this lab to determine the density of gold. She obtains the following data:
|
(A) Mass of Empty Vial |
10.495 g |
|---|---|
|
(B) Mass of Vial + Gold Sample |
70.773 g |
|
(C) Mass of Vial + Gold + Water |
76.286 g |
|
(D) Mass of Vial + Water |
19.119 g |
|
(E) Temperature of Water |
25.0 °C |
|
(F) Density of Water at above Temp. |
0.9970 g/mL |
Using her data, perform the calculations below. Show your work clearly, and pay attention to significant figures and units.
- What is the mass of the gold sample?
- What is the mass of water in the vial with the gold (see measurement C)? What is volume of water in this vial (hint: use the density of water)?
- What is the mass of water in the vial filled with water only (see measurement D)? What is the volume of water in this filled vial (hint: use the density of water)?
- The volume of the gold is equal to the difference in the two water volumes. What is the volume of the gold?
- Determine the density of the gold, in g/cm3.
Lab Report: The Densities of Solutions and Solids
Part A: The Precision of Volumetric Glassware
Experimental Data
|
Graduated Cylinder |
Volumetric Pipet |
Buret |
|
|---|---|---|---|
|
Mass of Empty Beaker |
|||
|
Mass of Beaker + Water |
|||
|
Mass of Water only |
|||
|
Actual Volume of Water used |
|||
|
Density of Water |
Share your three density values with all the students in your lab section, and record the results of the entire class in the table below (pay attention to significant figures). You should acquire at least ten density values for each type of volumetric glassware used. Use an asterisks symbol (*) to denote which set of measurements you and your partner obtained.
|
Measurement |
Class Density Values (in g/mL) obtained using: |
||
|---|---|---|---|
|
Graduated Cylinder |
Volumetric Pipet |
Buret |
|
|
1 |
|||
|
2 |
|||
|
3 |
|||
|
4 |
|||
|
5 |
|||
|
6 |
|||
|
7 |
|||
|
8 |
|||
|
9 |
|||
|
10 |
|||
|
11 |
|||
|
12 |
|||
|
13 |
|||
|
14 |
|||
Data Analysis
- For each of the three density data sets, calculate the average density and the standard deviation in the data set.
|
Average |
Standard Deviation |
|
|---|---|---|
|
Graduated Cylinder |
||
|
Volumetric Pipet |
||
|
Buret |
- Using Microsoft Excel© plot all three density data sets on a single Scatter Graph as “Density of Water versus Type of Volumetric Glassware used”. Attach this graph to your report.
- Now closely examine all three data sets collected by your class.
- Circle any identified outliers in the three data sets on both your plot and in the data table. Then explain, using supporting calculations, how you identified these outliers.
Now re-calculate the average and standard deviation for each data set, omitting the outliers.
| Average | Standard Deviation | |
|---|---|---|
| Graduated Cylinder | ||
| Volumetric Pipet | ||
| Buret |
- Based on your analyses of the three data sets without the outliers, rank the volumetric glassware used from least to most precise. Briefly explain how you determined this order.
Part B: The Densities of De-gassed Sodas
Experimental Data
Regular Soda
- Name of Soda:
- Mass of Empty Flask:
- Initial Buret Reading:
|
Data |
Combined Mass of Flask + Soda |
New Buret Reading |
Total Mass of Beverage |
Total Volume of Beverage |
Density of Soda |
|---|---|---|---|---|---|
|
1 |
|||||
|
2 |
|||||
|
3 |
|||||
|
4 |
|||||
|
5 |
|||||
|
6 |
- Average density of regular soda:
Diet Soda
- Name of Soda:
- Mass of Empty Flask:
- Initial Buret Reading:
|
Data |
Combined Mass of Flask + Soda |
New Buret Reading |
Total Mass of Beverage |
Total Volume of Beverage |
Density of Soda |
|---|---|---|---|---|---|
|
1 |
|||||
|
2 |
|||||
|
3 |
|||||
|
4 |
|||||
|
5 |
|||||
|
6 |
- Average density of diet soda:
Data Analysis
- Which of the two sodas has the higher density? Suggest a possible reason for this result.
Part C: The Density of an Unknown Metal
Experimental Data
ID Code of Assigned Metal:
|
A. Mass of Empty Vial |
|
|---|---|
|
B. Mass of Vial + Metal |
|
|
C. Mass of Vial + Metal + Water |
|
|
D. Mass of Vial + Water |
|
|
E. Temperature of Water |
|
|
F. Density of Water at above Temperature |
Data Analysis
- Using the data collected, calculate the density (in g/cm3) of your unknown metal. Show your work clearly, and circle your final result.
- Your metal could be any of the following metals: lead, aluminum, nickel or zinc. Look up the true densities of these metals and identify your unknown metal. Suggested resources include your text, websites (e.g., www.webelements.com, www.chemicool.com) and the CRC Handbook of Chemistry and Physics.
- Identity of unknown metal:
- True density of metal:
- Source of density data:
- Calculate the percent error between your experimental density and the true metal density.
Questions
- In Part A of this lab, you used your experimental results t rank the precision of three types of glassware from least to most precise. Did you expect these results? If yes, explain why. If no, explain why not, and give the order that you did expect.
- Consider your density results for the diet soda in Part B of this lab. Clearly explain how they demonstrate that density is an intensive property.
- Consider your results for Part C. Suppose your metal sample is hammered into the shape of a thin coin with a diameter of 8.62 cm. Determine the thickness (in mm) of this metal sheet. Use the measured metal mass and the true density of your metal for this calculation.