1.4: Hydrogen's Atomic Emission Spectrum
- Last updated
- Save as PDF
- Page ID
- 164691
A hydrogen discharge tube is a slim tube containing hydrogen gas at low pressure with an electrode at each end. If a high voltage (5000 volts) is applied, the tube lights up with a bright pink glow. If the light is passed through a prism or diffraction grating, it is split into its various colors. This is a small part of the hydrogen emission spectrum. Most of the spectrum is invisible to the eye because it is either in the infrared or the ultraviolet region of the electromagnetic spectrum.
The photograph shows part of a hydrogen discharge tube on the left, and the three most apparent lines in the visible part of the spectrum on the right. (Ignore the "smearing," particularly to the left of the red line. This is caused by flaws in the way the photograph was taken. See note below.)
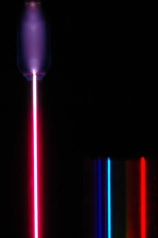
This photograph is by courtesy of Dr Rod Nave of the Department of Physics and Astronomy at Georgia State University, Atlanta.
Extending hydrogen's emission spectrum into the UV and IR
The hydrogen spectrum is complex, comprising more than the three lines visible to the naked eye. It is possible to detect patterns of lines in both the ultraviolet and infrared regions of the spectrum as well. These fall into a number of "series" of lines named after the person who discovered them. The diagram below shows three of these series, but there are others in the infrared to the left of the Paschen series shown in the diagram.
The diagram is quite complicated. Consider first at the Lyman series on the right of the diagram; this is the broadest series, and the easiest to decipher.
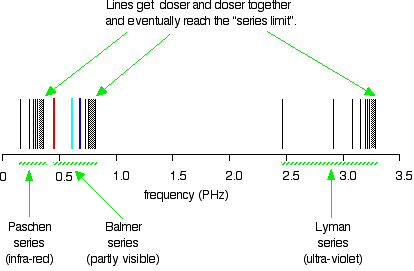
The frequency scale is marked in PHz—petaHertz. Peta means "1015 times". The value 3 PHz is equal to 3 × 10¹⁵ Hz. The quantity "hertz" indicates "cycles per second".
The Lyman series is a series of lines in the ultraviolet region. The lines grow closer and closer together as the frequency increases. Eventually, they are so close together that it becomes impossible to see them as anything other than a continuous spectrum. This is suggested by the shaded part on the right end of the series. At one particular point, known as the series limit, the series ends.
In Balmer series or the Paschen series, the pattern is the same, but the series are more compact. In the Balmer series, notice the position of the three visible lines from the photograph further up the page.
Frequency and Wavelength
The hydrogen spectrum is often drawn using wavelengths of light rather than frequencies. Unfortunately, because of the mathematical relationship between the frequency of light and its wavelength, two completely different views of the spectrum are obtained when it is plotted against frequency or against wavelength. The mathematical relationship between frequency and wavelength is the following:
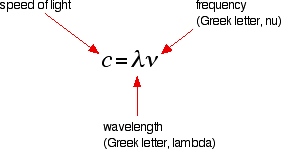
Rearranging this gives equations for either wavelength or frequency:
\[\lambda =\dfrac{c}{\nu}\]
or
\[\nu=\dfrac{c}{\lambda }\]
There is an inverse relationship between the two variables—a high frequency means a low wavelength and vice versa.
Drawing the hydrogen spectrum in terms of wavelength
This is what the spectrum looks like plotted in terms of wavelength instead of frequency:
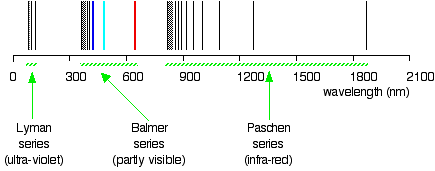
Compare this to the same spectrum in terms of frequency:
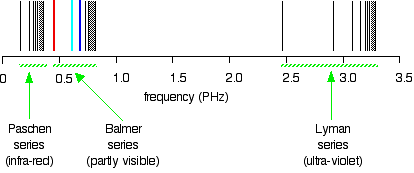
When juxtaposed, the two plots form a confusing picture. The remainder of the article employs the spectrum plotted against frequency, because in this spectrum it is much easier visualize what is occurring in the atom.
The Balmer and Rydberg Equations
In an amazing demonstration of mathematical insight, in 1885 Balmer came up with a simple formula for predicting the wavelength of any of the lines in what we now know as the Balmer series. Three years later, Rydberg generalized this so that it was possible to determine the wavelengths of any of the lines in the hydrogen emission spectrum. Rydberg's equation is as follows:
\[ \dfrac{1}{\lambda}=R_H \left( \dfrac{1}{n^2_1}-\dfrac{1}{n^2_2}\right)\]
where
- \(R_H\) is the Rydberg constant.
- \(n_1\) and \(n_2\) are integers (whole numbers). \(n_2\) is always greater than \(n_1\). In other words, if \(n_1\) is, say, 2 then \(n_2\) can be any whole number between 3 and infinity.
The various combinations of numbers that can be substituted into this formula allow the calculation the wavelength of any of the lines in the hydrogen emission spectrum; there is close agreement between the wavelengths generated by this formula and those observed in a real spectrum.
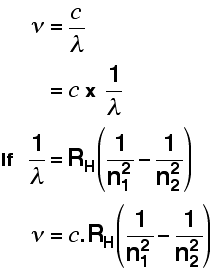
A modified version of the Rydberg equation can be used to calculate the frequency of each of the lines:
The origin of the hydrogen emission spectrum
The lines in the hydrogen emission spectrum form regular patterns and can be represented by a (relatively) simple equation. Each line can be calculated from a combination of simple whole numbers. Why does hydrogen emit light when excited by a high voltage and what is the significance of those whole numbers?
When unexcited, hydrogen's electron is in the first energy level—the level closest to the nucleus. But if energy is supplied to the atom, the electron is excited into a higher energy level, or even removed from the atom altogether. The high voltage in a discharge tube provides that energy. Hydrogen molecules are first broken up into hydrogen atoms (hence the atomic hydrogen emission spectrum) and electrons are then promoted into higher energy levels.
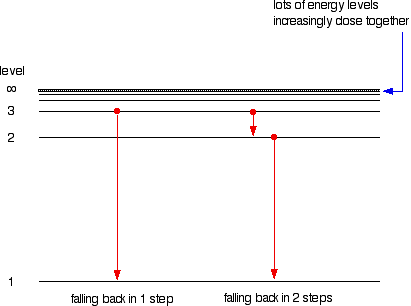
Suppose a particular electron is excited into the third energy level. It would tend to lose energy again by falling back down to a lower level. It can do this in two different ways. It could fall all the way back down to the first level again, or it could fall back to the second level and then, in a second jump, down to the first level.
Assigning particular electron jumps to individual lines in the spectrum
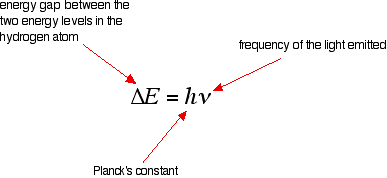
If an electron falls from the 3-level to the 2-level, it must lose an amount of energy exactly equal to the energy difference between those two levels. That energy which the electron loses is emitted as light (which "light" includes UV and IR as well as visible radiation). Each frequency of light is associated with a particular energy by the equation:
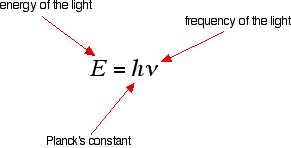
The higher the frequency, the higher the energy of the light. If an electron falls from the 3-level to the 2-level, red light is seen. This is the origin of the red line in the hydrogen spectrum. From the frequency of the red light, its energy can be calculated. That energy must be exactly the same as the energy gap between the 3-level and the 2-level in the hydrogen atom.
The last equation can therefore be rewritten as a measure of the energy gap between two electron levels:
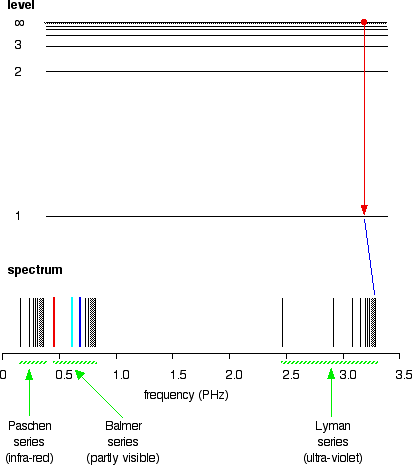
The greatest possible fall in energy will therefore produce the highest frequency line in the spectrum. The greatest fall will be from the infinity level to the 1-level. (The significance of the infinity level will be made clear later.)
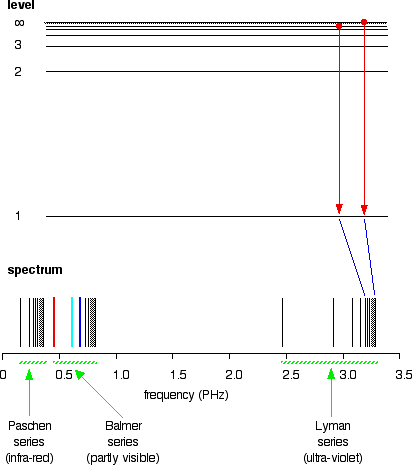
The next few diagrams are in two parts, with the energy levels at the top and the spectrum at the bottom.
If an electron falls from the 6-level, the difference is slightly less than before, and so the frequency is slightly lower (because of the scale of the diagram, it is impossible to depict the levels beyond 7).
All other possible jumps to the first level make up the whole Lyman series. The spacings between the lines in the spectrum reflect the changes in spacings between the energy levels.
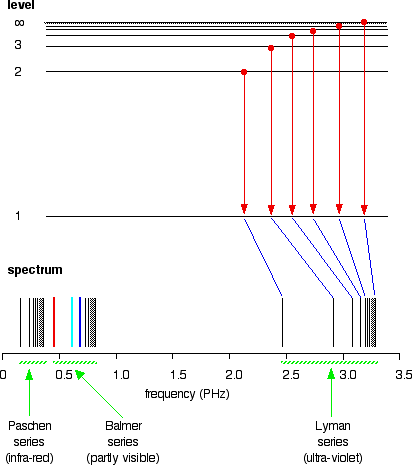
If the same is done for the 2-level, the Balmer series is shown. These energy gaps are all much smaller than in the Lyman series, and so the frequencies produced are also much lower.
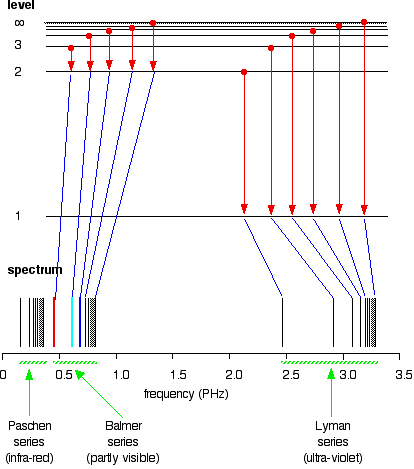
The Paschen series is made up of the transitions to the 3-level, but they are omitted to avoid cluttering the diagram.
The significance of the numbers in the Rydberg equation
In the Rydberg equation, n1 and n2 represent the energy levels at either end of the jump that produces a particular line in the spectrum.
- In the Lyman series, \(n_1 =1\), because electrons transition to the 1-level to produce lines in the Lyman series.
- In the Balmer series, \(n_1 =2\), because electrons fall to the 2-level.
n2 is the level being jumped from. In the case before, in which a red line is produced by electrons falling from the 3-level to the 2-level, n2 is equal to 3.
The significance of the infinity level
The infinity level represents the highest possible energy an electron can have as a part of a hydrogen atom. If the electron exceeds that energy, it is no longer a part of the atom. The infinity level represents the point at which ionization of the atom occurs to form a positively charged ion.
Using the spectrum to find the ionization energy of hydrogen
When there is no additional energy supplied to it, hydrogen atom's electron is found at the 1-level. This is known as its ground state. If enough energy is supplied to move the electron up to the infinity level, the atom is ionized. The ionization energy per electron is therefore a measure of the difference in energy between the 1-level and the infinity level. In above diagrams, that particular energy jump produces the series limit of the Lyman series.
The frequency of the Lyman series limit can be used to calculate the energy required to promote the electron in one atom from the 1-level to the point of ionization. This energy can then be used to calculate the ionization energy per mole of atoms. A problem with this approach is that the frequency of a series limit is quite difficult to find accurately from a spectrum because the lines are so close together in that region that the spectrum looks continuous.
Finding the frequency of the series limit graphically
The following is a list of the frequencies of the seven most widely spaced lines in the Lyman series, together with the increase in frequency between successive lines.
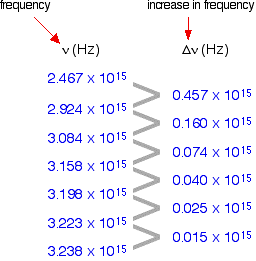
As the lines become closer together, the increase in frequency is lessened. At the series limit, the gap between the lines is zero. Consequently, if the increase in frequency is plotted against the actual frequency, the curve can be extrapolated to the point at which the increase becomes zero, the frequency of the series limit.
In fact, two graphs can be plotted from the data in the table above. The frequency difference is related to two frequencies. For example, the figure of 0.457 is found by subtracting 2.467 from 2.924. Which of the two values should be plotted against 0.457 does not matter, as long as consistency is maintained—the difference must always be plotted against either the higher or the lower figure. At the limit, the two frequency numbers are the same.
As illustrated in the graph below, plotting both of the possible curves on the same graph makes it easier to decide exactly how to extrapolate the curves. Because these are curves, they are much more difficult to extrapolate than straight lines.
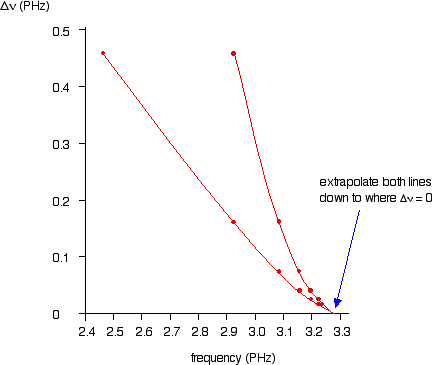
Both lines indicate a series limit at about 3.28 x 10¹⁵ Hz.
With this information, it is possible calculate the energy needed to remove a single electron from a hydrogen atom. Recall the equation above:

The energy gap between the ground state and the point at which the electron leaves the atom can be determined by substituting the frequency and looking up the value of Planck's constant from a data book.
\[ \begin{eqnarray} \Delta E &=& h\nu \\ &=& (6.626 \times 10^{-34})(3.28 \times 10^{15}) \\ &=& 2.173 \times 10^{-18}\ J \end{eqnarray} \]
This is the ionization energy for a single atom. To find the normally quoted ionization energy, this value is multiplied by the number of atoms in a mole of hydrogen atoms (the Avogadro constant) and then dividing by 1000 to convert joules to kilojoules.
\[\begin{eqnarray} Ionization\ energy &=& (2.173 \times 10^{-18})( 6.022 \times 10^{23})( \frac{1}{1000}) \\ &=& 1310\ kJ\ mol^{-1} \end{eqnarray} \]
This compares well with the normally quoted value for hydrogen's ionization energy of 1312 kJ mol-1.


