
NMR Spectroscopy 2
- Page ID
- 5121
\( \newcommand{\vecs}[1]{\overset { \scriptstyle \rightharpoonup} {\mathbf{#1}} } \)
\( \newcommand{\vecd}[1]{\overset{-\!-\!\rightharpoonup}{\vphantom{a}\smash {#1}}} \)
\( \newcommand{\dsum}{\displaystyle\sum\limits} \)
\( \newcommand{\dint}{\displaystyle\int\limits} \)
\( \newcommand{\dlim}{\displaystyle\lim\limits} \)
\( \newcommand{\id}{\mathrm{id}}\) \( \newcommand{\Span}{\mathrm{span}}\)
( \newcommand{\kernel}{\mathrm{null}\,}\) \( \newcommand{\range}{\mathrm{range}\,}\)
\( \newcommand{\RealPart}{\mathrm{Re}}\) \( \newcommand{\ImaginaryPart}{\mathrm{Im}}\)
\( \newcommand{\Argument}{\mathrm{Arg}}\) \( \newcommand{\norm}[1]{\| #1 \|}\)
\( \newcommand{\inner}[2]{\langle #1, #2 \rangle}\)
\( \newcommand{\Span}{\mathrm{span}}\)
\( \newcommand{\id}{\mathrm{id}}\)
\( \newcommand{\Span}{\mathrm{span}}\)
\( \newcommand{\kernel}{\mathrm{null}\,}\)
\( \newcommand{\range}{\mathrm{range}\,}\)
\( \newcommand{\RealPart}{\mathrm{Re}}\)
\( \newcommand{\ImaginaryPart}{\mathrm{Im}}\)
\( \newcommand{\Argument}{\mathrm{Arg}}\)
\( \newcommand{\norm}[1]{\| #1 \|}\)
\( \newcommand{\inner}[2]{\langle #1, #2 \rangle}\)
\( \newcommand{\Span}{\mathrm{span}}\) \( \newcommand{\AA}{\unicode[.8,0]{x212B}}\)
\( \newcommand{\vectorA}[1]{\vec{#1}} % arrow\)
\( \newcommand{\vectorAt}[1]{\vec{\text{#1}}} % arrow\)
\( \newcommand{\vectorB}[1]{\overset { \scriptstyle \rightharpoonup} {\mathbf{#1}} } \)
\( \newcommand{\vectorC}[1]{\textbf{#1}} \)
\( \newcommand{\vectorD}[1]{\overrightarrow{#1}} \)
\( \newcommand{\vectorDt}[1]{\overrightarrow{\text{#1}}} \)
\( \newcommand{\vectE}[1]{\overset{-\!-\!\rightharpoonup}{\vphantom{a}\smash{\mathbf {#1}}}} \)
\( \newcommand{\vecs}[1]{\overset { \scriptstyle \rightharpoonup} {\mathbf{#1}} } \)
\(\newcommand{\longvect}{\overrightarrow}\)
\( \newcommand{\vecd}[1]{\overset{-\!-\!\rightharpoonup}{\vphantom{a}\smash {#1}}} \)
\(\newcommand{\avec}{\mathbf a}\) \(\newcommand{\bvec}{\mathbf b}\) \(\newcommand{\cvec}{\mathbf c}\) \(\newcommand{\dvec}{\mathbf d}\) \(\newcommand{\dtil}{\widetilde{\mathbf d}}\) \(\newcommand{\evec}{\mathbf e}\) \(\newcommand{\fvec}{\mathbf f}\) \(\newcommand{\nvec}{\mathbf n}\) \(\newcommand{\pvec}{\mathbf p}\) \(\newcommand{\qvec}{\mathbf q}\) \(\newcommand{\svec}{\mathbf s}\) \(\newcommand{\tvec}{\mathbf t}\) \(\newcommand{\uvec}{\mathbf u}\) \(\newcommand{\vvec}{\mathbf v}\) \(\newcommand{\wvec}{\mathbf w}\) \(\newcommand{\xvec}{\mathbf x}\) \(\newcommand{\yvec}{\mathbf y}\) \(\newcommand{\zvec}{\mathbf z}\) \(\newcommand{\rvec}{\mathbf r}\) \(\newcommand{\mvec}{\mathbf m}\) \(\newcommand{\zerovec}{\mathbf 0}\) \(\newcommand{\onevec}{\mathbf 1}\) \(\newcommand{\real}{\mathbb R}\) \(\newcommand{\twovec}[2]{\left[\begin{array}{r}#1 \\ #2 \end{array}\right]}\) \(\newcommand{\ctwovec}[2]{\left[\begin{array}{c}#1 \\ #2 \end{array}\right]}\) \(\newcommand{\threevec}[3]{\left[\begin{array}{r}#1 \\ #2 \\ #3 \end{array}\right]}\) \(\newcommand{\cthreevec}[3]{\left[\begin{array}{c}#1 \\ #2 \\ #3 \end{array}\right]}\) \(\newcommand{\fourvec}[4]{\left[\begin{array}{r}#1 \\ #2 \\ #3 \\ #4 \end{array}\right]}\) \(\newcommand{\cfourvec}[4]{\left[\begin{array}{c}#1 \\ #2 \\ #3 \\ #4 \end{array}\right]}\) \(\newcommand{\fivevec}[5]{\left[\begin{array}{r}#1 \\ #2 \\ #3 \\ #4 \\ #5 \\ \end{array}\right]}\) \(\newcommand{\cfivevec}[5]{\left[\begin{array}{c}#1 \\ #2 \\ #3 \\ #4 \\ #5 \\ \end{array}\right]}\) \(\newcommand{\mattwo}[4]{\left[\begin{array}{rr}#1 \amp #2 \\ #3 \amp #4 \\ \end{array}\right]}\) \(\newcommand{\laspan}[1]{\text{Span}\{#1\}}\) \(\newcommand{\bcal}{\cal B}\) \(\newcommand{\ccal}{\cal C}\) \(\newcommand{\scal}{\cal S}\) \(\newcommand{\wcal}{\cal W}\) \(\newcommand{\ecal}{\cal E}\) \(\newcommand{\coords}[2]{\left\{#1\right\}_{#2}}\) \(\newcommand{\gray}[1]{\color{gray}{#1}}\) \(\newcommand{\lgray}[1]{\color{lightgray}{#1}}\) \(\newcommand{\rank}{\operatorname{rank}}\) \(\newcommand{\row}{\text{Row}}\) \(\newcommand{\col}{\text{Col}}\) \(\renewcommand{\row}{\text{Row}}\) \(\newcommand{\nul}{\text{Nul}}\) \(\newcommand{\var}{\text{Var}}\) \(\newcommand{\corr}{\text{corr}}\) \(\newcommand{\len}[1]{\left|#1\right|}\) \(\newcommand{\bbar}{\overline{\bvec}}\) \(\newcommand{\bhat}{\widehat{\bvec}}\) \(\newcommand{\bperp}{\bvec^\perp}\) \(\newcommand{\xhat}{\widehat{\xvec}}\) \(\newcommand{\vhat}{\widehat{\vvec}}\) \(\newcommand{\uhat}{\widehat{\uvec}}\) \(\newcommand{\what}{\widehat{\wvec}}\) \(\newcommand{\Sighat}{\widehat{\Sigma}}\) \(\newcommand{\lt}{<}\) \(\newcommand{\gt}{>}\) \(\newcommand{\amp}{&}\) \(\definecolor{fillinmathshade}{gray}{0.9}\)Chemical Shifts
The NMR spectra is displayed as a plot of the applied radio frequency versus the absorption. The applied frequency increases from left to right, thus the left side of the plot is the low field, downfield or deshielded side and the right side of the plot is the high field, upfield or shielded side (see the figure below). The concept of shielding will be explained shortly.
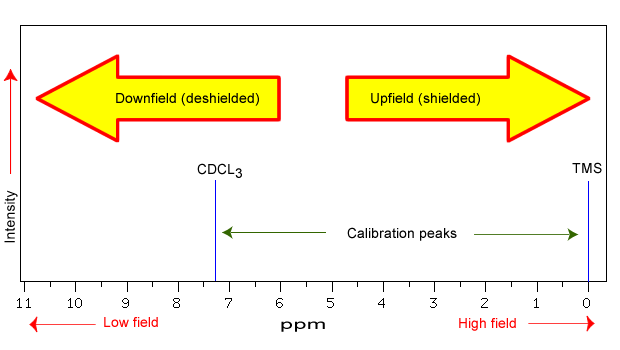
The position on the plot at which the nuclei absorbs is called the chemical shift. Since this has an arbitrary value a standard reference point must be used. The two most common standards are TMS (tetramethylsilane, (Si(CH3)4) which has been assigned a chemical shift of zero, and CDCl3 (deuterochloroform) which has a chemical shift of 7.26 for 1H NMR and 77 for 13C NMR.
The scale is commonly expressed as parts per million (ppm) which is independent of the spectrometer frequency. The scale is the delta (δ) scale.

The range at which most NMR absorptions occur is quite narrow. Almost all 1H absorptions occur downfield within 10 ppm of TMS. For 13C NMR almost all absorptions occurs within 220 ppm downfield of the C atom in TMS.
Shielding in NMR
Structural features of the molecule will have an effect on the exact magnitude of the magnetic field experienced by a particular nucleus. This means that H atoms which have different chemical environments will have different chemical shifts. This is what makes NMR so useful for structure determination in organic chemistry. There are three main features that will affect the shielding of the nucleus, electronegativity, magnetic anisotropy of π systems and hydrogen bonding.
Electronegativity
The electrons that surround the nucleus are in motion so they created their own electromagnetic field. This field opposes the the applied magnetic field and so reduces the field experienced by the nucleus. Thus the electrons are said to shield the nucleus. Since the magnetic field experienced at the nucleus defines the energy difference between spin states it also defines what the chemical shift will be for that nucleus. Electron with-drawing groups can decrease the electron density at the nucleus, deshielding the nucleus and result in a larger chemical shift. Compare the data in the table below.
| Compound, CH3X | CH3F | CH3OH | CH3Cl | CH3Br | CH3I | CH4 | (CH3)4Si |
| Electronegativity of X | 4.0 | 3.5 | 3.1 | 2.8 | 2.5 | 2.1 | 1.8 |
| Chemical shift δ (ppm) | 4.26 | 3.4 | 3.05 | 2.68 | 2.16 | 0.23 | 0 |
As can be seen from the data, as the electronegativity of X increases the chemical shift, δ increases. This is an effect of the halide atom pulling the electron density away from the methyl group. This exposes the nuclei of both the C and H atoms, "deshielding" the nuclei and shifting the peak downfield.
The effects are cumulative so the presence of more electron withdrawing groups will produce a greater deshielding and therefore a larger chemical shift, i.e.
| Compound | CH4 | CH3Cl | CH2Cl2 | CHCl3 |
| δ (ppm) | 0.23 | 3.05 | 5.30 | 7.27 |
These inductive effects are not only felt by the immediately adjacent atoms, but the deshielding can occur further down the chain, i.e.
| NMR signal | -CH2-CH2-CH2Br |
| δ (ppm) | 1.25 1.69 3.30 |
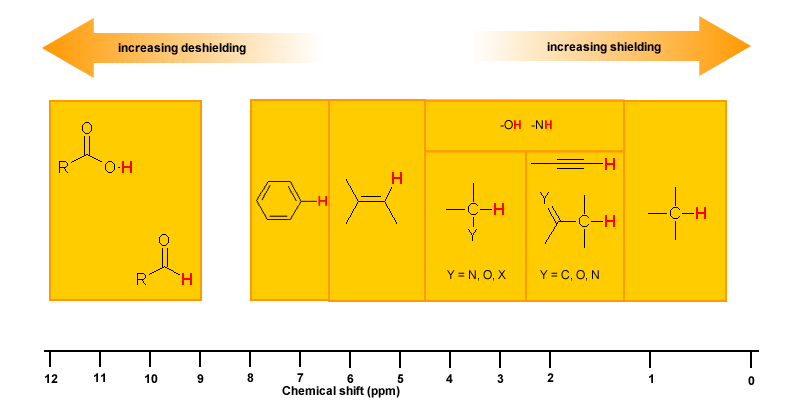
Magnetic Anisotropy: π Electron Effects
The π electrons in a compound, when placed in a magnetic field, will move and generate their own magnetic field. The new magnetic field will have an effect on the shielding of atoms within the field. The best example of this is benzene (see the figure below).

This effect is common for any atoms near a π bond, i.e.
| Proton Type | Effect | Chemical shift (ppm) |
| C6H5-H | highly deshielded | 6.5 - 8 |
| C=C-H | deshielded | 4.5 - 6 |
| C≡C-H | shielded* | ~2.5 |
| O=C-H | very highly deshielded | 9 - 10 |
| * the acetylene H is shielded due to its location relative to the π system | ||
Hydrogen Bonding
Protons that are involved in hydrogen bonding (i.e.-OH or -NH) are usually observed over a wide range of chemical shifts. This is due to the deshielding that occurs in the hydrogen bond. Since hydrogen bonds are dynamic, constantly forming, breaking and forming again, there will be a wide range of hydrogen bonds strengths and consequently a wide range of deshielding. This as well as solvation effects, acidity, concentration and temperature make it very difficult to predict the chemical shifts for these atoms.
Experimentally -OH and -NH can be identified by carrying out a simple D2O exchange experiment since these protons are exchangeable.
- run the normal H-NMR experiment on your sample
- add a few drops of D2O
- re-run the H-NMR experiment
- compare the two spectra and look for peaks that have "disappeared"
