
16.3: Elections- Voter Turnout
- Page ID
- 252220
\( \newcommand{\vecs}[1]{\overset { \scriptstyle \rightharpoonup} {\mathbf{#1}} } \)
\( \newcommand{\vecd}[1]{\overset{-\!-\!\rightharpoonup}{\vphantom{a}\smash {#1}}} \)
\( \newcommand{\dsum}{\displaystyle\sum\limits} \)
\( \newcommand{\dint}{\displaystyle\int\limits} \)
\( \newcommand{\dlim}{\displaystyle\lim\limits} \)
\( \newcommand{\id}{\mathrm{id}}\) \( \newcommand{\Span}{\mathrm{span}}\)
( \newcommand{\kernel}{\mathrm{null}\,}\) \( \newcommand{\range}{\mathrm{range}\,}\)
\( \newcommand{\RealPart}{\mathrm{Re}}\) \( \newcommand{\ImaginaryPart}{\mathrm{Im}}\)
\( \newcommand{\Argument}{\mathrm{Arg}}\) \( \newcommand{\norm}[1]{\| #1 \|}\)
\( \newcommand{\inner}[2]{\langle #1, #2 \rangle}\)
\( \newcommand{\Span}{\mathrm{span}}\)
\( \newcommand{\id}{\mathrm{id}}\)
\( \newcommand{\Span}{\mathrm{span}}\)
\( \newcommand{\kernel}{\mathrm{null}\,}\)
\( \newcommand{\range}{\mathrm{range}\,}\)
\( \newcommand{\RealPart}{\mathrm{Re}}\)
\( \newcommand{\ImaginaryPart}{\mathrm{Im}}\)
\( \newcommand{\Argument}{\mathrm{Arg}}\)
\( \newcommand{\norm}[1]{\| #1 \|}\)
\( \newcommand{\inner}[2]{\langle #1, #2 \rangle}\)
\( \newcommand{\Span}{\mathrm{span}}\) \( \newcommand{\AA}{\unicode[.8,0]{x212B}}\)
\( \newcommand{\vectorA}[1]{\vec{#1}} % arrow\)
\( \newcommand{\vectorAt}[1]{\vec{\text{#1}}} % arrow\)
\( \newcommand{\vectorB}[1]{\overset { \scriptstyle \rightharpoonup} {\mathbf{#1}} } \)
\( \newcommand{\vectorC}[1]{\textbf{#1}} \)
\( \newcommand{\vectorD}[1]{\overrightarrow{#1}} \)
\( \newcommand{\vectorDt}[1]{\overrightarrow{\text{#1}}} \)
\( \newcommand{\vectE}[1]{\overset{-\!-\!\rightharpoonup}{\vphantom{a}\smash{\mathbf {#1}}}} \)
\( \newcommand{\vecs}[1]{\overset { \scriptstyle \rightharpoonup} {\mathbf{#1}} } \)
\(\newcommand{\longvect}{\overrightarrow}\)
\( \newcommand{\vecd}[1]{\overset{-\!-\!\rightharpoonup}{\vphantom{a}\smash {#1}}} \)
\(\newcommand{\avec}{\mathbf a}\) \(\newcommand{\bvec}{\mathbf b}\) \(\newcommand{\cvec}{\mathbf c}\) \(\newcommand{\dvec}{\mathbf d}\) \(\newcommand{\dtil}{\widetilde{\mathbf d}}\) \(\newcommand{\evec}{\mathbf e}\) \(\newcommand{\fvec}{\mathbf f}\) \(\newcommand{\nvec}{\mathbf n}\) \(\newcommand{\pvec}{\mathbf p}\) \(\newcommand{\qvec}{\mathbf q}\) \(\newcommand{\svec}{\mathbf s}\) \(\newcommand{\tvec}{\mathbf t}\) \(\newcommand{\uvec}{\mathbf u}\) \(\newcommand{\vvec}{\mathbf v}\) \(\newcommand{\wvec}{\mathbf w}\) \(\newcommand{\xvec}{\mathbf x}\) \(\newcommand{\yvec}{\mathbf y}\) \(\newcommand{\zvec}{\mathbf z}\) \(\newcommand{\rvec}{\mathbf r}\) \(\newcommand{\mvec}{\mathbf m}\) \(\newcommand{\zerovec}{\mathbf 0}\) \(\newcommand{\onevec}{\mathbf 1}\) \(\newcommand{\real}{\mathbb R}\) \(\newcommand{\twovec}[2]{\left[\begin{array}{r}#1 \\ #2 \end{array}\right]}\) \(\newcommand{\ctwovec}[2]{\left[\begin{array}{c}#1 \\ #2 \end{array}\right]}\) \(\newcommand{\threevec}[3]{\left[\begin{array}{r}#1 \\ #2 \\ #3 \end{array}\right]}\) \(\newcommand{\cthreevec}[3]{\left[\begin{array}{c}#1 \\ #2 \\ #3 \end{array}\right]}\) \(\newcommand{\fourvec}[4]{\left[\begin{array}{r}#1 \\ #2 \\ #3 \\ #4 \end{array}\right]}\) \(\newcommand{\cfourvec}[4]{\left[\begin{array}{c}#1 \\ #2 \\ #3 \\ #4 \end{array}\right]}\) \(\newcommand{\fivevec}[5]{\left[\begin{array}{r}#1 \\ #2 \\ #3 \\ #4 \\ #5 \\ \end{array}\right]}\) \(\newcommand{\cfivevec}[5]{\left[\begin{array}{c}#1 \\ #2 \\ #3 \\ #4 \\ #5 \\ \end{array}\right]}\) \(\newcommand{\mattwo}[4]{\left[\begin{array}{rr}#1 \amp #2 \\ #3 \amp #4 \\ \end{array}\right]}\) \(\newcommand{\laspan}[1]{\text{Span}\{#1\}}\) \(\newcommand{\bcal}{\cal B}\) \(\newcommand{\ccal}{\cal C}\) \(\newcommand{\scal}{\cal S}\) \(\newcommand{\wcal}{\cal W}\) \(\newcommand{\ecal}{\cal E}\) \(\newcommand{\coords}[2]{\left\{#1\right\}_{#2}}\) \(\newcommand{\gray}[1]{\color{gray}{#1}}\) \(\newcommand{\lgray}[1]{\color{lightgray}{#1}}\) \(\newcommand{\rank}{\operatorname{rank}}\) \(\newcommand{\row}{\text{Row}}\) \(\newcommand{\col}{\text{Col}}\) \(\renewcommand{\row}{\text{Row}}\) \(\newcommand{\nul}{\text{Nul}}\) \(\newcommand{\var}{\text{Var}}\) \(\newcommand{\corr}{\text{corr}}\) \(\newcommand{\len}[1]{\left|#1\right|}\) \(\newcommand{\bbar}{\overline{\bvec}}\) \(\newcommand{\bhat}{\widehat{\bvec}}\) \(\newcommand{\bperp}{\bvec^\perp}\) \(\newcommand{\xhat}{\widehat{\xvec}}\) \(\newcommand{\vhat}{\widehat{\vvec}}\) \(\newcommand{\uhat}{\widehat{\uvec}}\) \(\newcommand{\what}{\widehat{\wvec}}\) \(\newcommand{\Sighat}{\widehat{\Sigma}}\) \(\newcommand{\lt}{<}\) \(\newcommand{\gt}{>}\) \(\newcommand{\amp}{&}\) \(\definecolor{fillinmathshade}{gray}{0.9}\)Learning Objectives
- Identify factors that motivate registered voters to vote
- Discuss circumstances that prevent citizens from voting
- Analyze reasons for low voter turnout in the United States
Counting Voters
Low voter turnout has long caused concern and frustration. A healthy society is expected to be filled with civically engaged citizens who vote regularly and participate in the electoral process.
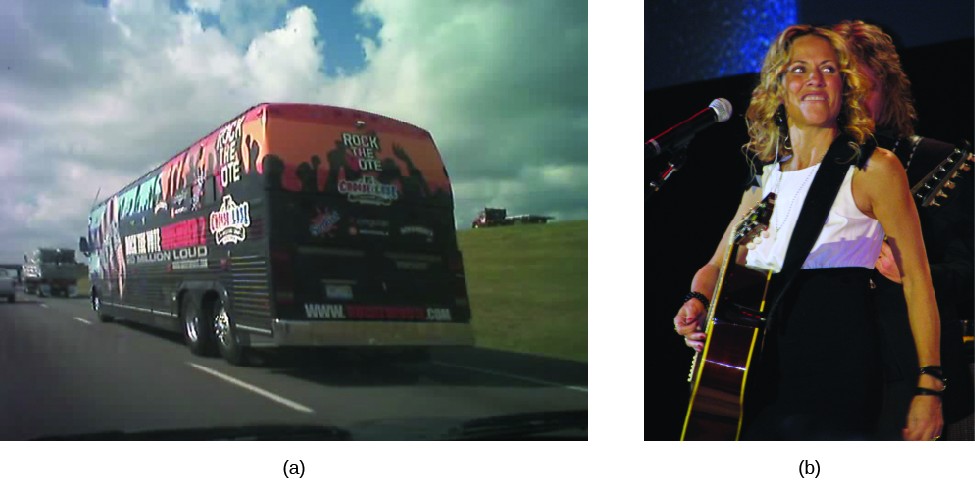
 Interested in mobilizing voters? Explore Rock the Vote and The Voter Participation Center for more information.
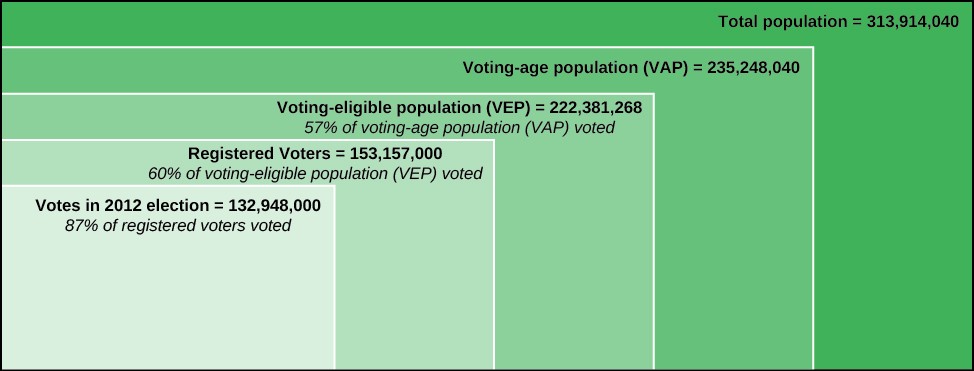
Calculating voter turnout begins by counting how many ballots were cast in a particular election. These votes must be cast on time, either by mail or in person. The next step is to count how many people could have voted in the same election. The voting-age population (VAP) consists of persons who are eighteen and older. Some of these persons may not be eligible to vote in their state, but they are included because they are of age to do so.[1]
An even smaller group is the voting-eligible population (VEP), citizens eighteen and older who, whether they have registered or not, are eligible to vote because they are citizens, mentally competent, and not imprisoned. If a state has more stringent requirements, such as not having a felony conviction, citizens counted in the VEP must meet those criteria as well. This population is much harder to measure, but statisticians who use the VEP will generally take the VAP and subtract the state’s prison population and any other known group that cannot vote. This results in a number that is somewhat theoretical; however, in a way, it is more accurate when determining voter turnout.[2]
The last and smallest population is registered voters, who, as the name implies, are citizens currently registered to vote. Now we can appreciate how reports of voter turnout can vary. Although 87 percent of registered voters voted in the 2012 presidential election, this represents only 42 percent of the total U.S. population. While 42 percent is indeed low and might cause alarm, some people included in it are under eighteen, not citizens, or unable to vote due to competency or prison status. The next number shows that just over 57 percent of the voting-age population voted, and 60 percent of the voting-eligible population. The best turnout ratio is calculated using the smallest population: 87 percent of registered voters voted. Those who argue that a healthy democracy needs high voter turnout will look at the voting-age population or voting-eligible population as proof that the United States has a problem. Those who believe only informed and active citizens should vote point to the registered voter turnout numbers instead.
What Factors Drive Voter Turnout?
Those who are registered and did vote in the last election are likely to have a strong interest in politics and elections and will vote again, provided they are not angry with the political system or politicians.
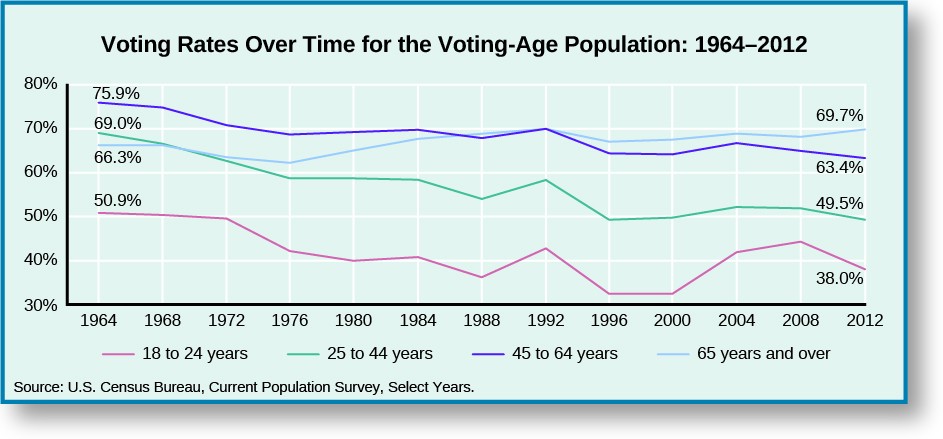
Younger people are often still in college, perhaps working part-time and earning low wages. They are unlikely to be receiving government benefits beyond Pell Grants or government-subsidized tuition and loans. They are also unlikely to be paying taxes at a high rate. Government is a distant concept rather than a daily concern, which may drive down turnout.
In 2012, for example, the Census Bureau reported that only 53.6 percent of eligible voters between the ages of eighteen and twenty-four registered and 41.2 percent voted, while 79.7 percent of sixty-five to seventy-four-year-olds registered and 73.5 percent voted.[3]

A citizen’s socioeconomic status—the combination of education, income, and social status—may also predict whether he or she will vote. Among those who have completed college, the 2012 voter turnout rate jumps to 75 percent of eligible voters, compared to about 52.6 percent for those who have completed only high school.[4]
This is due in part to the powerful effect of education, one of the strongest predictors of voting turnout. Income also has a strong effect on the likelihood of voting. Citizens earning $100,000 to $149,999 a year are very likely to vote and 76.9 percent of them do, while only 50.4 percent of those who earn $15,000 to $19,999 vote.[5]
Once high income and college education are combined, the resulting high socioeconomic status strongly predicts the likelihood that a citizen will vote.
Race is also a factor. Caucasians turn out to vote in the highest numbers, with 63 percent of white citizens voting in 2012. In comparison, 62 percent of African Americans, 31.3 percent of Asian Americans, and 31.8 percent of Hispanic citizens voted in 2012. Voting turnout can increase or decrease based upon the political culture of a state. Hispanics, for example, often vote in higher numbers in states where there has historically been higher Hispanic involvement and representation, such as New Mexico, where 49 percent of Hispanic voters turned out in 2012.[6]

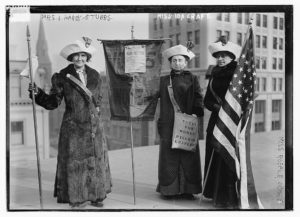
While less of a factor today, gender has historically been a factor in voter turnout. After 1920, when the Nineteenth Amendment gave women the right to vote, women began slowly turning out to vote, and now they do so in high numbers. Today, more women vote than men. In 2012, 59.7 percent of men and 63.7 percent of women reported voting.[7]
Check out this website to find out who is voting and who isn’t.
What Factors Decrease Voter Turnout?
Just as political scientists and campaign managers worry about who does vote, they also look at why people choose to stay home on Election Day. Over the years, studies have explored why a citizen might not vote. The reasons range from the obvious excuse of being too busy (19 percent) to more complex answers, such as transportation problems (3.3 percent) and restrictive registration laws (5.5 percent).[8] With only 57 percent of our voting-age population (VAP) voting in the presidential election of 2012,[9] however, we should examine why the rest do not participate.
One prominent reason for low national turnout is that participation is not mandated. Some countries, such as Belgium and Turkey, have compulsory voting laws, which require citizens to vote in elections or pay a fine. This helps the two countries attain VAP turnouts of 87 percent and 86 percent, respectively, compared to the U.S. turnout of 54 percent. Sweden and Germany automatically register their voters, and 83 percent and 66 percent vote, respectively. Chile’s decision to move from compulsory voting to voluntary voting caused a drop in participation from 87 percent to 46 percent.[10]
Do you wonder what voter turnout looks like in other developed countries? Visit the Pew Research Center report on international voting turnout to find out.
Voter turnout may be affected by voter identification laws. The American Civil Liberties Union and other groups argue an unfair burden on people who are poor, older, or have limited finances, while states argue it would prevent fraud. In Crawford v. Marion County Election Board (2008), the Supreme Court decided that Indiana’s voter identification requirement was constitutional.[11]
In 2011, Texas passed a photo identification law for voters, allowing concealed-handgun permits as identification. The Texas law was blocked by the Obama administration before it could be implemented, because Texas was on the Voting Rights Act’s preclearance list. Other states, such as Alabama, Alaska, Arizona, Georgia, and Virginia similarly had laws and districting changes blocked.[12]
As a result, Shelby County, Alabama, and several other states sued the U.S. attorney general, arguing the Voting Rights Act’s preclearance list was unconstitutional and that the formula that determined whether states had violated the VRA was outdated. In Shelby County v. Holder (2013), the Supreme Court agreed. In a 5–4 decision, the justices in the majority said the formula for placing states on the VRA preclearance list was outdated and reached into the states’ authority to oversee elections.[13] States and counties on the preclearance list were released, and Congress was told to design new guidelines for placing states on the list.
Another reason for not voting is that polling places may be open only on Election Day. This makes it difficult for voters juggling school, work, and child care during polling hours. Many states have tried to address this problem with early voting, which opens polling places as much as two weeks early. Texas opened polling places on weekdays and weekends in 1988 and initially saw an increase in voting in gubernatorial and presidential elections, although the impact tapered off over time.[14] Other states with early voting, however, showed a decline in turnout, possibly because there is less social pressure to vote when voting is spread over several days.[15]
In a similar effort, Oregon, Colorado, and Washington have moved to a mail-only voting system in which there are no polling locations, only mailed ballots. These states have seen a rise in turnout, with Colorado’s numbers increasing from 1.8 million votes in the 2010 congressional elections to 2 million votes in the 2014 congressional elections.[16]
Apathy may also play a role. Some people avoid voting because their vote is unlikely to make a difference or the election is not competitive. If one party has a clear majority in a state or district, for instance, members of the minority party may see no reason to vote. Democrats in Utah and Republicans in California are so outnumbered that they are unlikely to affect the outcome of an election, and they may opt to stay home. Because the presidential candidate with the highest number of popular votes receives all of Utah’s and California’s electoral votes, there is little incentive for some citizens to vote: they will never change the outcome of the state-level election. These citizens, as well as those who vote for third parties like the Green Party or the Libertarian Party, are sometimes referred to as the chronic minority. While third-party candidates sometimes win local or state office or even dramatize an issue for national discussion, such as when Ross Perot discussed the national debt during his campaign as an independent presidential candidate in 1992, they never win national elections.
Finally, some voters may view non-voting as a means of social protest or may see volunteering as a better way to spend their time. Younger voters are more likely to volunteer their time rather than vote, believing that serving others is more important than voting.[17]
Possibly related to this choice is voter fatigue. In many states, due to our federal structure with elections at many levels of government, voters may vote many times per year on ballots filled with candidates and issues to research. The less time there is between elections, the lower the turnout.[18]
Questions to Consider
- What recommendations would you make to increase voter turnout in the United States?
- Why does age affect whether a citizen will vote?
- If you were going to predict whether your classmates would vote in the next election, what questions would you ask them?
Terms to Remember
early voting–an accommodation that allows voting up to two weeks before Election Day
voter fatigue–the result when voters grow tired of voting and stay home from the polls
voter turnout–number of citizens voting in a given election
- Michael P. McDonald and Samuel Popkin. 2001. "Myth of the Vanishing Voter," American Political Science Review 95, No. 4: 963–974; See also, "What is the Voting-Age Population (VAP) and the Voting-Eligible Population (VEP)?" http://www.electproject.org/home/voter-turnout/faq/denominator (November 12, 2015). ↵
- McDonald and Popkin, "Myth of the Vanishing Voter," 963–974. ↵
- "Table 2. Reported Voting and Registration, by Race, Hispanic Origin, Sex, and Age, for the United States: November 2012," https://www.census.gov/hhes/www/socdemo/voting/publications/p20/2012/tables.html (November 6, 2015). ↵
- "Table 5. Reported Voting and Registration, by Age, Sex, and Educational Attainment: November 2012," https://www.census.gov/hhes/www/socdemo/voting/publications/p20/2012/tables.html (November 6, 2015). ↵
- "Table 7. Reported Voting and Registration of Family Members, by Age and Family Income: November 2012," https://www.census.gov/hhes/www/socdemo/voting/publications/p20/2012/tables.html (November 5, 2015). ↵
- "Table 4b. Reported Voting and Registration, by Sex, Race and Hispanic Origin, for States: November 2012," https://www.census.gov/hhes/www/socdemo/voting/publications/p20/2012/tables.html (November 2, 2015). ↵
- "Table 1. Reported Voting and Registration, by Sex and Single Years of Age: November 2012," https://www.census.gov/hhes/www/socdemo/voting/publications/p20/2012/tables.html (November 2, 2015). ↵
- "Table 10. Reported Voting and Registration, by Sex and Single Years of Age: November 2012," https://www.census.gov/hhes/www/socdemo/voting/publications/p20/2012/tables.html (November 2, 2015). ↵
- Table 1. Reported Voting and Registration, by Sex and Single Years of Age: November 2012. Calculated using total number of people voted divided by total population. ↵
- Drew Desilver. 6 May 2015. "U.S. Voter Turnout trails Most Developed Countries," http://www.pewresearch.org/fact-tank/2015/05/06/u-s-voter-turnout-trails-most-developed-countries. ↵
- David Stout, "Supreme Court Upholds Voter Identification Law in Indiana," New York Times, 29 April 2008; Crawford v. Marion County Election Board, 553 U.S. 181 (2008). ↵
- "Jurisdictions Previously Covered by Section 5," http://www.justice.gov/crt/jurisdictions-previously-covered-section-5 (November 1, 2015). ↵
- Shelby County v. Holder, 570 U.S. ___ (2013). ↵
- Stefan D. Haag, "Early Voting in Texas: What are the Effects?" Austin Community College CPPPS Report, http://www.austincc.edu/cppps/earlyvotingfull/report5.pdf (November 1, 2015). ↵
- Rich Morin. 23 September 2013. "Early Voting Associated with Lower Turnout," http://www.pewresearch.org/fact-tank/2013/09/23/study-early-voting-associated-with-lower-turnout. ↵
- The Denver Post Editorial Board, "A Vote of Confidence for Mail Elections in Colorado," Denver Post, 10 November 2014. ↵
- Harvard IOP, "Trump, Carson Lead Republican Primary; Sanders Edging Clinton Among Democrats, Harvard IOP Poll Finds," news release, December 10, 2015, http://www.iop.harvard.edu/harvard-iop-fall-2015-poll. ↵
- C. Rallings, M. Thrasher, and G. Borisyuk. 2003. "Seasonal Factors, Voter Fatigue and the Costs of Voting," Electoral Studies 22, No. 1: 65–79. ↵
- American Government. Authored by: OpenStax. Provided by: OpenStax; Rice University. Located at: https://cnx.org/contents/W8wOWXNF@12.1:Y1CfqFju@5/Preface. License: CC BY: Attribution. License Terms: Download for free at http://cnx.org/contents/9e28f580-0d1...c48329947ac2@1.
- Share icon. Authored by: Quan Do. Provided by: The Noun Project. Located at: https://thenounproject.com/term/share/7671/. License: CC BY: Attribution
- Adaption and Remix, and Original Content. Authored by: Deborah Smith Hoag. Provided by: Austin Community College. Located at: http://austincc.edu. Project: Achieving the Dream Grant. License: CC BY: Attribution