
2.3F: Visualizing TLC Plates
- Page ID
- 93522

\( \newcommand{\vecs}[1]{\overset { \scriptstyle \rightharpoonup} {\mathbf{#1}} } \)
\( \newcommand{\vecd}[1]{\overset{-\!-\!\rightharpoonup}{\vphantom{a}\smash {#1}}} \)
\( \newcommand{\id}{\mathrm{id}}\) \( \newcommand{\Span}{\mathrm{span}}\)
( \newcommand{\kernel}{\mathrm{null}\,}\) \( \newcommand{\range}{\mathrm{range}\,}\)
\( \newcommand{\RealPart}{\mathrm{Re}}\) \( \newcommand{\ImaginaryPart}{\mathrm{Im}}\)
\( \newcommand{\Argument}{\mathrm{Arg}}\) \( \newcommand{\norm}[1]{\| #1 \|}\)
\( \newcommand{\inner}[2]{\langle #1, #2 \rangle}\)
\( \newcommand{\Span}{\mathrm{span}}\)
\( \newcommand{\id}{\mathrm{id}}\)
\( \newcommand{\Span}{\mathrm{span}}\)
\( \newcommand{\kernel}{\mathrm{null}\,}\)
\( \newcommand{\range}{\mathrm{range}\,}\)
\( \newcommand{\RealPart}{\mathrm{Re}}\)
\( \newcommand{\ImaginaryPart}{\mathrm{Im}}\)
\( \newcommand{\Argument}{\mathrm{Arg}}\)
\( \newcommand{\norm}[1]{\| #1 \|}\)
\( \newcommand{\inner}[2]{\langle #1, #2 \rangle}\)
\( \newcommand{\Span}{\mathrm{span}}\) \( \newcommand{\AA}{\unicode[.8,0]{x212B}}\)
\( \newcommand{\vectorA}[1]{\vec{#1}} % arrow\)
\( \newcommand{\vectorAt}[1]{\vec{\text{#1}}} % arrow\)
\( \newcommand{\vectorB}[1]{\overset { \scriptstyle \rightharpoonup} {\mathbf{#1}} } \)
\( \newcommand{\vectorC}[1]{\textbf{#1}} \)
\( \newcommand{\vectorD}[1]{\overrightarrow{#1}} \)
\( \newcommand{\vectorDt}[1]{\overrightarrow{\text{#1}}} \)
\( \newcommand{\vectE}[1]{\overset{-\!-\!\rightharpoonup}{\vphantom{a}\smash{\mathbf {#1}}}} \)
\( \newcommand{\vecs}[1]{\overset { \scriptstyle \rightharpoonup} {\mathbf{#1}} } \)
\( \newcommand{\vecd}[1]{\overset{-\!-\!\rightharpoonup}{\vphantom{a}\smash {#1}}} \)
\(\newcommand{\avec}{\mathbf a}\) \(\newcommand{\bvec}{\mathbf b}\) \(\newcommand{\cvec}{\mathbf c}\) \(\newcommand{\dvec}{\mathbf d}\) \(\newcommand{\dtil}{\widetilde{\mathbf d}}\) \(\newcommand{\evec}{\mathbf e}\) \(\newcommand{\fvec}{\mathbf f}\) \(\newcommand{\nvec}{\mathbf n}\) \(\newcommand{\pvec}{\mathbf p}\) \(\newcommand{\qvec}{\mathbf q}\) \(\newcommand{\svec}{\mathbf s}\) \(\newcommand{\tvec}{\mathbf t}\) \(\newcommand{\uvec}{\mathbf u}\) \(\newcommand{\vvec}{\mathbf v}\) \(\newcommand{\wvec}{\mathbf w}\) \(\newcommand{\xvec}{\mathbf x}\) \(\newcommand{\yvec}{\mathbf y}\) \(\newcommand{\zvec}{\mathbf z}\) \(\newcommand{\rvec}{\mathbf r}\) \(\newcommand{\mvec}{\mathbf m}\) \(\newcommand{\zerovec}{\mathbf 0}\) \(\newcommand{\onevec}{\mathbf 1}\) \(\newcommand{\real}{\mathbb R}\) \(\newcommand{\twovec}[2]{\left[\begin{array}{r}#1 \\ #2 \end{array}\right]}\) \(\newcommand{\ctwovec}[2]{\left[\begin{array}{c}#1 \\ #2 \end{array}\right]}\) \(\newcommand{\threevec}[3]{\left[\begin{array}{r}#1 \\ #2 \\ #3 \end{array}\right]}\) \(\newcommand{\cthreevec}[3]{\left[\begin{array}{c}#1 \\ #2 \\ #3 \end{array}\right]}\) \(\newcommand{\fourvec}[4]{\left[\begin{array}{r}#1 \\ #2 \\ #3 \\ #4 \end{array}\right]}\) \(\newcommand{\cfourvec}[4]{\left[\begin{array}{c}#1 \\ #2 \\ #3 \\ #4 \end{array}\right]}\) \(\newcommand{\fivevec}[5]{\left[\begin{array}{r}#1 \\ #2 \\ #3 \\ #4 \\ #5 \\ \end{array}\right]}\) \(\newcommand{\cfivevec}[5]{\left[\begin{array}{c}#1 \\ #2 \\ #3 \\ #4 \\ #5 \\ \end{array}\right]}\) \(\newcommand{\mattwo}[4]{\left[\begin{array}{rr}#1 \amp #2 \\ #3 \amp #4 \\ \end{array}\right]}\) \(\newcommand{\laspan}[1]{\text{Span}\{#1\}}\) \(\newcommand{\bcal}{\cal B}\) \(\newcommand{\ccal}{\cal C}\) \(\newcommand{\scal}{\cal S}\) \(\newcommand{\wcal}{\cal W}\) \(\newcommand{\ecal}{\cal E}\) \(\newcommand{\coords}[2]{\left\{#1\right\}_{#2}}\) \(\newcommand{\gray}[1]{\color{gray}{#1}}\) \(\newcommand{\lgray}[1]{\color{lightgray}{#1}}\) \(\newcommand{\rank}{\operatorname{rank}}\) \(\newcommand{\row}{\text{Row}}\) \(\newcommand{\col}{\text{Col}}\) \(\renewcommand{\row}{\text{Row}}\) \(\newcommand{\nul}{\text{Nul}}\) \(\newcommand{\var}{\text{Var}}\) \(\newcommand{\corr}{\text{corr}}\) \(\newcommand{\len}[1]{\left|#1\right|}\) \(\newcommand{\bbar}{\overline{\bvec}}\) \(\newcommand{\bhat}{\widehat{\bvec}}\) \(\newcommand{\bperp}{\bvec^\perp}\) \(\newcommand{\xhat}{\widehat{\xvec}}\) \(\newcommand{\vhat}{\widehat{\vvec}}\) \(\newcommand{\uhat}{\widehat{\uvec}}\) \(\newcommand{\what}{\widehat{\wvec}}\) \(\newcommand{\Sighat}{\widehat{\Sigma}}\) \(\newcommand{\lt}{<}\) \(\newcommand{\gt}{>}\) \(\newcommand{\amp}{&}\) \(\definecolor{fillinmathshade}{gray}{0.9}\)Organic compounds most commonly appear colorless on the white background of a TLC plate, which means that after running a TLC, chemists often cannot simply see where compounds are located. The compounds have to be "visualized" after elution, which means to temporarily convert them into something visible.
Visualization methods can be either non-destructive (compound is unchanged after the process) or destructive (compound is converted into something new after the process. Viewing a TLC plate under ultraviolet light is non-destructive, while using a chemical stain is destructive.
Visualization Summary
Below is a summary of various visualization techniques, and the functional groups that generally react with each. A more detailed discussion of each technique is provided later in this section.
| UV Light: For aromatics + conjugated systems | Iodine: Visualizes ~half the time. Strongly reacts with aromatics | p-Anisaldehyde: For many aldehydes, ketones, and alcohols | Vanillin: For many aldehydes, ketones, and alcohols |
 |
 |
 |
 |
| Permanganate: For alkenes, alkynes, or oxidizable groups (aldehydes, alcohols) | Phosphomolybdic Acid (PMA): For alcohols, phenols, alkenes, and many carbonyl compounds | Iron(III) Chloride: For phenols | Bromocresol Green: For acidic compounds |
 |
 |
 |
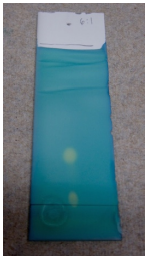 |
Table 2.4: Summary table for TLC visualization methods.
Ultraviolet Absorption
The most common non-destructive visualization method for TLC plates is ultraviolet (UV) light. A UV lamp can be used to shine either short-waved \(\left( 254 \: \text{nm} \right)\) or long-waved \(\left( 365 \: \text{nm} \right)\) ultraviolet light on a TLC plate with the touch of a button. Most commercially bought TLC plates contain a fluorescent material (e.g. zinc sulfide) in the silica or alumina, so the background of the plate will appear green when viewing with short-waved UV light. If a compound absorbs \(254 \: \text{nm}\) UV light, it will appear dark, as the compound prevents the fluorescent material from receiving the UV light.
This method is so quick and easy that it is often the first visualization method tried. It is most useful for visualizing aromatic compounds and highly conjugated systems, as these strongly absorb UV. Most other functional groups do not absorb UV light at the wavelengths used and will not appear dark under the UV lamp even though they are still there. It doesn't hurt to try UV after performing TLC with all compounds just in case. Since the compounds remain unchanged after viewing with UV light, a further visualization technique can be used afterwards on the same plate.
Procedure for UV visualization of TLC plate:
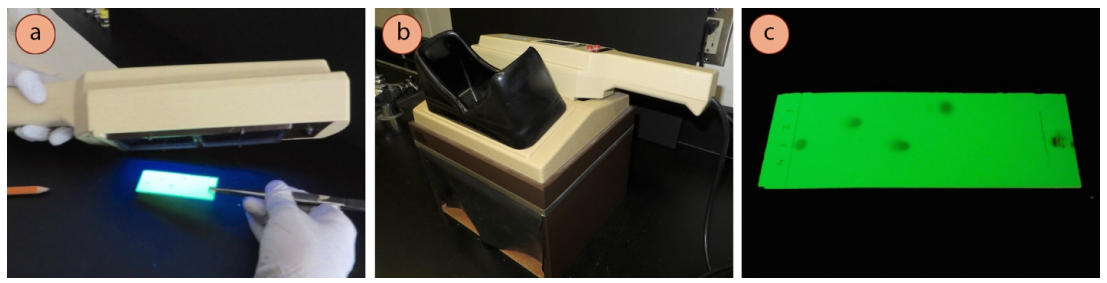
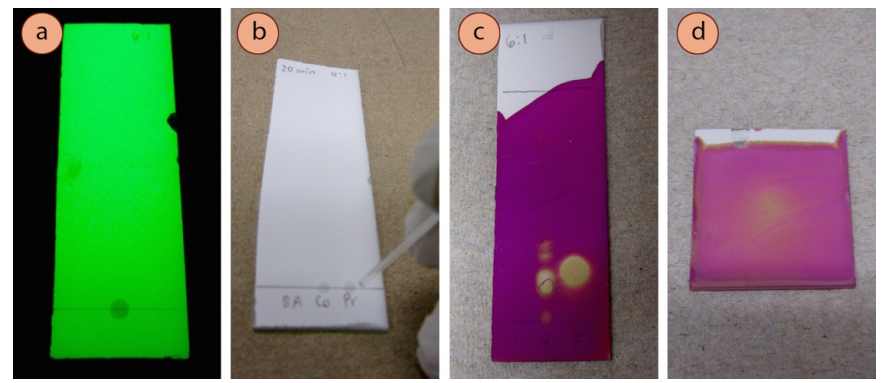
- Use a UV lamp to look at your developed TLC plate by pressing the short-waved button. Depending on what is available at your institution, you might tilt the UV lamp at an angle in a darkened area of the room (Figure 2.31a), or you might look at the plate inside a box designed to protect eyes from UV damage (Figure 2.31b).
Safety note: Care should be taken to never look directly at the UV source, and to minimize exposure to eyes. - The plate background will appear green under short-waved UV light, and UV-active compounds will appear dark (Figure 2.31c). Use a pencil to lightly circle spots, as they will disappear when the UV light is removed.
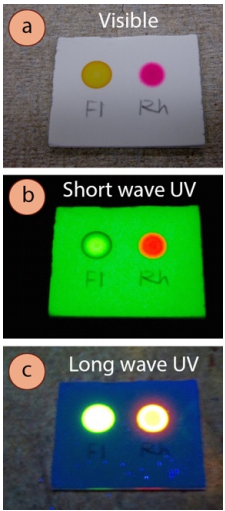
- Some compounds themselves fluoresce (Figure 2.32), appearing a variety of colors when exposed to either short- or long-waved UV light (bright purple or blue is the most common). Record these types of observations in your notebook if you see them, as they are rare, and are therefore an excellent identification tool. They are most common with highly conjugated compounds.
- The TLC plate can be further visualized with some other method if desired (iodine or a chemical stain).
Iodine
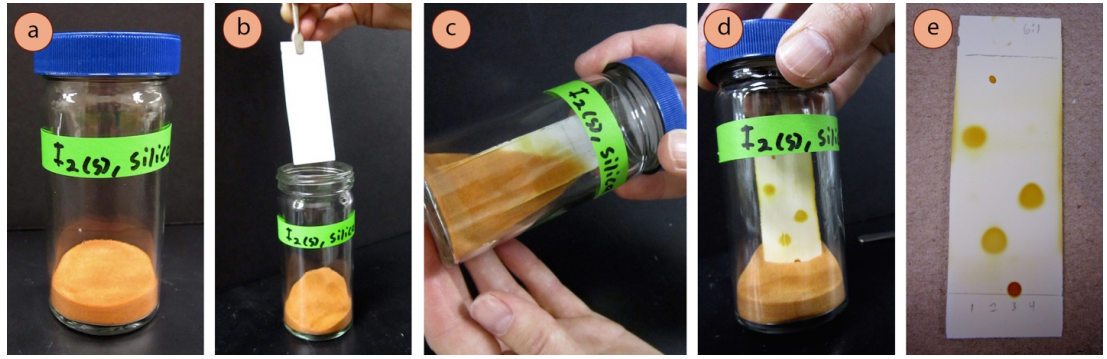
A commonly used semi-destructive visualization method is to expose a developed TLC plate to iodine \(\left( \ce{I_2} \right)\) vapor. An "iodine chamber" can be created by adding a few iodine crystals to a TLC chamber, or by adding a few iodine crystals to a chamber containing a portion of powdered silica or alumina (Figure 2.33a). When a developed TLC plate is placed in the chamber and capped, the iodine sublimes and reacts with the compounds on the plate, forming yellow-brown spots (Figure 2.33d). The coloration occurs because iodine forms colored complexes with many organic compounds. This stain will work with approximately half the compounds you may encounter.
This method is considered "semi-destructive" because complexation is reversible, and the iodine will eventually evaporate from the TLC plate, leaving the original compound behind. When the coloration fades, it is theoretically possible to use another visualization technique on the TLC plate, although it's possible the compound may have also evaporated by that time.
Procedure for visualization of TLC plate with iodine:
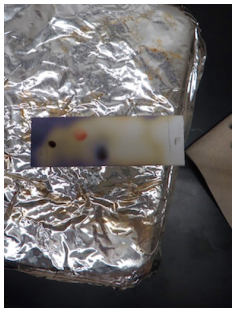
- If not already prepared, make an "iodine chamber" (Figure 2.33a): in a fume hood, place a few centimeters of powdered silica or alumina in a screw-capped TLC chamber and add a few crystals of solid iodine (safety note: silica and alumina are lung irritants, and iodine vapor is considered an irritant and toxic). A beaker and watch glass will not work in this context as the iodine vapors will escape. Let the silica or alumina and iodine sit together for a while with periodic swirling, and eventually the powder will become orange from adsorbing the iodine vapor.
- In a fume hood, place the developed TLC plate in the iodine chamber with forceps (Figure 2.33b) and close the lid. Gently shake the chamber to bury the TLC plate in the iodine-stained silica or alumina (Figure 2.33c) until the spots become colored (Figure 2.33d). Many spots will appear yellow-brown almost immediately, and may darken with extended time. For many compounds, it takes less than 10 seconds to develop a plate, but some compounds require 10 minutes or longer. (Note: alcohols, carboxylic acids, and alkyl halides often do not stain.)
- Promptly record appropriate observations of the TLC in your notebook, or circle the spots with a pencil, as the colors will soon fade as the iodine evaporates from the plate. Further visualization may be attempted after the color fades.
Chemical Stains
There are a variety of destructive visualization methods that can turn colorless compounds on a TLC plate into colored spots. A plate is either sprayed with or dipped in a reagent that undergoes a chemical reaction with a compound on the TLC plate to convert it into a colored compound, enabling the spot to be seen with the naked eye. Since a chemical reaction is occurring in the process, it is common to gently heat a plate after exposure to the reagent to speed up the reaction, although this may be unnecessary with some stains. Not every compound can be visualized with every reagent if they do not react together, and stains are often designed to work with only certain functional groups. The specific stain should be chosen based on the presumed structure of the compounds you want to visualize.
General Staining Procedure
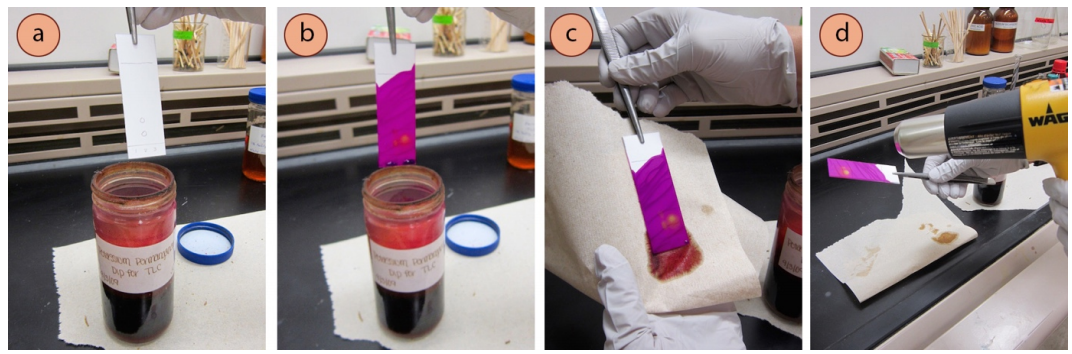
- While wearing gloves and holding the TLC plate with forceps in a fume hood, quickly dip the plate into and out of the chemical dip jar so that the stain covers the area where the solvent traveled on the plate (Figure 2.34b).
- Let excess liquid drip off the plate for a few seconds, then wipe the back of the plate with a paper towel (Figure 2.34c).
- Gently heat the plate to develop the spots. Preferably use a heat gun (Figure 2.34d), but a hotplate can also be used (Figure 2.35, charring is common).
- If using a heat gun, hold the TLC plate with forceps and wave the heat gun back and forth onto the front of the plate. The "high" setting can be used at first, with the setting turned to "low" if the plate begins to char. Safety note: Heat guns are not simple hair dryers, and can get quite hot. Be careful to not touch the nozzle, and remember that it remains hot for a long time after heating has ceased. The hot nozzles can even mar benchtops, so be cautious when setting the gun down.
- If using a hot plate, place the TLC plate on the warm surface (set between low and medium-low, and covered in foil to prevent dip residue from staining the ceramic surface). Periodically move the plate around to distribute the heat.
- A TLC plate cannot be further visualized after using a stain.
p-Anisaldehyde/Vanillin Stains
Generalities
The p-anisaldehyde and vanillin stains are general purpose, and work for many strong and weak nucleophiles (alcohols, amines), and for many aldehydes and ketones. They do not work on alkenes, aromatics, esters, or carboxylic acids. The TLC plates need to be mildly heated, and will develop a light pink to dark pink background.
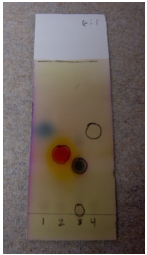
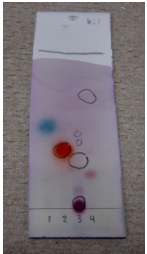
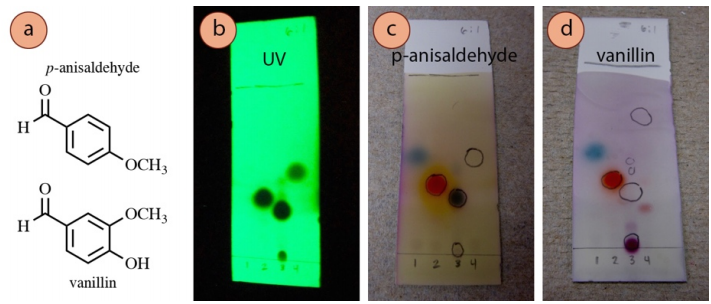
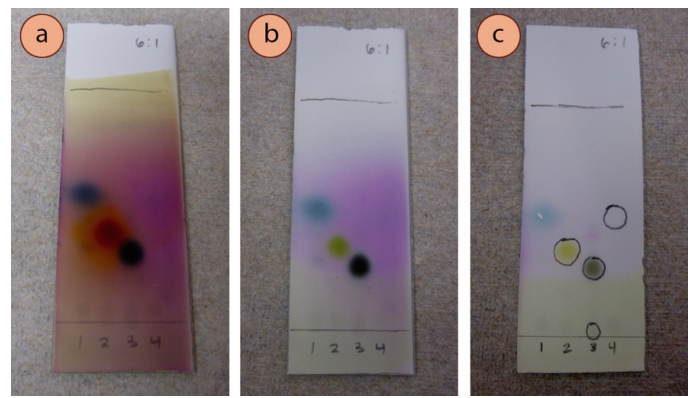
A TLC of four samples visualized with three different techniques is shown in Figure 2.36. The plate is visualized with UV light (Figure 2.36b), p-anisaldehyde stain (Figure 2.36c), and vanillin stain (Figure 2.36d). 4-heptanone (lane #1) and acetophenone (lane #2) showed similar colorations using the two stains. Ethyl benzoate (lane #4) was unreactive to both. Cinnamaldehyde (lane #3) was reactive to p-anisaldehyde but not vanillin, while its impurity (cinnamic acid, on the baseline of lane #3) showed the opposite behavior.
Recipe (p-Anisaldehyde): \(135 \: \text{mL}\) absolute ethanol, \(5 \: \text{mL}\) concentrated \(\ce{H_2SO_4}\), \(1.5 \: \text{mL}\) glacial acetic acid, and \(3.7 \: \text{mL}\) p-anisaldehyde. This stain is susceptible to degradation by light, so store wrapped in aluminum foil (Figure 2.37e), ideally in the refrigerator when not in use. Compared to other stains, this stain has a somewhat short shelf life (approximately half a year). The stain will at first be colorless (Figure 2.37a), but over time will turn to a light then dark pink (Figure 2.37b-d). The stain is less potent when it darkens, but is often still usable. Safety note: wear gloves while using this highly acidic stain.
Recipe (Vanillin): \(250 \: \text{mL}\) ethanol, \(15 \: \text{g}\) vanillin, and \(2.5 \: \text{mL}\) concentrated \(\ce{H_2SO_4}\). This stain is light sensitive and should be stored wrapped in aluminum foil in the refrigerator. It is originally light yellow, but darkens over time (Figure 2.37f+g). It should be discarded if it acquires a blue color. Safety note: wear gloves while using this highly acidic stain.

Reaction Pathways
The p-anisaldehyde and vanillin stains react in a similar manner, and commonly undergo Aldol and acetalization reactions to produce highly conjugated (and thus colored) compounds on TLC plates.
Aldol Reactions
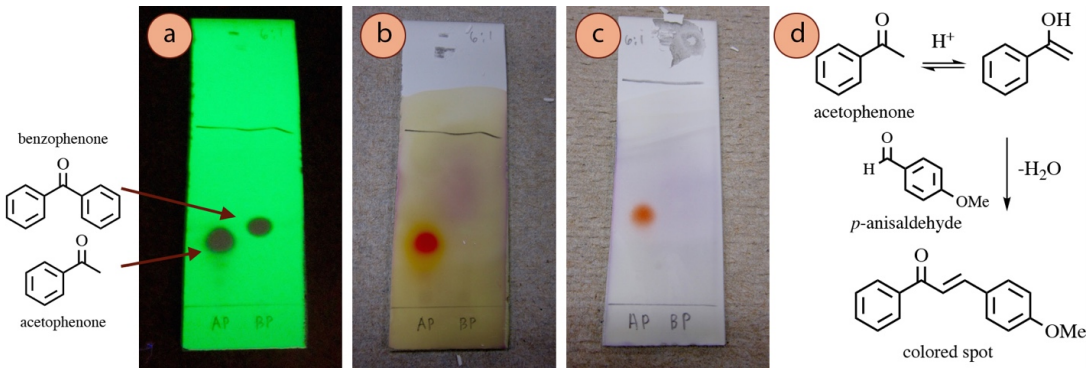
Under the acidic conditions of the stain, some aldehydes or ketones can undergo a keto-enol tautomerism, and the enol can undergo acid-catalyzed nucleophilic addition to p-anisaldehyde or vanillin through an aldol mechanism. Dehydration of the aldol product (encouraged by heating the TLC plate), results in a highly-conjugated compound (Figure 2.38d), which is why spots become colored.
For example, a TLC plate containing acetophenone and benzophenone (as seen with UV, Figure 2.38a), are stained with p-anisaldehyde and vanillin stains. Acetophenone produced a colored spot with these stains (Figures 2.38b+c) while benzophenone did not. The main difference is that benzophenone cannot form an enol, or be a nucleophile to p-anisaldehyde, so the stain is unreactive.
Acetalization Reactions
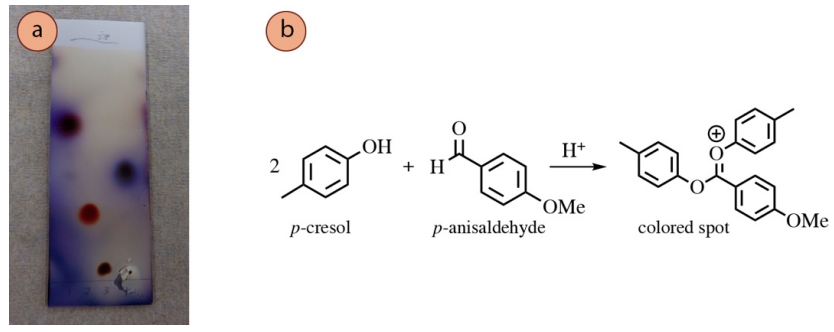
Some alcohols react with p-anisaldehyde and vanillin stains through acetalization reactions. A proposed reaction of p-cresol with p-anisaldehyde is shown in Figure 2.39b to produce a highly-conjugated cation, a possible structure of the pink spot on the TLC plate in lane #2 of Figure 2.39a. This cationic structure may look unusual, but is a feasible structure in the highly acidic conditions of the stain.
Permanganate Stain
The permanganate ion \(\left( \ce{MnO_4^-} \right)\) is a deep purple color, and when it reacts with compounds on a TLC plate (and is consumed), the plate is left with a yellow color (Figure 2.40a). The stain easily visualizes alkenes and alkynes by undergoing addition reactions (Figure 2.40d), and the color change is often immediate with these functional groups.
Permanganate is also capable of oxidizing many functional groups (e.g. aldehydes, lane 1 in Figure 2.40c), and so is considered by some to be a universal stain. Heat may be required to visualize some functional groups, and often improves the contrast between spots and the background. Heating may be done (if needed) until the background color just begins to yellow, but a brown background means the plate was overheated.
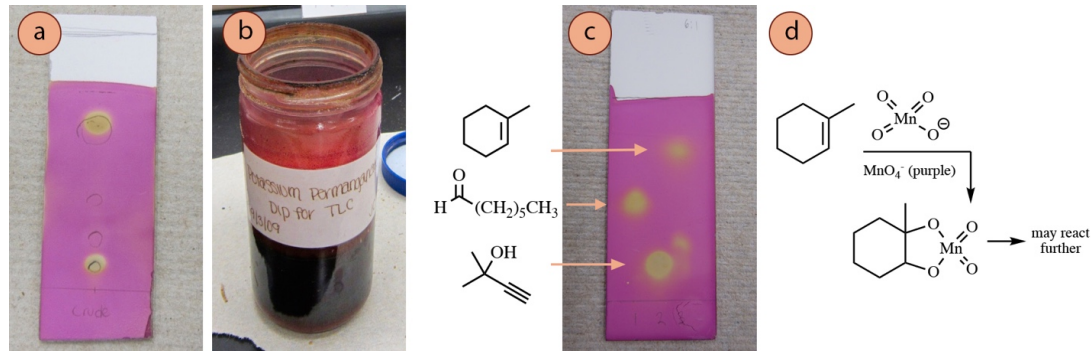
Recipe: \(1.5 \: \text{g}\) \(\ce{KMnO_4}\), \(10 \: \text{g} \: \ce{K_2CO_3}\), \(1.25 \: \text{mL} \: 10\% \: \ce{NaOH} \left( aq \right)\), and \(200 \: \text{mL}\) water. Safety note: wear gloves while using this stain, as permanganate is corrosive and will stain skin brown.
Phosphomolybdic Acid Stain
The phosphomolybdic acid stain (PMA) is considered by some a universal stain, able to visualize a wide variety of compounds (alcohols, alkenes, alkyl iodides, and many carbonyl compounds). The yellow-green PMA reagent \(\left( \ce{Mo^{6+}} \right)\) oxidizes the compound on the plate while itself being reduced to molybdenum blue (\(\ce{Mo^{5+}}\) or \(\ce{Mo^{4+}}\)). Vigorous heating is required to develop the spots, but the plate is overheated when the background begins to darken. There is typically no color differentiation between spots, as most compounds visualize as green or blue spots (Figure 2.41c).
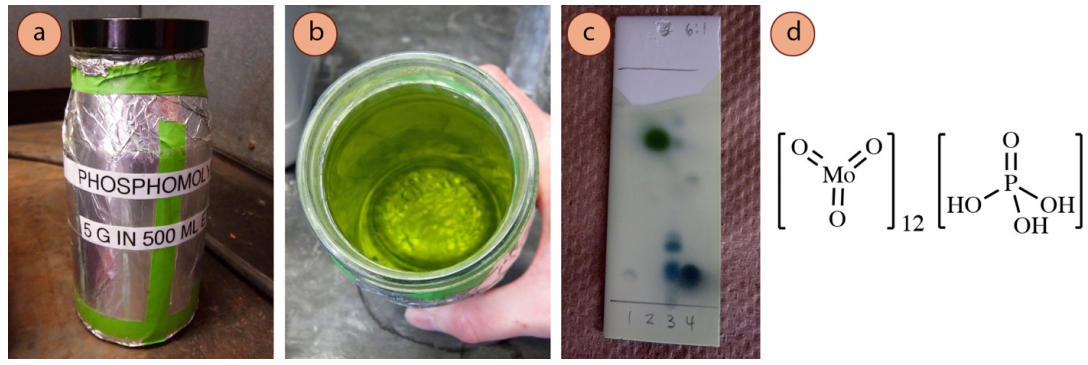
Recipe: \(5 \: \text{g}\) phosphomolybdic acid in \(500 \: \text{mL}\) ethanol. The stain is light sensitive and so should be stored in a jar under aluminum foil. The reagent is expensive, but the stain has a very long shelf life (5+ years).
Iron(III) Chloride Stain
The ferric chloride \(\left( \ce{FeCl_3} \right)\) stain is highly specific, and is used mainly to visualize phenols \(\left( \ce{ArOH} \right)\). Some carbonyl compounds with high enol content may also be visualized. \(\ce{Fe^{3+}}\) forms colored complexes with phenols (often faint blue), in the general sense of what is shown in Figure 2.42c. The actual structure of these complexes is debated\(^6\). The coloration fades rather quickly with this stain, so observations should be recorded immediately.
.png?revision=1&size=bestfit&width=703&height=317)
Recipe: \(1\%\) \(\ce{FeCl_3}\) in water and \(\ce{CH_3OH}\) (\(50\%\) each). This stain has a high shelf life (5+ years).
Bromocresol Green Stain
The bromocresol green stain is specific for acidic compounds, and should be able to visualize compounds that produce a solution lower than pH 5. Experience has shown that carboxylic acids work moderately well (first lane in Figure 2.43d) but phenols are only barely visible (indicated with an arrow in Figure 2.43d). In theory, the plate does not need to be heated after exposure to this stain, but in practice it often improves the contrast between the spots and the background.
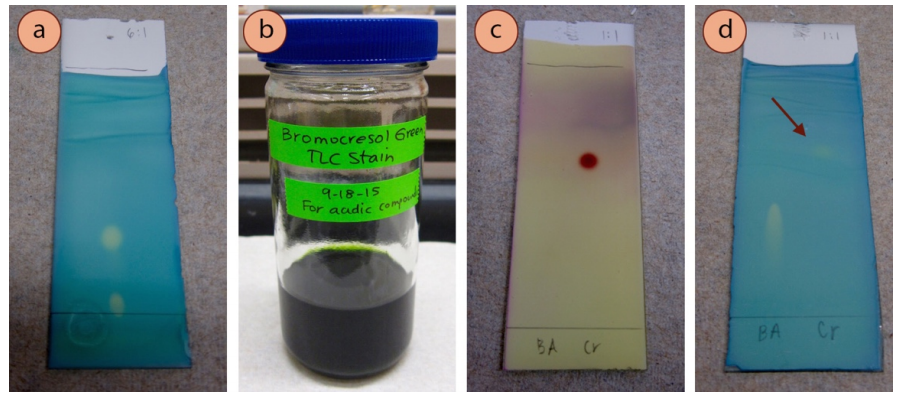
Recipe: \(100 \: \text{mL}\) absolute ethanol, \(0.04 \: \text{g}\) bromocresol green, and \(0.10 \: \text{M} \: \ce{NaOH} \left( aq \right)\) drop wise until solution turns from yellow to blue (green works as well, as in Figure 2.43b).
This stain uses an acid-base indicator, which works in a similar manner to phenolphthalein. Bromocresol green is yellow below pH 3.8 and blue above pH 5.4 (Figure 2.44a). When an acidic compound is spotted on the plate, the acid lowers the pH and causes the indicator to shift to the lower pH yellow form (Figure 2.44b).

Visualization Troubleshooting
The Compound Didn't Show Up
Even when a compound has certainly been applied on the baseline of a TLC plate, it is possible that the compound is not seen on the plate after elution. There are several possible reasons for this:
1. The compound may be too dilute.
A simple solution to a dilution problem is to add more compound to the original sample and run the TLC again using a new plate. If the compound is expected to be UV active (i.e. if it contains an aromatic ring), it is a good idea to view the TLC plate under UV light before eluting the plate (Figure 2.45a). If the sample spot is not visible before elution it will not be visible afterwards, as compounds diffuse during elution.
If the sample is determined to be only slightly too dilute, the material can be deposited multiple times before elution (Figure 2.45b). To do this, deliver a small spot of sample on the baseline, and let it fully dry (it helps to blow on it) before delivering another spot over top of the first. If the spots are not allowed to dry in between applications, the spot will be too large. If the compound is expected to be UV active, check the plate under UV light, and if necessary spot more times before elution.
2. The compound may have evaporated.
A TLC plate should be visualized immediately after elution, so if a moderate amount of time was left between running the TLC and visualizing it, evaporation may be the cause of the problem. A solution to this problem is to run the TLC again and visualize it immediately.
If the compound has a low boiling point, it probably evaporated during elution. For example, 2-pentene (boiling point \(36^\text{o} \text{C}\)) was spotted in lane #1 of Figure 1.45c. It did not stain with permanganate after elution even though the compound is reactive to the stain (an undiluted, uneluted sample of 2-pentene did stain somewhat on a scrap TLC plate, Figure 2.45d). Compounds with boiling points lower than approximately \(120^\text{o} \text{C}\) are difficult to analyze through TLC.
3. The compound may be unreactive to the visualization technique.
Visualization techniques are often tailored toward certain functional groups. For example, ultraviolet light is generally good at visualizing aromatic compounds but poor at other functional groups. If UV, iodine, or a stain fails to visualize a compound, it could mean the compound is simply not reactive to the technique, and another method should be tried.
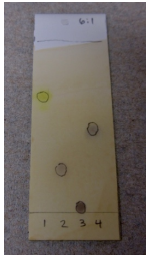
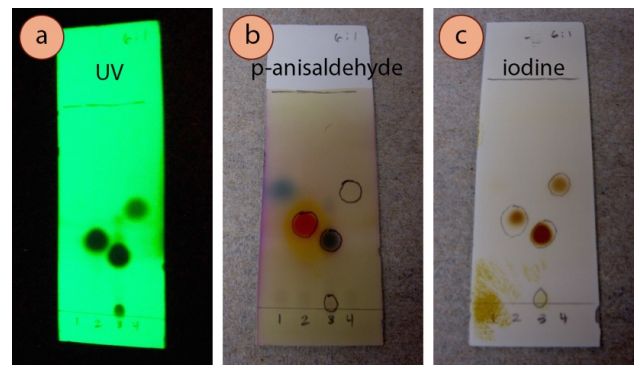
For example, Figure 2.46 shows for different compounds visualized with UV (Figure 2.46a), p-anisaldehyde stain (Figure 2.46b) and iodine (Figure 2.46c). The compound in lane #1 of all the plates (4-heptanone) was only visible with anisaldehyde stain (blue spot), and not with UV or \(\ce{I_2}\). The compound in lane #4 of all the plates (ethyl benzoate) was unreactive to anisaldehyde stain, but could be visualized with UV and \(\ce{I_2}\). The impurity present on the baseline of lane #3 (the impurity cinnamic acid) was strongly UV active, but could hardly be seen with the other stains.
The Pencil Marking from UV is Different Than the Stain
Ultraviolet light is often the first visualization technique attempted on an eluted TLC plate because it is nondestructive and rather simple to carry out. If a dark spot is seen with a UV lamp, it is customary to circle the spot with pencil (as in Figure 2.46b), as the spot will be invisible when the lamp is removed. Another visualization technique is often carried out after viewing the plate under UV, and it is not uncommon that the subsequent stain extends to a smaller or larger region than the pencil marking.
For example, the compound in lane 2 of Figure 2.46 (acetophenone) can be easily seen with ultraviolet light (Figure 2.46a), but on the plate visualized with iodine (Figure 2.46c), the pencil markings encapsulate a larger region than is seen darkened by the iodine. This is because acetophenone is very strongly UV active, but only mildly complexes with iodine. It is not uncommon for one technique to visualize a compound more effectively than another technique.
It is therefore important to be cautious in using TLC to interpret the quantity of material present in a sample, for example when assessing the quantity of an impurity (such as in lane #3 of Figure 2.46, which contains cinnamaldehyde and its impurity cinnamic acid). It is likely that a large spot is present in a greater quantity than a small spot, but it could also be that the large spot is more responsive to the visualization technique.
A Stain's Color Faded or Changed With Time
It is very common for the coloration produced by a stain to fade with time, as the compounds eventually evaporate from the plate or other slower reactions take place. For this reason, it may be a good idea to circle the spots with pencil immediately after a plate is visualized, although as spots are generally circled after viewing with UV, additional markings may cause confusion as to which compounds are UV-active. Another alternative is to place clear tape across the plate to prevent the spots from evaporating.
It is possible that the coloration produced by a stain will change with extended heating, or with time. For example, the plate in Figure 2.47 was visualized with p-anisaldehyde stain, and Figure 2.47a shows how the plate appeared immediately after heating. Figure 2.47b shows how the same plate appeared after sitting at room temperature for 30 minutes. The compound in lane #2 (acetophenone) had the most dramatic change in color during that time, changing from a bright orange to a green color. Observations recorded into a lab notebook should be of the original color of a spot.
The Staining Doesn't Make Sense
Certain visualization methods work best for certain functional groups, so a positive result with a stain can give clues about the identity of an unknown spot. However, sometimes a compound stains when it isn't "supposed to", and this can be confusing.
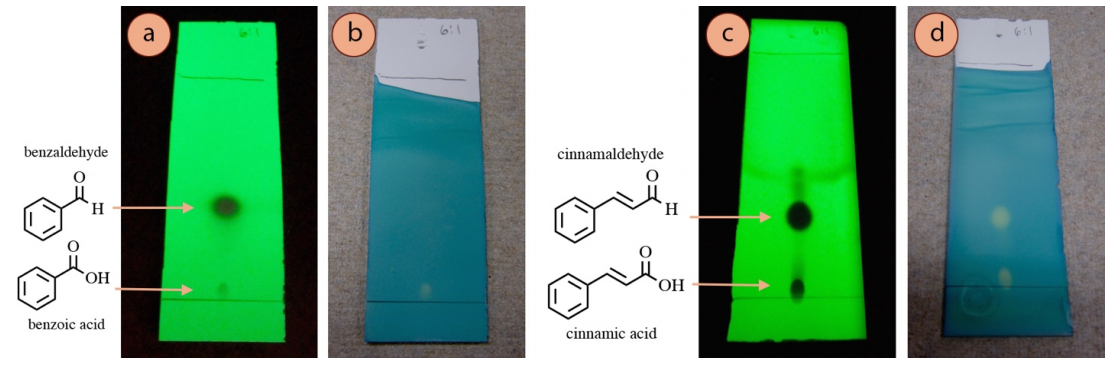
For example, a TLC of benzaldehyde visualized with UV light (Figure 2.48a) shows two spots, and based on relative \(R_f\) values, it would make sense that the dark spot is benzaldehyde and the fainter spot near the baseline is benzoic acid (caused by an oxidation of benzaldehyde). Staining of the plate with bromocresol green (a stain for acidic compounds), supports this hypothesis as the lower acidic spot is visualized with this method (Figure 2.48b). This is an example of when the staining results "make structural sense", and can even support the identification of unknown spots.
However, in a similar experiment with cinnamaldehyde, both aldehyde and carboxylic acid spots were strongly visualized with bromocresol green (Figure 2.48d), even though only one is an acidic compound. This result does not at first "make sense", and theories can only be postulated for why the aldehyde reacted with the stain.
The significance of Figure 2.48 is that interpretation of staining or lack of staining can sometimes be used to infer structure, but there may be exceptions that are difficult to explain.
\(^6\)See Nature 165, 1012 (24 June 1950); DOI: 10.1038/1651012b0
\(^7\)The TLC plate was left in the \(\ce{I_2}\) chamber for only about 2 minutes, and the spots may have developed further with additional time.